Báo cáo y học: "The effect of high correlated colour temperature office lighting on employee wellbeing and work performance" ppt
Bạn đang xem bản rút gọn của tài liệu. Xem và tải ngay bản đầy đủ của tài liệu tại đây (444.39 KB, 9 trang )
BioMed Central
Page 1 of 9
(page number not for citation purposes)
Journal of Circadian Rhythms
Open Access
Research
The effect of high correlated colour temperature office lighting on
employee wellbeing and work performance
Peter R Mills*
1,2
, Susannah C Tomkins
1
and Luc JM Schlangen
3
Address:
1
Vielife Ltd, 68 Lombard Street, London EC3V 9LJ, UK,
2
Department of Respiratory Medicine, The Whittington Hospital, London N19
5NF, UK and
3
Philips Lighting, Global Organisation Applications Lighting, P.O. Box 80020, 5600JM Eindhoven, The Netherlands
Email: Peter R Mills* - ; Susannah C Tomkins - ;
Luc JM Schlangen -
* Corresponding author
Abstract
Background: The effects of lighting on the human circadian system are well-established. The
recent discovery of 'non-visual' retinal receptors has confirmed an anatomical basis for the non-
image forming, biological effects of light and has stimulated interest in the use of light to enhance
wellbeing in the corporate setting.
Methods: A prospective controlled intervention study was conducted within a shift-working call
centre to investigate the effect of newly developed fluorescent light sources with a high correlated
colour temperature (17000 K) upon the wellbeing, functioning and work performance of
employees. Five items of the SF-36 questionnaire and a modification of the Columbia Jet Lag scale,
were used to evaluate employees on two different floors of the call centre between February and
May 2005. Questionnaire completion occurred at baseline and after a three month intervention
period, during which time one floor was exposed to new high correlated colour temperature
lighting and the other remained exposed to usual office lighting. Two sided t-tests with Bonferroni
correction for type I errors were used to compare the characteristics of the two groups at baseline
and to evaluate changes in the intervention and control groups over the period of the study.
Results: Individuals in the intervention arm of the study showed a significant improvement in self-
reported ability to concentrate at study end as compared to those within the control arm (p <
0.05). The mean individual score on a 5 point Likert scale improved by 36.8% in the intervention
group, compared with only 1.7% in the control group. The majority of this improvement occurred
within the first 7 weeks of the 14 week study. Substantial within group improvements were
observed in the intervention group in the areas of fatigue (26.9%), alertness (28.2%), daytime
sleepiness (31%) and work performance (19.4%), as assessed by the modified Columbia Scale, and
in the areas of vitality (28.4%) and mental health (13.9%), as assessed by the SF-36 over the study
period.
Conclusion: High correlated colour temperature fluorescent lights could provide a useful
intervention to improve wellbeing and productivity in the corporate setting, although further work
is necessary in quantifying the magnitude of likely benefits.
Published: 11 January 2007
Journal of Circadian Rhythms 2007, 5:2 doi:10.1186/1740-3391-5-2
Received: 21 August 2006
Accepted: 11 January 2007
This article is available from: />© 2007 Mills et al; licensee BioMed Central Ltd.
This is an Open Access article distributed under the terms of the Creative Commons Attribution License ( />),
which permits unrestricted use, distribution, and reproduction in any medium, provided the original work is properly cited.
Journal of Circadian Rhythms 2007, 5:2 />Page 2 of 9
(page number not for citation purposes)
Background
Until now the main purpose of indoor lighting has been
to aid visually directed tasks in the absence of sufficient
external light. There is, however, increasing evidence to
suggest that the brightness and wavelength of ambient
light is not only important for task completion, but that it
can also have strong non-visual biological effects, regulat-
ing the human circadian system, and impacting upon the
biological clock, mood and alertness.
A number of studies have provided support for the bene-
ficial effects of light, demonstrating a positive influence
on vitality, depressive symptoms [1], alertness. [2], psy-
chomotor vigilance and task performance. [3], morning
cortisol levels [4], and even sleep quality [5,6]. Addition-
ally, bright-light exposure during winter appears to be
effective at improving health-related quality of life and
alleviating distress [7]. Exposure to bright light in the
morning and evening in the workplace has also been
shown to improve self-reported mood, energy, alertness
and productivity in individuals with "sub-syndromal sea-
sonal affective disorder" [8].
The recent discovery of 'non-visual' retinal receptors has
confirmed an anatomical basis for the observed biological
effects of light, with the photopigment melanopsin play-
ing an essential role in phototransduction [9]. As such,
light has a broad regulatory impact on human physiology
within virtually all tissues in the body with action spectra
in humans showing the peak sensitivity for these effects to
be in the short wavelength portion of the spectrum.
[10,11].
It has been suggested that the relative shortage of daylight
exposure for office workers during daily life may compro-
mise their health and wellbeing, which in turn has stimu-
lated interest in the applications of light in the corporate
setting. Of particular relevance is the fact that whilst out-
door illuminance typically ranges between 2000 and
100,000 lux, indoor office illuminance is usually consid-
erably lower, with norms of approximately 500 lux. More-
over, typical fluorescent indoor lighting contains
considerably less short wavelength "blue spectrum" light
than natural daylight, precisely the component of the
spectrum thought to be highly relevant for achieving non-
visual, biological effects.
The amount of blue light in the spectrum of light sources
increases with increasing colour temperature. So far a
number of studies have investigated the effects of the col-
our temperature of lighting on mental activity, the central
nervous system and alertness. These studies have demon-
strated that higher colour temperatures (7500 K versus
3000 K) are more activating from the viewpoint of mental
activity level [12]. Both the parasympathetic and sympa-
thetic nervous systems are thought to be enhanced under
higher colour temperature conditions. [13] and drowsi-
ness has been observed to be higher under lower colour
temperature lighting when comparing 3000 K with 5000
K [14].
Whilst findings of previous studies have been encourag-
ing, these have been based on very small sample sizes and
generally conducted within carefully controlled labora-
tory type environments. There is currently little under-
standing of the effect of lighting conditions outside such
a setting, such as in the workplace. The current study
addresses this issue, at least in part, with its relatively large
sample size and the fact that it was conducted in a 'real
world' workplace setting.
Understanding of the action spectra of many non-visual,
biological effects remains far from comprehensive. Noc-
turnal melatonin suppression is probably the most fre-
quently studied non-visual, biological effect of light. Its
action spectrum is well established and appears to be
most sensitive to short wavelength light. [10,11]. Also, in
achieving phase advancing [15] or alerting effects.
[16,17], short wavelength light is reported to be more
effective as compared to longer wavelength light. It is
therefore reasonable to assume that a first estimate of the
non-visual effects of a light source can be derived from the
action spectrum for nocturnal melatonin suppression.
Using this assumption,17000 K lamps would be expected
to be 1.55 times as effective as compared to daylight at
equal illuminance in achieving non-visual biological
effects, and in comparison to standard low colour temper-
ature lighting of 3000 K could be expected to be 2.4 times
as effective. With this background information in mind, it
can be postulated that the new high correlated colour tem-
perature lights would have significant effects upon feel-
ings of wellbeing, alertness, concentration and possibly
work performance in those exposed to it.
The aim of this study was to quantify the effects of newly
developed high correlated colour temperature fluorescent
lighting on functioning, well-being and work perform-
ance of individuals working within a call-centre.
Methods
A prospective, controlled intervention was conducted
involving study participants working as call-handlers on
two floors of the offices of Standard Life Healthcare (SLH)
in Stockport, UK. SLH is a shift-working call centre with
long working days spanning 8 am–8 pm, divided into
early and late shifts. The two floors used for the study are
identical in their layout and operational function within
the organisation. Each floor is equipped with 600 mm
square recessed luminaries with aluminium louver (4 × 6
cells) and four 18 W fluorescent tubes. The luminaire
Journal of Circadian Rhythms 2007, 5:2 />Page 3 of 9
(page number not for citation purposes)
spacing is 2.4 m × 2.4 m. Each work area has dark floors
and white walls. Floors have windows on approximately
80% of both their East and West wall areas. Blinds are
present and used in such a way that typically more than
50% of the window area is covered.
At baseline both floors were illuminated with lights with
a correlated colour temperature of 2900 K. Throughout
the study, the lighting on one floor (floor B) was
unchanged, with employees working on this floor being
used as the control group. On the other floor (floor A), a
lighting intervention was implemented after baseline
measurements. The intervention involved a lamp change
to the entire lighting system on this floor, with all existing
fluorescent lamps being replaced by new high correlated
colour temperature fluorescent lamps (ActiViva Active,
Philips). These lamps contain an enhanced amount of
short wavelength light with a resulting higher colour tem-
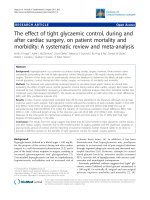
perature of 17000 K. Figure 1 shows the spectral power
distribution of the new lamps. The lamp change occurred
on a non working day (Sunday) and participants were not
informed of whether theirs was the intervention or con-
trol arm of the study.
Before the lamp change, horizontal and vertical illlumi-
nance values were determined on more than 10 desks
from each floor, deemed representative of the range of
working conditions. The horizontal illuminance was
measured at the working plane (desk surface). The vertical
illuminance was measured at the eye position, when sit-
ting behind the desk. After the lamp change the illumi-
nance values at each desk were measured once with
artificial lighting switched on, and once with it switched
off. This allowed estimation of the daylight contribution
to the indoor illuminance. All measurements were taken
at noon on a cloudy winter day.
Participation in the study was voluntary; those who did
not wish to participate were offered seating in a different
part of the building. Individuals were informed that the
aim of the study was to assess the acceptability of a new
type of indoor lighting. They were informed that the light-
ing would be changed on both floors and that they would
be required to complete online questionnaires during the
14 weeks of the study. Participants were not informed that
the aim of the study was to assess any particular aspect of
work performance or wellbeing and were not told which
floor would receive the new lighting technology. All par-
ticipants digitally accepted the terms and conditions and
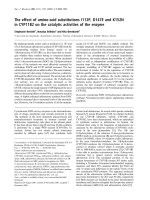
Spectral power distribution of the high (17000 K) correlated colour temperature lampsFigure 1
Spectral power distribution of the high (17000 K) correlated colour temperature lamps. The spectral power dis-
tributions of typical 3000 K and 4000 K fluorescent lamps are plotted for comparison.
Journal of Circadian Rhythms 2007, 5:2 />Page 4 of 9
(page number not for citation purposes)
provided their consent to participate in the study prior to
completing the questionnaires.
The lights used in the study have passed all appropriate
European Union safety standards and are in general pro-
duction. We were informed by the Central Office for
Research Ethics Committees in the UK that ethical com-
mittee approval was not required for this study.
Data collection
Individuals' alertness, performance, concentration and
health related quality of life were assessed by means of
two online questionnaires. The questionnaires were com-
pleted on three separate occasions, at baseline (week 1, 7–
11
th
February 2005), week 7 and week 14. Questionnaires
completion took approximately 20 minutes and was done
at one sitting during the working day.
The first questionnaire was a modification of the Colum-
bia Jet Lag Scale [18], originally designed to quantify
changes in alertness, memory, fatigue and general wellbe-
ing associated with crossing time zones. Although the cur-
rent study was not assessing jet lag, the majority of the
constructs quantified by the questionnaire was relevant to
the shift-working practices of the call centre. Nine of the
eleven items of the questionnaire were derived directly
from the original instrument with possible answers of (i)
not at all, (ii) a little bit, (iii) moderately, (iv) quite a bit
and (v) extremely. Scores were attributed to each item
from 1 to 5 depending upon the response (1 = not at all
to 5 = extremely) for a combined overall score out of 45.
A high score indicated significant issues with alertness,
lethargy, sleepiness and concentration and a low score
indicated few or no issues. The nine items were:
Over the last 3 days how much have you been bothered
by:
1. Fatigue or tiring easily
2. Trouble concentrating or thinking clearly
3. Physical clumsiness
4. Decreased daytime alertness
5. Trouble with memory
6. General feelings of weakness
7. Light headed, dizzy, or other uncomfortable sensations
in the head
8. Lethargy and sluggish feelings
9. Sleepiness during the day
The other two items were (i) self assessed job perform-
ance, which was derived from the World Health Organisa-
tion Health and Work Performance Questionnaire
(WHO-HPQ) and (ii) self assessed overall alertness and
concentration:
10. On a scale of 1 to 10, where 1 is the worst performance
anyone could have at your job and 10 is the performance
of a top worker, how would you rate your overall perform-
ance over the last 3 days?
11. On a scale of 1 to 10, where 1 is not alert at all and 10
is fully alert. All things considered, how alert and able to
concentrate have you been over the last 3 days?
The second questionnaire was the short form 36 (SF-36)
health related quality of life instrument with standard
scoring performed according to the published literature
[19]. Only certain items from this questionnaire were of
particular interest to this study; however, the question-
naire was administered in its entirety in order to avoid
introducing bias in responses given to this previously well
validated instrument [20]. On final questionnaire com-
pletion, at the end of the study, participants on both
floors were asked to comment about the lighting on their
floor. Specifically, they were asked whether it was liked or
disliked and whether they wished to keep the current
lighting or revert to previous lighting conditions.
Data analysis
Digitally collected data were transferred to STATA version
8.2 for analysis. All datasets were checked for outliers and
errors to ensure that all responses fell within the expected
range of values prescribed by the two questionnaires.
Coding of SF-36 items and derived measures was con-
ducted according to validated literature guidelines. [21]. A
combined measure was derived by summing the initial 9
items in the modified Columbia jet lag scale yielding a
maximum possible score of 45 and a minimum of 9. All
data collection and storage was compliant with the UK
Data Protection Act 1998.
All items from the modified Columbia Jet Lag Scale were
utilised in the analysis as these were all measures relevant
to the principle aims of the study, i.e. workplace function-
ing, wellbeing and work performance. Five of the SF-36
combined measures were utilised in the analysis (General
Health, Vitality, Social Functioning, Role Emotional and
Mental Health), as again these were the constructs consid-
ered relevant to the main study aims.
The distribution of variables by floor and the mean score
for each item was obtained for the range of measures
Journal of Circadian Rhythms 2007, 5:2 />Page 5 of 9
(page number not for citation purposes)
described above. The selected SF-36 combined measures
were compared with US norms. [21] in order to assess the
generalisability of findings.
Two-sided unpaired t-tests were used to compare baseline
characteristics between the control and intervention
floors. Significance was obtained on 67 degrees of free-
dom (d.f.). The within-floor improvements over the study
period were ascertained by examination of percentage
mean improvement by group compared to baseline
scores, and by using two-sided paired t-tests on 22 and 45
d.f. respectively. Finally, two-sided unpaired t-tests were
used to examine whether there was a statistically signifi-
cant difference in individual scores at the end of the inter-
vention period in the two groups, controlling for
individual baseline scores. A total of thirty questionnaire
items or scores were examined from the two question-
naires, and a Bonferroni correction for Type I errors was
accordingly applied to each set of tests based on this total
number when interpreting the significance of the t-statis-
tics obtained: the threshold t-statistic used to determine
significance was deemed equal to probability divided by
30, the total number of questionnaire items examined.
Results
Sixty-nine individuals agreed to take part in the study (23
on the control floor and 46 on the intervention floor),
representing 49% of the total eligible population during
the study period. There were no significant differences in
the distribution of participants by gender or age by floor
(X
2
= 0.30, p = 0.58; X
2
= 0.04, p = 0.84 respectively).
No statistically significant differences were observed
between horizontal or vertical desk illuminance between
the two floors at baseline. Differences between mean hor-
izontal and vertical illuminance between the two floors
after the lamp change were similarly non-significant
(Table 1). The estimated daylight contribution to the illu-
minance is also documented in Table 1. The average day-
light contribution to the horizontal illuminance is small
(average 12%), but studied daylight contributed between
40% and 55% to the vertical illuminance.
Analysis of the distribution of variables and between
group t-tests at baseline showed no significant difference
in composite scores or responses to individual items
between the two floors. Tables 2 and 3 show the mean
scores derived from the modified Columbia Scale and the
SF-36 questionnaire at baseline and study end for both
the intervention and control groups. In addition the
results of between and within group t-tests are also docu-
mented.
The mean baseline SF-36 derived scales were compared to
published reference scores from a normal US population
sample. [21]. Of the five SF-36 scales utilised in the study,
the mean scores obtained from our study population were
significantly different in three instances: the study popula-
tion reported worse health status in (i) vitality, (ii) social
functioning and (iii) mental health compared to the refer-
ence US population (respective two-sided t-tests and p-
values after application of Bonferroni correction: -5.60
and p < 0.001; -4.34 and p < 0.001; -4.92 and p < 0.001).
The remaining selected SF-36 scales (role emotional and
general health) were not significantly different.
Following the three month intervention period, explora-
tion of within-group improvements in the intervention
group showed substantial and significant improvements
in a number of areas. In contrast, significant differences
over time were found for a smaller range of variables
within the control group, with the magnitude of observed
differences tending to be less. Of interest were those vari-
ables for which a statistically detectable improvement was
observed in the intervention group, but not in the control
group. In general those individuals exposed to the new
lighting technology showed a consistent improvement in
the areas of fatigue, concentration, memory, mood and
energy as compared with individuals who did not have a
lighting change (see Table 4). Improvements of 30% or
more compared to baseline measures were observed in
the areas of (i) concentration, (ii) light headedness, (iii)
lethargy and (iv) sleepiness in the intervention group. In
addition, the intervention population showed significant
improvements in two of the five investigated SF-36 scales
at study end (vitality and mental health) compared to
baseline scores, which for vitality was highly significant (p
< 0.001). In contrast, the control group only showed bor-
derline significant improvement on the social functioning
scale (Table 4).
Table 1: Horizontal and vertical desk illuminance values on the intervention and control floors.
Floor Average horizontal illuminance at
working plane (SD)
Average % daylight contribution
to horizontal illuminance (SD)
Average vertical illuminance at
the eye position (SD)
Average % daylight contribution
to vertical illuminance (SD)
A. Intervention (17000 K) 311 lux (112) 13% (10) 170 lux (85) 40% (33)
B. Control (2900 K) 354 lux (45) 11% (10) 128 lux (44) 55% (32)
Journal of Circadian Rhythms 2007, 5:2 />Page 6 of 9
(page number not for citation purposes)
Between group comparisons at study end, controlling for
baseline differences, showed the intervention group had
significantly better status in the area of concentration
(item 2 of the Columbia Scale) (p < 0.01 after Bonferroni
correction for Type I errors). The chronology of the
observed improvements in concentration was investi-
gated further by additionally analysing the seven week
data for this item at an individual level, in order to ascer-
tain how rapidly the observed improvements had
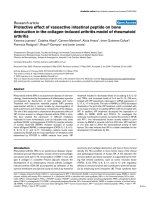
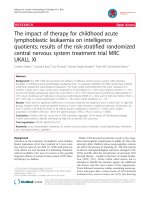
occurred. Table 5 shows the mean data by group at each
time period with Figure 2 showing the mean individual
percentage change for this item at week 7 and week 14 as
compared to baseline. The observed change in the control
group was in a negative direction (shown on the graph as
an increase in score), with little difference between scores
at week 7 or week 14. Conversely, the reduction in scores
in the intervention group reflected an improvement in
this measure, much of which had already occurred by
Table 3: Distribution of selected SF-36 combined measures by group and time period.
Baseline Study End (3 months) % change Unpaired
ttest
(df = 67)
Paired ttest
(df = 22)
Paired ttest
(df = 45)
Unpaired
ttest
(df = 67)
Item No. Description Control
(n = 23)
Intervention
(n = 46)
Control
(n = 23)
Intervention
(n = 46)
Control Intervention Baseline
comparison
Control
change
Interventio
n change
3 month
comparison
mean (SD) mean (SD) mean (SD) mean (SD) t statistic t statistic t statistic t statistic
GH General
Health
65.5 (22.4) 67.8 (20.5) 70.3 (22.0) 73.8 (17.0) 7.4 8.7 -0.44 -1.57 -2.33 -0.25
V Vitality 43.2 (23.5) 48.4 (20.4) 50.5 (19.0) 62.1 (17.1) 17.0 28.4 -0.94 -1.95 -4.44** -1.25
SF Social
Functioning
63.6 (27.7) 75.0 (25.4) 81.0 (19.5) 85.6 (17.7) 27.4 14.1 -1.71 -3.35* -3.09 1.11
RE Role
Emotional
77.5 (29.1) 80.8 (23.8) 80.4 (27.9) 86.1 (19.5) 3.7 6.5 -0.50 -0.56 -1.53 -0.39
MH Mental
Health
62.8 (22.2) 64.3 (20.5) 67.8 (16.8) 73.3 (15.8) 8.0 13.9 -0.28 -1.78 -3.42* -0.93
* = p < 0.05, ** = p < 0.001 equivalent after applying Bonferroni correction
Table 2: Distribution of Modified Columbia Scale scores examined by group and time period.
Baseline Study End (3 months) % change Unpaired t
test
(df = 67)
Paired t
test
(df = 22)
Paired t
test
(df = 45)
Unpaired t
test
(df = 67)
Item No. Description Control
(n = 23)
Interventio
n (n = 46)
Control
(n = 23)
Interventio
n (n = 46)
Control Intervention Baseline
comparison
Control
change
Interventio
n change
3 month
comparison
mean (SD) mean (SD) mean (SD) mean (SD) t statistic t statistic t statistic t statistic
1 Fatigue/tiring
easily?
2.9 (0.9) 2.9 (1.1) 2.7 (1.1) 2.1 (1.0) 7.6 26.9 -0.16 0.93 4.04** 1.76
2 Trouble
concentrating
2.5 (1.1) 2.9 (1.2) 2.5 (0.9) 1.8 (0.9) 1.7 36.8 -1.23 0.21 5.84** 3.46*
3Physical
clumsiness?
2.0 (1.1) 1.7 (1.0) 1.6 (0.6) 1.5 (0.9) 21.7 13.7 1.02 1.93 1.48 -0.70
4 Decreased
daytime
alertness?
2.7 (1.1) 2.5 (1.2) 2.1 (0.8) 1.8 (0.8) 21.0 28.1 0.74 2.73 3.96** 0.45
5 Trouble with
memory?
2.4 (1.3) 1.9 (1.1) 2.1 (0.8) 1.5 (0.7) 12.5 21.3 1.65 1.07 2.80 0.38
6 General feelings
of weakness
2.0 (1.1) 2.0 (1.0) 1.7 (0.7) 1.4 (0.8) 17.0 26.7 0.33 1.56 3.60* 0.67
7 Light-headed &
dizzy
2.2 (1.4) 2.1 (1.3) 2.0 (1.1) 1.4 (0.8) 9.8 33.7 0.26 1.10 4.04** 1.74
8 Lethargy/sluggish
feelings?
3.0 (1.0) 2.7 (1.3) 2.3 (0.8) 1.8 (0.8) 23.5 31.7 0.93 3.43* 5.07** 0.55
9 Sleepiness in day 3.0 (1.2) 2.8 (1.2) 2.6 (1.0) 1.9 (0.7) 14.5 31.0 0.66 2.47 4.90** 1.55
10 Work
performance
7.0 (1.7) 6.4 (1.5) 7.3 (1.6) 7.6 (1.4) 4.4 19.4 1.45 -1.16 -6.07** -2.72
11 Alertness and
concentration
6.2 (1.8) 6.1 (1.9) 6.8 (1.7) 7.5 (1.8) 9.9 22.9 0.23 -2.13 -4.34** -1.57
Combined Score
(first 9 items)
22.7 (7.5) 21.5 (8.3) 19.5 (5.2) 15.4 (5.7) 14.3 28.6 0.59 2.60 5.22** 1.53
* = p < 0.05, ** = p < 0.001 equivalent after applying Bonferroni correction
Journal of Circadian Rhythms 2007, 5:2 />Page 7 of 9
(page number not for citation purposes)
week 7. The changes in the two groups is reflected by two-
sided unpaired t-tests that explore the difference between
the groups at each time period and are significant both at
week 7 and week 14. (t = 2.48, p = 0.02 at week 7; t = 3.46,
p = 0.001 at week 14).
Although not reaching statistical significance after Bonfer-
roni correction, between group analysis of self-reported
work performance over the 3 months of the study showed
a sizeable positive trend in favour of the intervention.
Within group analysis yielded an almost 20% increase in
mean work performance score in the intervention group,
with only marginal changes seen within the control
group, suggesting this area would warrant further explora-
tion in future studies.
Discussion
The present study is the first to investigate the ability of
newly developed 17000 K fluorescent lights to achieve
non-visual, biological effects within a workplace setting.
Despite having had a relatively large number of partici-
pants compared to existing research in the field, the total
number taking part in the study was still small. This,
together with the fact that there was an uneven distribu-
tion of subjects in the two experimental groups makes
drawing firm conclusions difficult. If the control arm of
the study contained a greater number of individuals it is
possible that the within group analysis for this group
would have yielded more significant results, akin to those
seen in the intervention arm. Certainly the direction of
observed changes within the control arm was often in the
same direction as that seen within the intervention arm.
A further consideration is that this was not a fully blinded
study. Although participants were not explicitly told to
which group they were assigned, feedback indicated that
the lighting differed visually between the two floors. There
is hence the possibility of biased responses to question-
naires by those on either floor and cross contamination of
information between the groups. There is also a possibil-
ity of bias in responses due to the Hawthorne effect
[22,23] and indeed, the placebo response is well recog-
nized within lighting studies. [24,25]. Although every
effort was taken to ensure study participants were not
influenced as to the possible outcomes of the study, this
cannot be fully discounted. As it is not possible to quan-
tify the extent of such bias, any difference in the relative
improvements of indicators between groups must be
interpreted with care. This having been said, this was a
'real world' study designed to ascertain whether the posi-
tive effects of high correlated colour temperature lighting
observed in a more controlled environment could be
translated to the workplace.
Of note, our sample differed at baseline in a number of
SF-36 measures from a general US population. [21], with
a tendency for lower scores on some of the scales indicat-
ing poorer self-reported health. This modest difference is
Table 5: Trouble concentrating or thinking clearly at baseline, week 7 and week 14 by group. Mean score derived from the Columbia
Scale according to response to the second question, "Over the last 3 days how much have you been bothered by trouble concentrating
or thinking clearly? Possible answers and scoring: 1 = not at all, 2 = a little bit, 3 = moderately, 4 = quite a bit, 5 = extremely.
Time point Control (n = 23) Intervention (n = 46)
mean score (SD) mean score (SD)
Baseline 2.5 (1.1) 2.9 (1.2)
Week 7 2.6 (1.1) 1.9 (0.9)
Study end (Week 14) 2.5 (0.9) 1.8 (0.9)
Table 4: Areas of substantial improvement in the intervention group compared to baseline measures (where a concomitant
improvement was not observed in the control group).
Area Description Percentage Improvement over baseline measure
Fatigue Item of original Columbia Scale 26.9%
Concentration Item of original Columbia Scale 36.8%
Daytime Alertness Item of original Columbia Scale 28.1%
Feelings of Weakness Item of original Columbia Scale 26.7%
Light-headedness Item of original Columbia Scale 33.7%
Sleepiness Item of original Columbia Scale 31.0%
Work Performance Additional item (derived from WHO-HPQ) 19.4%
Alertness & oncentration Additional item 22.9%
Vitality Combined measure from SF-36 28.4%
Mental Health Combined measure from SF-36 13.9%
Journal of Circadian Rhythms 2007, 5:2 />Page 8 of 9
(page number not for citation purposes)
not unexpected, given the shift working nature of study
participants, and serves to highlight the health and well-
being issues experienced by shift-workers in call centres.
Since the study was conducted from February to May,
some of the improvements observed may be attributable
to seasonal effects, associated with the lengthening of days
during the transition from winter to spring. There were
indeed improvements observed in both groups for a
number of measures, and improvements in the control
group may provide an indication of the magnitude of the
seasonal effects on the measures collected here. However,
it is reassuring that there was a statistically significant dif-
ference between groups for a key measure at study end,
which can reasonably be attributed to the effects of the
intervention, beyond any seasonal effects. It is encourag-
ing that findings indicate improvements in a number of
self-reported measures including aspects relating to con-
centration, alertness and energy.
It appears that the lights contributed to general feelings of
well-being, which may plausibly have led to the observed
self-reported improvements in work performance. For the
duration of the study SLH provided weekly group call
handling data for both floors, and although this was not
individual-specific, and hence not amenable to robust sta-
tistical analysis, it did show a modest improvement in the
proportion of incoming calls answered from week 9 until
the end of the study in the intervention group as com-
pared to the control group (0.53%) which within the con-
text of a large call-handling centre could lead to significant
improvements in customer satisfaction.
The present study did not investigate the effect of the light
intervention on the sleep quality of participants directly;
however, it is possible that some of the observed effects
were associated with an improvement in sleep quality.
Exposure to bright light during the daytime has been
reported to enhance nocturnal melatonin levels [26,27]
and improve sleep [28,29] and although the present study
did not use bright light conditions, the larger amount of
short wavelength light in the high correlated colour tem-
perature light sources used for the intervention may have
resulted in an ambience more analogous to the lighting
conditions outdoors. It is certainly feasible that compared
to conventional light sources, lamps with enhanced short
wavelength composition may be used to reduce the light
levels needed for achieving biological, non-visual effects
so that these effects can be realised in an energy efficient
way. With greater awareness of environmental issues and
energy consumption globally, this is an area that should
be investigated further.
Feedback from study participants indicated that the new
lighting was well tolerated, compared with the standard
lighting, and was preferred by the majority of individuals.
Most pertinently, feedback indicated that the majority of
participants on the intervention floor (41 of the 46)
wished to keep the new lights at the end of the interven-
tion period. The specific wellbeing effects of the new light-
ing found in this study probably explain, at least in part,
the high acceptance of these lights.
The questionnaires used in this study are not specifically
designed to evaluate the effect of lighting interventions in
the workplace; however, certain individual questions
reported in this paper appear informative in this context,
and on this basis we would recommend questions from
the Columbia Jet Lag scale, and a selection of the scales
from the SF-36 questionnaire, for future evaluation of
lighting conditions.
Knowledge about potential health and well-being related
benefits of light has led to an understanding of the need
for indoor lighting strategies that are optimal for vision
and human physiology simultaneously. Exposure to the
new generation 17000 K industrial lights in a call centre in
Stockport resulted in positive trends observed across a
wide range of wellbeing and functional status variables, as
compared to a control population, as well as a significant
improvement in reported ability to concentrate.
Conclusion
The installation of new high correlated colour tempera-
ture (17000 K) fluorescent lighting in a shift-working call
centre appears to have contributed to wide ranging
improvements in wellbeing, functioning and work per-
formance amongst study participants. The lighting is well
tolerated and has the potential to be a cost-effective means
of impacting upon employee wellbeing and productivity.
Percentage change in reported 'trouble concentrating or thinking clearly' during the preceding 3 daysFigure 2
Percentage change in reported 'trouble concentrat-
ing or thinking clearly' during the preceding 3 days.
The plot shows data from 7 and 14 weeks after baseline in
control and intervention groups (error bars represent 95%
confidence interval for the mean change).
Publish with Bio Med Central and every
scientist can read your work free of charge
"BioMed Central will be the most significant development for
disseminating the results of biomedical research in our lifetime."
Sir Paul Nurse, Cancer Research UK
Your research papers will be:
available free of charge to the entire biomedical community
peer reviewed and published immediately upon acceptance
cited in PubMed and archived on PubMed Central
yours — you keep the copyright
Submit your manuscript here:
/>BioMedcentral
Journal of Circadian Rhythms 2007, 5:2 />Page 9 of 9
(page number not for citation purposes)
Further studies are needed to quantify the observed effects
in larger and different working populations.
Abbreviations
SF-36: Short Form 36 Questionnaire
WHO-HPQ: World Health Organisation Health and
Work Performance Questionnaire
SLH: Standard Life Healthcare
Competing interests
LS is an employee of Philips, which provided the lights for
the study.
Authors' contributions
PM developed the study protocol, collected the data and
contributed to data analysis and writing of the manu-
script.
ST analysed the data and contributed to writing the man-
uscript.
LS organised the follow-up of the lighting intervention
and contributed to data analysis and writing of the manu-
script.
Acknowledgements
The authors would like to thank Standard Life Healthcare for their cooper-
ation and support during this study.
This study was funded by an unconditional educational grant from Philips
Lighting, which also manufactured the high correlated colour temperature
fluorescent lamps used for the intervention.
References
1. Partonen T, Lonnqvist J: Bright light improves vitality and alle-
viates distress in healthy people. J Affect Disord 2000, 57:55-61.
2. Kuller R, Wetterberg L: Melatonin, cortisol, EEG, ECG and sub-
jective comfort in healthy humans: impact of two fluores-
cent lamp types at two light intensities. Lighting Res Tech 1993,
25:7181.
3. Phipps-Nelson J, Redman JR, Dijk DJ, Rajaratnam SM: Daytime
exposure to bright light, as compared to dim light, decreases
sleepiness and improves psychomotor vigilance perform-
ance. Sleep 2003, 26:695-700.
4. Scheer FA, Buijs RM: Light affects morning salivary cortisol in
humans. Journal of Clin Endocrin Metab 1999, 84:3395-3398.
5. Boulos Z, Campbell SS, Lewy AJ, Terman M, Dijk DJ, Eastman CI:
Light treatment for sleep disorders: consensus report. VII.
Jet lag. J Biol Rhythms 1995, 10:167-176.
6. Campbell SS, Terman M, Lewy AJ, Dijk DJ, Eastman CI, Boulos Z:
Light treatment for sleep disorders: consensus report. V.
Age-related disturbances. J Biol Rhythms 1995, 10:151-154.
7. Park SJ, Tokura H: Bright light exposure during the daytime
affects circadian rhythms of urinary melatonin and salivary
immunoglobulin A. Chronobiol Int 1999, 16:359-371.
8. Avery DH, Kizer D, Bolte MA, Hellekson C: Bright light therapy
of subsyndromal seasonal affective disorder in the work-
place: morning vs. afternoon exposure. Acta Psychiatr Scand
2001, 103:267-274.
9. Berson DM, Dunn FA, Takao M: Phototransduction by retinal
ganglion cells that set the circadian clock. Science 2002,
295:1070-1073.
10. Thapan K, Arendt J, Skene DJ: An action spectrum for melatonin
suppression: evidence for a novel non-rod, non-cone pho-
toreceptor system in humans. J Physiol 2001, 535:261-267.
11. Brainard GC, Hanifin JP, Greeson JM, Byrne B, Glickman G, Gerner
E, Rollag MD: Action spectrum for melatonin regulation in
humans: evidence for a novel circadian photoreceptor.
J Neu-
rosci 2001, 21:6405-6412.
12. Deguchi T, Sato M: The effect of color temperature of lighting
sources on mental activity level. Ann Physiol Anthropol 1992,
11:37-43.
13. Mukae H, Sato M: The effect of color temperature of lighting
sources on the autonomic nervous functions. Ann Physiol
Anthropol 1992, 11:533-538.
14. Noguchi H, Sakaguchi T: Effect of illuminance and color temper-
ature on lowering of physiological activity. Appl Human Sci
1999, 18:117-123.
15. Revell VL, Arendt J, Terman A, Skene DJ: Short-wavelength sensi-
tivity of the human circadian system to phase-advancing
light. Journal of Biological Rhythms 2005, 20:270-272.
16. Revell VL, Arendt J, Fogg LF, Skene DJ: Alerting effects of light are
sensitive to very short wavelengths . Neurosci Lett 2006,
399:96-100.
17. Lockley SW, Evans EE, Scheer FA, Brainard GC, Czeisler CA, Aesch-
bach D: Short-wavelength sensitivity for the direct effects of
light on alertness, vigilance, and the waking electroencepha-
logram in humans. Sleep 2006, 29:161-168.
18. Spitzer RL, Terman M, Williams JB, Terman JS, Malt UF, Singer F, Lewy
AJ: Jet lag: clinical features, validation of a new syndrome-
specific scale, and lack of response to melatonin in a rand-
omized, double-blind trial. Am J Psychiatry 1999, 156:1392-1396.
19. Hays RD, Sherbourne CD, Mazel RM: The RAND 36-Item Health
Survey 1.0. Health Econ 1993, 2:217-227.
20. Ware J Jr., Kosinski M, Keller SD: A 12-Item Short-Form Health
Survey: construction of scales and preliminary tests of relia-
bility and validity. Med Care 1996, 34:220-233.
21. Ware JEJ, .: SF-36 Health Survey update. Spine 2000,
24:3130-3139.
22. Roethlisburger FJ, Dickson WJ: Management and the Worker.
Harvard University Press; 1939.
23. Snow CE: Research on Industrial Illumination. The Tech Engi-
neering News 1927, 8:257, 272-274, 282.
24. Eastman CI: What the Placebo LIterature Can Tell Us About
LIght Therapy for SAD. Psychopharmacol Bull 1990, 26:495-504.
25. Eastman CI: Is Bright Light Therapy a Placebo. In Seasonal Affec-
tive Disorder Practice and Research Edited by: Pertonen T and Magnus-
son A. New York, Oxford University Press; 2001:103-112.
26. Mishima K, Okawa M, Shimizu T, Hishikawa Y: Diminished mela-
tonin secretion in the elderly caused by insufficient environ-
mental illumination. J Clin Endocrinol Metab 2001, 86:129-134.
27. Park SJ, Tokura H: Bright light exposure during the daytime
affects circadian rhythms of urinary melatonin and salivary
immunoglobulin A. Chronobiol Int 1999, 16:359-371.
28. Wakamura T, Tokura H: Influence of bright light during day-
time on sleep parameters in hospitalized elderly patients. J
Physiol Anthropol Appl Human Sci 2001, 20:345-351.
29. Van Someren EJ, Kessler A, Mirmiran M, Swaab DF: Indirect bright
light improves circadian rest-activity rhythm disturbances in
demented patients. Biol Psychiatry 1997, 41:955-963.