Báo cáo y học: "A new approach to understanding the impact of circadian disruption on human health'''' pps
Bạn đang xem bản rút gọn của tài liệu. Xem và tải ngay bản đầy đủ của tài liệu tại đây (553.42 KB, 14 trang )
Journal of Circadian Rhythms
BioMed Central
Open Access
Research
A new approach to understanding the impact of circadian
disruption on human health
Mark S Rea*, Andrew Bierman, Mariana G Figueiro and John D Bullough
Address: Lighting Research Center, Rensselaer Polytechnic Institute, 21 Union Street, Troy, NY 12180, USA
Email: Mark S Rea* - ; Andrew Bierman - ; Mariana G Figueiro - ;
John D Bullough -
* Corresponding author
Published: 29 May 2008
Journal of Circadian Rhythms 2008, 6:7
doi:10.1186/1740-3391-6-7
Received: 14 March 2008
Accepted: 29 May 2008
This article is available from: />© 2008 Rea et al; licensee BioMed Central Ltd.
This is an Open Access article distributed under the terms of the Creative Commons Attribution License ( />which permits unrestricted use, distribution, and reproduction in any medium, provided the original work is properly cited.
Abstract
Background: Light and dark patterns are the major synchronizer of circadian rhythms to the 24hour solar day. Disruption of circadian rhythms has been associated with a variety of maladies.
Ecological studies of human exposures to light are virtually nonexistent, however, making it difficult
to determine if, in fact, light-induced circadian disruption directly affects human health.
Methods: A newly developed field measurement device recorded circadian light exposures and
activity from day-shift and rotating-shift nurses. Circadian disruption defined in terms of behavioral
entrainment was quantified for these two groups using phasor analyses of the circular crosscorrelations between light exposure and activity. Circadian disruption also was determined for rats
subjected to a consistent 12-hour light/12-hour dark pattern (12L:12D) and ones subjected to a
"jet-lagged" schedule.
Results: Day-shift nurses and rats exposed to the consistent light-dark pattern exhibited
pronounced similarities in their circular cross-correlation functions and 24-hour phasor
representations except for an approximate 12-hour phase difference between species. The phase
difference reflects the diurnal versus nocturnal behavior of humans versus rodents. Phase
differences within species likely reflect chronotype differences among individuals. Rotating-shift
nurses and rats subjected to the "jet-lagged" schedule exhibited significant reductions in phasor
magnitudes compared to the day-shift nurses and the 12L:12D rats. The reductions in the 24-hour
phasor magnitudes indicate a loss of behavioral entrainment compared to the nurses and the rats
with regular light-dark exposure patterns.
Conclusion: This paper provides a quantitative foundation for systematically studying the impact
of light-induced circadian disruption in humans and in animal models. Ecological light and activity
data are needed to develop the essential insights into circadian entrainment/disruption actually
experienced by modern people. These data can now be obtained and analyzed to reveal the
interrelationship between actual light exposures and markers of circadian rhythm such as restactivity patterns, core body temperature, and melatonin synthesis. Moreover, it should now be
possible to bridge ecological studies of circadian disruption in humans to parametric studies of the
relationships between circadian disruption and health outcomes using animal models.
Page 1 of 14
(page number not for citation purposes)
Journal of Circadian Rhythms 2008, 6:7
Background
As the earth rotates, all species on the surface of the planet
are exposed to 24-hour patterns of light and darkness. In
response to these regular, daily oscillations to the natural
light-dark cycle, these species have evolved endogenous
circadian rhythms that repeat approximately every 24
hours [1,2]. Examples of circadian rhythms include oscillations in core body temperature [3], hormone secretion
[4], sleep [5], and alertness [6]. Circadian oscillations also
exist at a cellular level, including cell mitosis and DNA
damage response [7,8]. These oscillations are a result of a
small group of clock genes inside the cell nuclei creating
interlocked transcriptional and post-translational feedback loops. The timing of these circadian clock genes is
generally orchestrated by a master biological clock located
in the suprachiasmatic nuclei (SCN) [9] of the hypothalamus of the brain [10]. The master clock in the SCN provides precise time cues throughout the body to regulate
these diverse physiological, hormonal, and behavioral circadian patterns. However, in total darkness the timing of
the SCN will become asynchronous with the solar day
because in humans the period of the master clock is
slightly longer than 24 hours [1]. To maintain synchrony
with the external world, the light-dark pattern incident on
the retina resets the timing of the SCN, so that as we travel
across time zones, we can entrain our biological functions
to the local environment. If the period of the light-dark
pattern is too long or too short, or if the light and dark
exposures become aperiodic, the master clock can lose
control of the timing of peripheral circadian clocks.
Maintaining the phase-relation ordering of the various circadian rhythms from molecular to behavioral levels
appears to be crucial for coordinated functions throughout the human body. Lack of synchrony between the master clock and the peripheral clocks can lead to
asynchronies within cells (e.g., cell cycle) and between
organ systems (e.g., liver and pancreas). This breakdown
in synchrony, as demonstrated most profoundly with jet
lag, disrupts sleep [11], digestion [12], and alertness [13].
Chronic disruptions can contribute to cardiovascular
anomalies [14] and accelerated cancerous tumour growth
[15] in animal models. In humans, epidemiological studies have shown that rotating-shift nurses, who experience
a marked lack of synchrony between activity-rest patterns
and light-dark cycles (as shown in this report), are at
higher risk of having breast cancer compared to day-shift
nurses [16]. In fact, the World Health Organization has
identified rotating-shift work as a probable cause of cancer [17]. In addition to heightened cancer risks, other disorders have been associated with rotating-shift work, such
as diabetes and obesity, suggesting again a role for circadian disruption in the development and progression of
diseases [18].
/>
Despite the growing evidence that circadian disruption
negatively affects human health [18,19], the logical chain
linking light-induced circadian disruption to morbidity
and mortality still has not been forged. If the impact of circadian disruption is to be studied with any degree of accuracy, it is important to quantitatively characterize light
and dark as it affects the human circadian system because
the light-dark pattern is the primary synchronizing stimulus for our circadian system [1]. It is also necessary to
quantify the temporal characteristics of circadian light and
dark exposures actually experienced by people [20]. Without quantification of the actual circadian light and dark
exposures experienced by people, it will be difficult to
relate the findings from controlled laboratory studies of
light-induced circadian disruption in humans to the
expected health of any human sub-population, including
rotating-shift workers. These actual circadian light and
dark exposures in human populations must also be incorporated into parametric studies using animal models as
surrogates for particular human diseases or maladies if we
are to gain any detailed insight into the role of circadian
disruption on human health. Since nocturnal species are
used almost exclusively as animal models in this research,
a method needs to be established to relate actual circadian
light and dark exposures in humans to parametrically controlled exposures of light and dark using these animal
models [21].
This paper is concerned with patterns of circadian light
and dark as they affect behavioral entrainment and how
more sophisticated studies of the relationship between
light-induced circadian disruption and human health
might be conducted. Here we present original data from
the Daysimeter [20], a device for simultaneously recording light-dark and activity-rest data in humans. Significantly, these data reveal relationships between circadian
light-dark patterns actually experienced by day-shift and
rotating-shift nurses and their own activity-rest patterns.
Original data are also presented for two groups of rats,
one placed on a 12L:12D pattern of light and dark and the
other placed on a 12L:12D pattern of light and dark regularly reversing every 48 hours. We present a novel methodology to quantify circadian entrainment/disruption in
both diurnal and nocturnal species, so as to allow
researchers to make direct comparisons of circadian
entrainment/disruption across species. Attention to circadian entrainment/disruption, rather than to activity alone
or to light and dark, per se, makes it possible to circumvent the diurnal-nocturnal conundrum plaguing many
comparative studies of light-induced circadian entrainment/disruption using animal models. We found that the
circadian entrainment/disruption patterns for day-shift
and rotating-shift nurses were remarkably different, but
they were remarkably similar to the patterns for two parallel groups of nocturnal rodents. The marked differences
Page 2 of 14
(page number not for citation purposes)
Journal of Circadian Rhythms 2008, 6:7
/>
in circadian entrainment/disruption patterns within species together with the marked similarities in circadian
entrainment/disruption across species, in addition to the
new method for quantifying circadian entrainment/disruption, suggest that health-related problems associated
with circadian disruption in humans can be parametrically studied using animal models.
Methods
Measuring and characterizing circadian entrainment
patterns actually experienced by humans
Daysimeter
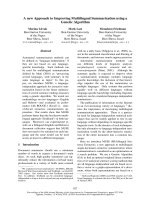
The Daysimeter was developed as a head-worn lightdosimeter and activity monitor to address measurements
of the spectral and spatial response of the human circadian system (Figure 1) [20]. Two detectors are used to
characterize the spectral-opponent, subadditive response
of the circadian system to polychromatic light and thereby
provide measurements of the circadian light stimulus
(CS) for humans (Figure 2) [22]. A transfer function relating CS to nocturnal melatonin suppression was also
developed [22] to characterize the effective stimulus for
non-visual responses associated with optical radiation on
the retina (Figure 3). Entrainment to the circadian lightdark pattern is not directly related to nocturnal melatonin
suppression, but as demonstrated by Zeitzer et al. [23],
both light-induced phase shifting and nocturnal melatonin suppression in humans appear to have similar, if
not identical, functional relationships to optical radiation
of the same spectral power distribution. The Daysimeter
also measures head movements with solid-state accelerometers to characterize behavioral activity. Detailed information about the Daysimeter is available elsewhere [20].
It should be emphasized that activity as measured by the
Daysimeter is not a direct measure of the endogenous
clock in the SCN. Like every downstream measure of circadian function, behavior can only yield partial insight
into circadian entrainment. It is presently impossible to
directly measure SCN activity in vivo, and thus it is impossible to measure entrainment in the purest sense in living
and active humans; the term "behavioral entrainment" is
used in this paper to describe the observed levels of synchrony between light-dark exposures and activity-rest
responses as measured by the Daysimeter.
Data collection
The Daysimeter was sent to nurses throughout the United
States to measure their actual CS exposures and activity for
seven consecutive days. Forty-three pre-menopausal
female nurses, both day-shift (n = 32) and rotating-shift
nurses (n = 11), participated in the study. They wore the
Daysimeter for seven consecutive days and were scheduled to work at least two and no more than three consecutive days during that period. The Daysimeter was worn
while nurses were awake. The nurses were instructed to
place the Daysimeter next to them when they slept or
bathed. After the seven-day recording session, they
returned the device for data analyses. In addition to wearing the Daysimeter, participating nurses provided urine
samples, obtained every four hours, for subsequent melatonin assay and filled out a chronotype questionnaire
[Horne-Östberg Morningness-Eveningness Questionnaire
(MEQ)] and a lighting survey. The nurses were also asked
to keep a sleep log, writing down the times they went to
bed and any other information about their sleep schedules. These sleep logs were used to match the exact time
photopic
photopic cell
log
converter
blue
blue cell
crystal
clock
MSP430
processor
serial
link
ref
ref voltage
volatile
memory
accelerometer
non-volatile
memory
host
computer
battery
x
y
LED
Figure 1
Daysimeter and functional block diagram
Daysimeter and functional block diagram.
Page 3 of 14
(page number not for citation purposes)
Journal of Circadian Rhythms 2008, 6:7
/>
1.0
Narrowband
Equal energy
Brainard
Thapan
relative value
0.8
0.6
0.4
0.2
0
-0.2
400
500
600
700
wavelength (nm)
percent suppression (%)
Figure response graph
Spectral2
Spectral response graph. Spectral response functions generated from the model of human circadian phototransduction by
Rea et al. [22]. The dashed line represents the predicted spectral response function for an equal energy spectrum light source.
The continuous line represents the predicted spectral responses to individual, narrow-band light sources. The two sets of symbols represent empirical spectral response data from two independent laboratories [34, 35].
80%
r² = 0.82
60%
McIntyre et al.
Rea et al.
Brainard et al.
Thapan et al.
Figueiro et al.
40%
20%
0%
0.0001
0.001
0.01
0.1
1
10
CS value
Figure transfer function graph
Logistic 3
Logistic transfer function graph. Logistic transfer function relating nocturnal melatonin suppression to the rectified circadian light stimulus (CS) from the model of human circadian phototransduction by Rea et al. [22]. Data from several studies
using both narrow-band [34, 35] and polychromatic light sources [36–38] to induce nocturnal melatonin suppression were
plotted as a function of CS. A logistic function from Zeitzer et al. [23] was used to fit the data yielding a regression coefficient
(r2) for the transfer function equal to 0.82. Figure was adapted from Rea et al. [22].
Page 4 of 14
(page number not for citation purposes)
Journal of Circadian Rhythms 2008, 6:7
/>
nurses started wearing the device. Presented here are only
the Daysimeter data.
ilar amounts of activity in the light and in the dark
throughout the eight-day observation period.
Measuring and characterizing circadian behavioral
entrainment patterns in nocturnal rodents
Data collection
Forty albino female Sprague-Dawley rats (Rattus norvegicus) were housed in individual cages illuminated by a
lighting system previously developed by Bullough et al.
[24] to determine the spectral and absolute sensitivities of
another nocturnal rodent (murine). Based upon the
mouse phase response curve (PRC) obtained in that
study, a spectral power distribution (nearly monochromatic green light; λmax = 525 nm, half-bandwidth = 35
nm) and irradiance (approximately 5 μW/cm2 on the cage
floor) were selected to provide the light stimulus to the
Sprague-Dawley rats. This particular light stimulus for
nocturnal rodents was estimated to be above threshold
and below saturation for stimulation of the rat circadian
system. The light stimulus for the rats was precisely controlled using a light-emitting diode (LED) light-delivery
system fabricated and installed in every cage. The lightdelivery system provided better controlled and more biologically meaningful circadian light stimulation to the rats
than the fluorescent ceiling lighting traditionally used to
provide bright, ambient illumination throughout an animal colony [21].
Results
As with the nurse data, the rat data were obtained from
two experimental groups: 20 rats were exposed to a consistently repeating pattern of 12 hours of light (12L) followed by 12 hours of darkness (12D), and another 20 rats
(the "jet-lagged" group) were exposed to a 12L:12D pattern where the phase of the light-dark cycle was reversed
every 48 hours (as if this group of rats instantly travelled
back and forth from Asia to the Americas every other day).
Animals were housed individually and allowed to eat and
drink ad libidum.
Wheel running was measured continuously throughout
the experimental session and used as the measure of activity-rest in these animals. The accumulated number of
wheel revolutions was recorded at 10-minute time intervals. At the start of the experiment, the photoperiods for
both groups were in phase with each other, and the animals exhibited typical nocturnal behavior (active during
the dark phase, inactive during the light phase). To allow
for acclimation to the cages and to the lighting by the rats,
wheel-running data were not collected until the third day
of the study, by which time the photoperiod for the "jetlagged" group had reversed. Most of the activity in the
"jet-lagged" group on that day occurred during the light
phase. As shown below, the animals in this group were
unable to entrain to the regularly reversing photoperiod
and exhibited behavior similar to free-running, with sim-
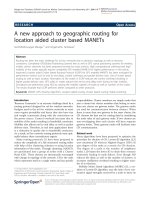
Figure 4 shows activity and CS exposure data for two representative nurses (one day-shift and one night-shift) and
Figure 5 shows the wheel-running data and relative light
level for two representative animals (one in the 12L:12D
group and one in the "jet-lagged" group).
Humans
Figures 4a and 4b show activity for two representative
nurses, one day-shift nurse (4a) and one rotating-shift
nurse (4b), for seven consecutive days. Figures 4c and 4d
illustrate the measured CS exposure values obtained
directly from the Daysimeter and subsequently transformed using a logistic stimulus-response function representing the entire response range of the circadian system,
from threshold to saturation (Figure 3). The transformation was employed to estimate the functional input to the
human circadian system, which appears to apply to both
light-induced nocturnal melatonin suppression and
phase shifting [23].
Examination of Figure 4 reveals subtle but important differences in the activity and transformed CS data for these
two nurses. In the case of the day-shift nurse (Figures 4a
and 4c), there appears to be a consistent relationship
between the activity and transformed CS values over the
course of the seven-day measurement session. For the
rotating-shift nurse (Figures 4b and 4d), however, this
synchrony is much less pronounced. Qualitatively then,
and as might be expected, these two example sets of data
suggest that the day-shift nurse's behavior is much more
synchronized to the light-dark cycle than that of the rotating-shift nurse. Parenthetically, Figure 4 also reveals "flat"
periods for both nurses over the course of the seven-day
measurement period, which indicate prolonged times of
rest and, usually, darkness.
Although many analyses of the activity and of the transformed CS data are possible, the data in Figure 4 were
used to develop a quantitative measure of circadian
behavioral entrainment/disruption for day-shift and for
rotating-shift nurses. The behavioral entrainment analyses
were based on the circular cross-correlations of activity
and light exposure data. Circular cross-correlation, an
analysis technique commonly used in the field of signal
processing, involves the concept of time-shifting one signal relative to another to determine relationships between
signals that might otherwise be obscured due to relative
timing differences. The activity and the transformed CS
data can be considered as two time-varying signals whose
time-matched values can be multiplied together and then
the products at every time of data acquisition integrated
Page 5 of 14
(page number not for citation purposes)
Journal of Circadian Rhythms 2008, 6:7
a.
b.
day-shift nurse
3
2
1
0
rotating-shift nurse
4
Activity (arb. units)
4
Activity (arb. units)
/>
3
2
1
0
0
1
2
3
4
5
6
0
7
1
2
d.
day-shift nurse
0.8
CS logistic (arb. units)
CS logistic (arb. units)
c.
0.6
0.4
0.2
0
0
1
2
3
4
Elapsed time (days)
3
4
5
6
7
5
6
7
Elapsed time (days)
Elapsed time (days)
5
6
7
rotating-shift nurse
0.8
0.6
0.4
0.2
0
0
1
2
3
4
Elapsed time (days)
Figure and
Activity 4 light exposure graphs: Nurses
Activity and light exposure graphs: Nurses. Activity and light exposure data plotted as a function of elapsed number of
days for a day-shift nurse (4a, 4c) and for a rotating-shift nurse (4b, 4d). Data collection started at a different clock time for
each subject, so each "day" is a different 24-hour period of time for each subject. Circadian light stimulus (CS) exposures were
measured with the Daysimeter [20], and transformed to range between the limits of human melatonin suppression (CS Logistic) shown in Figure 3.
into a single value. This value is proportional to the covariance of the two signals. When normalized by dividing by
the number of data samples, subtracting the product of
the individual signal means, and dividing by the product
of the standard deviations of each signal, the result will
always be limited to values between -1 and 1 (i.e., a correlation coefficient). The multiply-and-integrate operation
can be repeated following a small shift in time by one of
the signals (e.g., the activity trace, Figure 4a) with respect
to the other (e.g., the transformed CS trace, Figure 4c) and
a new correlation coefficient computed. Continuously
repeating this process for the entire recording period
yields a new time-varying function, the circular cross-correlation, bounded by -1 and 1, that reveals the degree to
which the two signals are systematically related to one
another for all possible alignments of phase between the
two signals. This operation is adapted from standard signal processing techniques [25], and when performed on
the periodic light and activity data, yields what are termed,
for the purposes of this paper, behavioral entrainmentcorrelation functions.
Figure 6 shows two behavioral entrainment-correlation
functions relating the transformed CS data to the activity
data: one for the day-shift nurse (Figure 6a) and one for
the rotating-shift nurse (Figure 6b) in Figure 4. As can be
readily appreciated from Figure 6a, the activity of the dayshift nurse is highly entrained to her light-dark pattern
throughout the seven days, as exhibited by the regularly
oscillating, 24-hour period of her behavioral entrainment-correlation function. More specifically, this nurse,
typical of almost all day-shift nurses, has a peak correlation near the zero-phase marker and again at every 24hour multiple. This day-shift pattern is in marked contrast
to the behavioral entrainment-correlation pattern for the
rotating-shift nurse (Figure 6b). Her pattern is aperiodic,
exhibiting minor correlation peaks at times other than at
the 24-hour phase markers. The pattern of the rotatingshift nurse is of much lower amplitude and very distorted
compared to the smoothly varying and periodic behavioral entrainment-correlation pattern of the day-shift nurse.
Page 6 of 14
(page number not for citation purposes)
Journal of Circadian Rhythms 2008, 6:7
a.
/>
b.
12L:12D rat
"jet-lagged" rat
600
Activity (wheel revs/10 min)
Activity (wheel revs/10 min)
600
500
400
300
200
100
0
0
1
2
3
4
5
6
7
500
400
300
200
100
0
8
0
1
2
c.
3
4
5
6
7
8
6
7
8
Elapsed time (days)
Elapsed time (days)
d.
12L:12D rat
Light
on
Light
on
"jet-lagged" rat
off
off
0
1
2
3
4
5
6
7
8
Elapsed time (days)
0
1
2
3
4
5
Elapsed time (days)
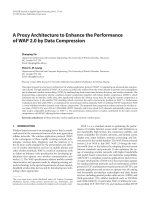
Figure and
Activity 5 light exposure graphs: Rats
Activity and light exposure graphs: Rats. Activity and light exposure data plotted as a function of elapsed time (days) for
a 12L:12D rat (5a, 5c) and for a "jet lagged" rat (5b, 5d). At the start of the experiment, the photoperiods were in phase. In the
first two days of the experiment, the photoperiods for both groups were the same. Wheel-running data were not collected
until the third day of the study, by which time the photoperiod for the "jet-lagged" group had reversed. Most of the activity in
the "jet-lagged" group on that day occurred during the light phase.
Nocturnal rodents
The wheel running data from the 12L:12D (e.g., see Figure
5a) rats were typical of those collected in innumerable
studies, with more active periods associated with darkness
and less active periods in the light. The "jet-lagged" group
differed considerably from the 12L:12D group, however,
in the apparent degree of association between the lightdark and the rest-activity data (e.g., see Figure 5b). For
those rats in the 12L:12D group, almost all of their wheel
running occurred in darkness; although, as is usually the
case, there was some activity in the light, particularly near
the transition times from light to dark, and there were
intervals of quiescence sporadically occurring during the
dark periods. In the "jet-lagged" group of rats, the association between wheel running and darkness was markedly
less pronounced. Indeed, after several reversals of the
light-dark cycle, the wheel running appeared to be disassociated with either light or dark.
The same analyses performed on the data from the nurses
were also applied to the data from the two groups of nocturnal rodents. The light exposure values were binary for
the rats, zero when no cage lighting was present and a
value of one when the cage lighting was administered. A
behavioral entrainment-correlation function from one
typical rat in the 12L:12D group is shown in Figure 6c. The
similarity between the entrainment-correlation function
for the sample day-shift nurse and the 12L:12D rat are
remarkable; the only apparent difference is that the latter
function is shifted approximately 12 hours with respect to
the former. This shift reflects the expected difference
between a diurnal and a nocturnal species; diurnal nurses
are active during the day and inactive at night, whereas
nocturnal rats are inactive during the light phase and
active in the dark. Figure 6d shows a typical behavioral
entrainment-correlation function for one rat in the "jetlagged" group. Again, there is a marked similarity between
the entrainment-correlation functions for the rotating-
Page 7 of 14
(page number not for citation purposes)
Journal of Circadian Rhythms 2008, 6:7
b.
day-shift nurse
0.8
0.6
0.4
0.2
0
-0.2
-0.4
-0.6
-0.8
night-shift nurse
0.8
Correlation coefficient
Correlation coefficient
a.
/>
-72
c.
-48 -24 0
24 48
Time shift (hours)
0.6
0.4
0.2
0
-0.2
-0.4
-0.6
-0.8
72
d.
12L:12D rat
-48 -24 0
24 48
Time shift (hours)
72
“jet-lagged” rat
0.8
0.6
0.6
Correlation coefficient
0.8
Correlation coefficient
-72
0.4
0.2
0
-0.2
-0.4
-0.6
-0.8
-72
-48 -24 0
24 48
Time shift (hours)
72
0.4
0.2
0
-0.2
-0.4
-0.6
-0.8
-72
-48 -24 0
24 48
Time shift (hours)
72
Figure 6
Behavioral entrainment-correlation functions
Behavioral entrainment-correlation functions. Behavioral entrainment-correlation functions relating activity and light
exposures for two example nurses, one day-shift nurse (Figure 6a) and one rotating-shift nurse (6b) and two example rats, a
rat exposed to a regular 12L:12D pattern of light and dark (6c) and a "jet-lagged" rat exposed to a 12:12 light-dark cycle that
was phase-reversed every 48 hours (6d).
shift nurse in Figure 6b and for the "jet-lagged" rat in Figure 6d.
Phasor representations of circadian behavioral
entrainment
Plots of the behavioral entrainment-correlation functions
for the day-shift nurses generally exhibit smooth, oscillating curves whereas those of the rotating-shift nurses
exhibit much more irregular patterns. Estimates of the
relationship between activity-rest and light-dark in terms
of magnitude and phase can be determined for both
groups of nurses through Fourier decomposition and
spectral analysis of the behavioral entrainment-correlation functions. Phasors represent the magnitude and
phase relationship between the activity-rest data and the
light-dark data that underlie the entrainment-correlation
functions for a particular spectral component obtained
from the Fourier decomposition [26]. Since the 24-hour
Page 8 of 14
(page number not for citation purposes)
Journal of Circadian Rhythms 2008, 6:7
/>
spectral component is of special interest in studies of circadian entrainment, the activity and light data for every
nurse were first parsed into seven equal 24-hour periods.
The behavioral entrainment-correlation functions were
then calculated for each of these seven periods after which
the seven corresponding phasors representing the frequency component corresponding to a 24-hour periodicity, f(24) for every one of the 43 nurses were determined.
It should be noted that a systematic investigation of periods ranging from 22 to 26 hours in 10-minute increments
was conducted for the day-shift nurse data. While the
range of peak phasor amplitudes occurred for periods
ranging from 23.7 to 24.56 hours as determined from
quadratic curve-fits to the phasor magnitude versus period
data, the mean was 24.035 hours, supporting the significance of the 24-hour period for this analysis.
Complex arithmetic [27] was then used to determine the
average (n = 7) phasor for a given nurse and these average
phasors for all the nurses are plotted in Figure 7a in polar
coordinates. The length of each phasor is the magnitude
of the average f(24) and reveals how well light and activity
are correlated over the seven-day recording session. As a
group, the day-shift nurses have larger phasor lengths
than the rotating-shift nurses, implying that they have a
much higher degree of behavioral entrainment.
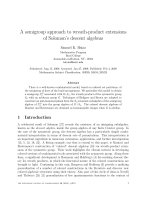
Consistent with a diurnal species, all the phasor directions
for the nurses are to the right, meaning that activity and
a.
day-shift nurses
rotating-shift nurses
6 hr.
8 hr.
0.6
light exposure occur at nearly the same time. The angular
direction of a phasor indicates the phase relationship
between light and activity for an individual. Greater
amounts of activity near the onset of circadian light exposure than near the offset of circadian light exposure produces a phasor extending below the zero-phase polar axis
line (labeled 0 hour). Conversely, greater amounts of
activity near the offset of circadian light exposure than
near the onset of circadian light exposure produces a
phasor extending above the zero-phase line. Researchers
[28] have used the terms "larks" and "owls" to refer to
people with diurnal activity patterns biased toward morning or evening hours, respectively. These times, however,
are not explicitly linked to actual light exposures. The
phasor analysis does reveal similar behavioral characteristics, but ones referenced to actual light-dark exposures
rather than to an arbitrary exogenous time reference
(watch or wall-clock time). Borrowing the lark and owl
terminology for describing the behavioral characteristics
revealed by the phasor analyses, it is interesting to note
that there are more owls than larks, particularly among
the rotating-shift nurses, indicating that these people tend
to be more active after the onset and subsidence of daily
light exposure than before. Although it was true that for
day-shift nurses the natural solar cycle was largely coincident with the measured light-dark pattern, the phasor
analyses are, again, performed without respect to any
exogenous time reference. Theoretically then, a person
exhibiting lark or owl behavior with respect to actual light
b.
12L:12D rats
“jet-lagged” rats
6 hr.
4 hr.
0.4
10 hr.
2 hr.
10 hr.
2 hr.
0.2
12 hr.
0 hr.
-10 hr.
-2 hr.
-4 hr.
-6 hr.
4 hr.
0.4
Nocturnal Diurnal
0.2
-8 hr.
0.6
8 hr.
Owls
Larks
12 hr.
0 hr.
-10 hr.
-2 hr.
-4 hr.
-8 hr.
-6 hr.
Phasor diagrams for day-shift and rotating-shift nurses and for 12L:12D and "jet-lagged" nocturnal rats
Figure 7
Phasor diagrams for day-shift and rotating-shift nurses and for 12L:12D and "jet-lagged" nocturnal rats.
Page 9 of 14
(page number not for citation purposes)
Journal of Circadian Rhythms 2008, 6:7
and dark pattern could, in fact, be completely out of phase
with the local solar day, as indeed would happen with a
"true" night-shift worker.
The rats exposed to the consistent 12L:12D light-dark
cycle produced average (n = 8) phasors with magnitudes
similar to the day-shift nurses, but with directions to the
left, clustered around a 12-hour phase shift between light
and activity, as would be expected for an entrained nocturnal animal (Figure 7b). The "jet-lagged" rats experiencing
the continually changing light-dark exposures have short,
low magnitude average (n = 8) phasors with no consistent
direction across individuals. (Two very different scenarios
can result in the same low magnitude average phasors.
One is that every phasor comprising the average is low in
magnitude, which indicates that there is no systematic
relationship between activity-rest and light-dark. The second, as exhibited by the "jet-lagged" rats, is that individual phasors representing 24-hour periods have significant
magnitudes, but their phase varies widely in many directions resulting in a small magnitude average phasor.
Either scenario, however, indicates low entrainment to
the light-dark pattern when measured across multiple
days.)
Figure 8 shows the average [27] phasor magnitudes and
phase angles for the two groups of nurses and the two
groups of rats. The common use of binary light-dark exposure levels and of wheel running as a measure of activity
in caged animals can potentially affect the comparison of
their phasor magnitudes to those obtained by humans
using the Daysimeter. In a natural environment human
activity varies continuously as does a person's light exposure. The phasor analysis based upon the Daysimeter data
captures the association between the natural and continuously varying stimuli and responses. Conversely, caged
animals have many fewer options with regard to self-regulated light exposures and with regard to running behavior. This situational difference between species may, in
fact, have contributed to the relatively shorter phasor
magnitudes in the 12L:12D group of rats than in the dayshift nurses. Clearly if cross-species comparisons are to be
made, additional investigations need to be undertaken of
actual light exposures and of alternative behavioral measures for both human and animal models.
Phasors compared to other measures of circadian
behavioral entrainment
Considering only the degree of behavioral entrainment,
Figure 9 shows the distribution of the f(24) phasor magnitudes for the two groups of nurses (Figure 9a) and for
the two groups of rats (Figure 9b). Figure 9a shows a clear
and statistically significant difference between the dayshift and rotating-shift nurse groups with widely separated
group means and medians. Nevertheless, there is some
/>
overlap of the distributions, perhaps reflecting a true continuum of the degree of circadian behavioral-entrainment
among individuals. The data from the rats in Figure 9b
also show a clear and statistically significant separation,
but undoubtedly because of the two radically different
light-dark patterns, there is no overlap in the phasor
amplitudes for these two groups of rats.
The interdaily stability (IS) and the intradaily variability
(IV) statistics [29] have been used in numerous studies as
measures of behavioral entrainment, or more precisely
the coupling between rest-activity rhythms and assumed
exogenous zeitgebers, or time givers [30-32]. Unlike the
phasor analysis, these two statistics are computed based
solely on activity and cannot be used to assess the phase
relationship between measured activity and the actual
light zeitgeber.
It is possible, however, to compare phasor magnitudes
(Figure 9) and IS values by using the same sets of activity
data as estimates of circadian entrainment. The distribution of the IS statistic was calculated from the activity data
from nurses (Figure 10a) and from rats (Figure 10b). The
two groups of nurses and the two groups of rats were significantly different in terms of their IS values. The ratio of
the mean IS values for the two groups of nurses (2.6) and
the ratio of the mean IS values for the two groups of rats
(2.0) are similar to, but smaller than the ratios of the
mean phasor magnitudes for the comparable groups
shown in Figure 9 (3.2 for nurses and 4.9 for rats). This
comparison between phasor magnitude ratios and IS
value ratios suggests that a better assessment of behavioral
entrainment can be made by relating measured activityrest to actual light-dark exposures than to an exogenous
time reference, such as local solar time, that may or may
not be correlated with the actual zeitgeber for entrainment,
that is, light.
The IV statistic was also calculated from the activity data
from nurses and rats, but the values showed no significant
difference between the two groups of nurses nor between
the two groups of rats; the mean IV values for day-shift
and rotating-shift nurses were 0.50 and 0.54 respectively
with standard deviations of 0.20 and 0.16 respectively,
and the mean values for the entrained and "jet-lagged"
rats were 1.10 and 1.21 with standard deviations of 0.28
and 0.27 respectively. This lack of separation in IV values
for the two groups of nurses and for the two groups of rats
suggests that consolidation of activity patterns is not systematically related to the degree of circadian behavioral
entrainment as measured either with IS values or with
phasor magnitudes.
Page 10 of 14
(page number not for citation purposes)
Journal of Circadian Rhythms 2008, 6:7
/>
6 hr.
0.6
8 hr.
day-shift nurse
rotating-shift nurse
12L:12D rat
“jet-lagged” rat
4 hr.
0.4
2 hr.
10 hr.
0.2
12 hr.
0 hr.
-10 hr.
-2 hr.
-8 hr.
-4 hr.
-6 hr.
Figure 8
Mean phasors for nurses and for rats
Mean phasors for nurses and for rats.
Discussion
This paper provides a new framework for the study of the
effects of circadian entrainment/disruption on human
health, emphasizing three important links in the logical
chain relating circadian disruption to maladies such as
breast cancer, obesity, and sleep disorders [18].
First, circadian light (and dark) for humans and for animal models can now be quantitatively defined to such a
degree that meaningful studies of light as a stimulus for
circadian disruption can be undertaken, not only in
humans but in nocturnal rodents as well. Without quantitative definitions of the light stimuli, it would simply be
impossible to understand the results of any ecological
study of circadian disruption on human health or how
laboratory studies using animal models relate to the
human condition. Second, with an understanding of circadian light, it is now possible to measure the synchrony
between light-dark and activity-rest patterns in actual
human living environments using tools like the Daysimeter [20]. These ecological light and activity data are necessary to develop the essential insights into circadian
disruption actually experienced by modern people. Third,
it is now possible to simply and quantitatively characterize degrees of circadian entrainment/disruption; that is,
the levels of synchrony between light-dark exposures and
activity-rest, in both humans and animal models. A focus
on entrainment, rather than light per se or activity alone,
makes it possible to relate ecological studies of diurnal
humans to parametric studies of diseases using nocturnal
animal models. In other words, parametric studies of circadian disruption employing animal models for human
diseases can now be designed and conducted so as to
more accurately reflect their relevance to the actual living
conditions in humans.
Page 11 of 14
(page number not for citation purposes)
Journal of Circadian Rhythms 2008, 6:7
/>
a.
rotating-shift nurses
day-shift nurses
rotating-shifts
Median = 0.103 Mean = 0.131
0
b.
0.1
day-shifts
Mean = 0.424 Median = 0.441
0.2
0.3
0.4
24-hour Phasor Magnitudes for Nurses
“jet-lagged” rats
0.1
0.6
0.5
0.6
12L:12D rats
“jet-lagged”
Median = 0.065 Mean = 0.073
0
0.5
12L:12D
Median = 0.353 Mean = 0.356
0.2
0.3
0.4
24-hour Phasor Magnitudes for Rats
Figure 9
Phasor magnitudes for the day-shift, and rotating-shift nurses (a) and for the two groups of rats (b)
Phasor magnitudes for the day-shift, and rotating-shift nurses (a) and for the two groups of rats (b).
a.
rotating-shift nurses
day-shift nurses
rotating-shift
Mean = 0.25 Median = 0.26
0
0.2
day-shift
Mean = 0.66 Median = 0.69
0.4
0.6
0.8
1.0
0.8
1.0
Interdaily Stability (IS) for Nurses
b.
“jet-lagged” rats
12L:12D rats
12L:12D
“jet-lagged” Median = 0.44 Mean = 0.45
Median = 0.21 Mean = 0.22
0
0.2
0.4
0.6
Interdaily Stability (IS) for Rats
Figure 10
Interdaily stability (IS) statistics for the day-shift and rotating-shift nurses (a) and for the two groups of rats (b)
Interdaily stability (IS) statistics for the day-shift and rotating-shift nurses (a) and for the two groups of rats (b).
Page 12 of 14
(page number not for citation purposes)
Journal of Circadian Rhythms 2008, 6:7
It should be emphasized, too, that the methods presented
here are not limited to the study of behavioral entrainment. Rather, this analysis provides the basis for assessing
entrainment of other outcome measures from the circadian system, such as core body temperature or melatonin
synthesis, to light-dark patterns. From these envisioned
studies, modern maladies like diabetes, obesity, and poor
sleep, as well as breast cancer and cardiovascular disease,
can be meaningfully and systematically investigated.
More important perhaps, forging the links identified in
this paper will significantly accelerate a deeper understanding of the role of circadian disruption on human
health [17] and thereby may accelerate medical treatment
of these maladies with light and with drugs [33]. The techniques identified here also imply that, in the future, it will
be possible to examine circadian entrainment/disruption
on an individual basis so that each person can be treated
with the appropriate light-dark exposure and/or with the
appropriate pharmaceutical interventions.
Competing interests
/>
5.
6.
7.
8.
9.
10.
11.
12.
13.
14.
The authors declare that they have no competing interests.
Authors' contributions
MSR conceived the study, lead the team in its execution
and drafted major sections of the paper, AB formulated
the analyses and drafted portions of the Results and Discussion sections, MGF was instrumental in acquiring the
nurse data, drafted sections of the paper and provided
expertise while preparing the manuscript, JDB was instrumental in acquiring the rat data and provided expertise
while preparing the manuscript. All authors participated
equally in discussions and the exchange of ideas during
the study, and all reviewed and approved the final manuscript.
15.
16.
17.
18.
19.
20.
Acknowledgements
The authors would like to thank Dr. Bernard Possidente at Skidmore College and Drs. Irma and Jose Russo at Fox Chase Cancer Research Institute
for collaboration with the animal experiments. Thanks also to Mr. Terry
Klein who helped develop and calibrate the Daysimeter, to Mr. Yutao Zhou
for performing several analyses, Mr. Dennis Guyon for graphical support, as
well as to Ms. Jennifer Taylor who provided editorial support, all of whom
are at the Lighting Research Center at Rensselaer Polytechnic Institute.
This work was supported in part by CDC Grant 1R01 OH008171 to Dr.
Eva Schernhammer at Harvard Public Health and by the Trans-NIH Genes,
Environment and Health Initiative Grant 1U01 DA023822-01 to the first
author.
21.
22.
23.
24.
25.
References
1.
2.
3.
4.
Moore-Ede MC Sulzman, F. M., Fuller, C. A.: The Clocks That
Time Us. Cambridge , Harvard University Press; 1982.
Refinetti R: Circadian Physiology. 2nd edition. Boca Raton, London, New York , CRC Taylor & Francis; 2006.
Wever R: The Circadian System of Man: Results of Experiments Under Temporal Isolation. New York, Springer-Verlag;
1979.
Aschoff J: Endocrine Rhythms. Edited by: Krieger DTE. New York
, Raven; 1979.
26.
27.
28.
Czeisler CA, Weitzman E, Moore-Ede MC, Zimmerman JC, Knauer
RS: Human sleep: its duration and organization depend on its
circadian phase. Science 1980, 210(4475):1264-1267.
Conroy RTWL Mills, J. N.: Human Circadian Rhythms. London ,
Churchill; 1970.
Collis SJ, Boulton SJ: Emerging links between the biological
clock and the DNA damage response. Chromosoma 2007,
116(4):331-339.
Zamborszky J, Hong CI, Csikasz Nagy A: Computational analysis
of mammalian cell division gated by a circadian clock: quantized cell cycles and cell size control. J Biol Rhythms 2007,
22(6):542-553.
Kalsbeek A, Palm IF, La Fleur SE, Scheer FA, Perreau-Lenz S, Ruiter
M, Kreier F, Cailotto C, Buijs RM: SCN outputs and the hypothalamic balance of life. J Biol Rhythms 2006, 21(6):458-469.
Klein DC, Moore RY, Reppert SM: Suprachiasmatic nucleus: The
mind's clock. New York, NY , Oxford University Press; 1991.
Sack RL, Auckley D, Auger RR, Carskadon MA, Wright KP Jr., Vitiello
MV, Zhdanova IV: Circadian rhythm sleep disorders: part II,
advanced sleep phase disorder, delayed sleep phase disorder, free-running disorder, and irregular sleep-wake rhythm.
An American Academy of Sleep Medicine review. Sleep 2007,
30(11):1484-1501.
Kohsaka A, Bass J: A sense of time: how molecular clocks
organize metabolism. Trends Endocrinol Metab 2007, 18(1):4-11.
Mallis MM, DeRoshia CW: Circadian rhythms, sleep, and performance in space.
Aviat Space Environ Med 2005, 76(6
Suppl):B94-107.
Lemmer B: Importance of circadian rhythms for regulation of
the cardiovascular system--studies in animal and man. Conf
Proc IEEE Eng Med Biol Soc 2006, 1:168-170.
Filipski E, Li XM, Levi F: Disruption of circadian coordination
and malignant growth.
Cancer Causes Control 2006,
17(4):509-514.
Schernhammer ES, Laden F, Speizer FE, Willett WC, Hunter DJ,
Kawachi I: Rotating night shifts and risk of breast cancer in
women participating in the Nurses' Health Study. J Natl Cancer Inst 2001, 93:1563-1568.
Straif K, Baan R, Grosse Y, Secretan B, Ghissassi FE, Bouvard V, Altieri
A, Benbrahim-Tallaa L, Cogliano V: Carcinogenicity of shift-work,
painting, and fire-fighting. The Lancet Oncology 2007, 8(12):1065.
Stevens RG, Blask DE, Brainard GC, Hansen J, Lockley SW, Provencio
I, Rea MS, Reinlib L: Meeting report: the role of environmental
lighting and circadian disruption in cancer and other diseases. Environ Health Perspect 2007, 115(9):1357-1362.
Stevens RG, Rea MS: Light in the built environment: potential
role of circadian disruption in endocrine disruption and
breast cancer. Cancer Causes Control 2001, 12(3):279-287.
Bierman A, Klein TR, Rea MS: The Daysimeter: A device for
measuring optical radiation as a stimulus for the human circadian system.
Measurement Science and Technology 2005,
16:2292-2299.
Bullough JD, Rea MS, Figueiro MG: Of mice and women: light as
a circadian stimulus in breast cancer research. Cancer Causes
Control 2006, 17(4):375-383.
Rea MS, Figueiro MG, Bullough JD, Bierman A: A model of phototransduction by the human circadian system. Brain Res Rev
2005, 50(2):213-228.
Zeitzer JM, Dijk DJ, Kronauer R, Brown E, Czeisler C: Sensitivity of
the human circadian pacemaker to nocturnal light: melatonin phase resetting and suppression. J Physiol 2000, 526(Pt.
3):695-702.
Bullough JD, Figueiro MG, Possidente BP, Parsons RH, Rea MS: Additivity in murine circadian phototransduction. Zoolog Sci 2005,
22(2):223-227.
Oppenheim AV Schafer, R. W.: Discrete-Time Signal Processing.
Englewood Cliffs, NJ , Prentice-Hall; 1989.
Wikipedia contributors: Phasor (sine waves) . [ipe
dia.org/w/
index.php?title=Phasor_%28sine_waves%29&oldid=197396343].
Weisstein EW: Complex Number. From MathWorld-A Wolfram Web Resource. [ />Number.html].
Roenneberg T, Wirz-Justice A, Merrow M: Life between clocks:
daily temporal patterns of human chronotypes. J Biol Rhythms
2003, 18(1):80-90.
Page 13 of 14
(page number not for citation purposes)
Journal of Circadian Rhythms 2008, 6:7
29.
30.
31.
32.
33.
34.
35.
36.
37.
38.
/>
Witting W, Kwa IH, Eikelenboom P, Mirmiran M, Swaab DF: Alterations in the circadian rest-activity rhythm in aging and
Alzheimer's disease. Biol Psychiatry 1990, 27(6):563-572.
Hatfield CF, Herbert J, van Someren EJ, Hodges JR, Hastings MH: Disrupted daily activity/rest cycles in relation to daily cortisol
rhythms of home-dwelling patients with early Alzheimer's
dementia. Brain 2004, 127(Pt 5):1061-1074.
Scherder EJ, Van Someren EJ, Swaab DF: Transcutaneous electrical nerve stimulation (TENS) improves the rest-activity
rhythm in midstage Alzheimer's disease. Behav Brain Res 1999,
101(1):105-107.
Van Someren EJW, Hagebeuk EE, Lijzenga C, Scheltens P, de Rooij SE,
Jonker C, Pot AM, Mirmiran M, Swaab DF: Circadian rest-activity
rhythm disturbances in Alzheimer's disease. Biol Psychiatry
1996, 40:259-270.
Hrushesky WJ: Circadian timing of cancer chemotherapy. Science 1985, 228(4695):73-75.
Brainard GC, Hanifin JP, Greeson JM, Byrne B, Glickman G, Gerner
E, Rollag MD: Action spectrum for melatonin regulation in
humans: evidence for a novel circadian photoreceptor. J Neurosci 2001, 21(16):6405-6412.
Thapan K, Arendt J, Skene DJ: An action spectrum for melatonin
suppression: evidence for a novel non-rod, non-cone photoreceptor system in humans. J Physiol 2001, 535(Pt 1):261-267.
Figueiro MG, Bullough JD, Parsons RH, Rea MS: Preliminary evidence for spectral opponency in the suppression of melatonin by light in humans. NeuroReport 2004, 15(2):313-316.
McIntyre IM, Norman TR, Burrows GD, Armstrong SM: Human
melatonin suppression by light is intensity dependent. J Pineal
Res 1989, 6(2):149-156.
Rea MS, Bullough JD, Figueiro MG: Phototransduction for human
melatonin suppression. J Pineal Res 2002, 32(4):209-213.
Publish with Bio Med Central and every
scientist can read your work free of charge
"BioMed Central will be the most significant development for
disseminating the results of biomedical researc h in our lifetime."
Sir Paul Nurse, Cancer Research UK
Your research papers will be:
available free of charge to the entire biomedical community
peer reviewed and published immediately upon acceptance
cited in PubMed and archived on PubMed Central
yours — you keep the copyright
BioMedcentral
Submit your manuscript here:
/>
Page 14 of 14
(page number not for citation purposes)