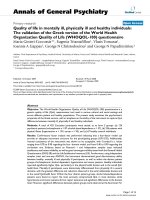
Báo cáo y học: "Standards of evidence in chronobiology: A response" docx
Bạn đang xem bản rút gọn của tài liệu. Xem và tải ngay bản đầy đủ của tài liệu tại đây (4.81 MB, 16 trang )
BioMed Central
Page 1 of 16
(page number not for citation purposes)
Journal of Circadian Rhythms
Open Access
Review
Standards of evidence in chronobiology: A response
Patrick M Fuller, Jun Lu and Clifford B Saper*
Address: Department of Neurology, Program in Neuroscience, and Division of Sleep Medicine, Beth Israel Deaconess Medical Center and Harvard
Medical School, Boston, USA
Email: Patrick M Fuller - ; Jun Lu - ; Clifford B Saper* -
* Corresponding author
Abstract
A number of recent studies have debated the existence and nature of clocks outside the
suprachiasmatic nucleus that may underlie circadian rhythms in conditions of food entrainment or
methamphetamine administration. These papers claim that either the canonical clock genes, or the
circuitry in the dorsomedial nucleus of the hypothalamus, may not be necessary for these forms of
entrainment. In this paper, we review the evidence necessary to make these claims. In particular,
we point out that it is necessary to remove classical conditioning stimuli and interval timer
(homeostatic) effects to insure that the remaining entrainment is due to a circadian oscillator. None
of these studies appears to meet these criteria for demonstrating circadian entrainment under
these conditions. Our own studies, which were discussed in detail by a recent Review in these
pages by Mistlberger and colleagues, came to an opposite conclusion. However, our studies were
designed to meet these criteria, and we believe that these methodological differences explain why
we find that canonical clock gene Bmal1 and the integrity of the dorsomedial nucleus are both
required to produce true circadian entrainment under conditions of restricted feeding.
Review
The recent review by Mistlberger and colleagues [1] pur-
ports to raise a number of important questions concern-
ing how studies in circadian biology should be
performed, and what types of standards should be met.
Unfortunately, rather than engaging in a debate that
broadly considers issues across the field, Mistlberger and
colleagues chose to focus almost entirely on criticizing our
recent paper [2].
We welcome the opportunity to engage in a discussion
about the methods used in circadian biology, which we
believe frequently are applied in ways that confuse circa-
dian, homeostatic, and cognitive influences. We would
like to begin at that level, first by addressing a few ground
rules for such debate, such as the ways in which scientists
should interact, and then turn our attention to critical
standards for experiments in circadian biology. Finally,
we will then address the issues raised by Mistlberger et al.
about our own paper, point by point, and discuss each
one specifically. Our conclusion is that not only are each
of these points incorrect, but that this could have been
established by Mistlberger and colleagues if they had dis-
cussed these issues with us in advance.
Part I: Overall Issues
1. Scientific discourse should be collegial, open, and transparent
We believe that maintaining an open laboratory, in which
colleagues are welcome to ask questions and to come visit,
and to review methods and data, is critical to maintaining
a scientific environment. Our laboratory, since its incep-
tion in 1981, has operated in this way. Although Dr. Fuller
Published: 22 July 2009
Journal of Circadian Rhythms 2009, 7:9 doi:10.1186/1740-3391-7-9
Received: 23 May 2009
Accepted: 22 July 2009
This article is available from: />© 2009 Fuller et al; licensee BioMed Central Ltd.
This is an Open Access article distributed under the terms of the Creative Commons Attribution License ( />),
which permits unrestricted use, distribution, and reproduction in any medium, provided the original work is properly cited.
Journal of Circadian Rhythms 2009, 7:9 />Page 2 of 16
(page number not for citation purposes)
had some preliminary email exchanges with Dr. Mistl-
berger to discuss the data, not one of the eight authors of
the Mistlberger review ever contacted the corresponding
author on the paper (CBS) to discuss the questions that
their review raises about our data or methods. We take it
as axiomatic that this is necessary before making allega-
tions about errors in data collection or presentation. As we
indicate in the rest of our detailed response, we remain
available to discuss these issues and demonstrate our data
and methods to any scientific colleague who is interested.
Scientific discourse should start there.
2. No publication ever contains all of the data
This is particularly true for publications in high visibility
journals, which generally require severe compression of
the manuscript. If other investigators in the field would
like to see additional data, these requests should go to the
corresponding author. Only if the data are not forthcom-
ing is it appropriate to cast allegations about the data col-
lection. We will present below the information that was
requested in the review by Mistlberger and colleagues. In
no case does it change our results or their import.
3. Critical standards for demonstration of entrainment of circadian
oscillators
In our view, this is really the heart of the matter, and the
reason for us to join debate in this Response.
The demonstration of entrainment of a circadian oscilla-
tor requires that a circadian pattern should persist in the
absence of an external forcing stimulus. In particular,
studies should be designed to avoid providing either cog-
nitive or homeostatic forcing stimuli to animals, which
could potentially produce results that appear to be circa-
dian. These requirements have several correlates, which
we describe below. We will discuss in this review nine
recent papers on the role of clock genes and the dorsome-
dial nucleus of the hypothalamus (DMH) in entrainment
to restricted feeding or methamphetamine, and the degree
to which they adhere to these principles. This information
is summarized in Table 1.
A. External cues (other than the entraining stimulus) that
might provide timing stimuli to the animal should be avoided.
This might seem axiomatic. For example, the most impor-
tant entraining stimulus for mammals is light. As a result,
most circadian biologists would not accept any phenom-
enon as circadian in nature unless it was demonstrated in
continuous darkness (DD).
Nevertheless, this standard is often not observed. For
example in the original studies demonstrating food
entrainment (see review by Stephan [3]), animals were
permitted to remain on a light-dark (LD) cycle. While the
use of LD insured that the light entrained rhythm and the
food entrained rhythm would remain temporally sepa-
Table 1: Methods used in recent papers examining non-traditional circadian oscillators.
Study Lesion type Done in DD? Measure of
Entrainment
Deprivation period Homeostatic
increase in measure?
Clock gene deletion studies in RF
Fuller et al., 2008 (2) Bmal1 ko DD Tb and LMA Yes, 24 hrs, no
anticipation in RF
No, reduced Tb and
LMA
Mistlberger al., 2008
(9)
Bmal1 ko Mainly DD Motion sensor Ad lib after RF shows
no entrainment
Yes, increased activity in
RF
Pendergast et al., 2009
(11)
Bmal1 ko LD and DD Wheel running Yes, 48 hrs, no clear
entrainment
Yes, increased running
in RF and food
deprivation
Storch and Weitz,
2009 (10)
multiple clock genes LD and DD Wheel running Not done Yes, increased running
in RF
Clock gene deletion study in MASCO
Mohawk et al., 2009
(15)
Multiple clock genes Mainly DD Motion sensor for
Bmal1; wheel running
for rest
Not done Yes, increased running
after MA ingestion
DMH lesion studies in RF
Gooley et al., 2006 (8) excitotoxic LD only Tb and LMA Yes, 44 hrs, after RF No, reduced Tb and
LMA in RF
Landry et al., 2006 (5) electrolytic LD only Motion sensor Yes, 51 hrs after RF Yes, increased activity in
RF
Landry et al., 2007 (4) electrolytic LD only Motion sensor Yes, 72 hrs after RF Yes, increased activity in
RF
Moriya et al., 2009 (6) electrolytic LD, + DD test days Motion sensor Tb, LMA Yes, 46 or 58 hrs, but
only first day shown
Does not say
(activity normalized)
Journal of Circadian Rhythms 2009, 7:9 />Page 3 of 16
(page number not for citation purposes)
rated, the light also provides a temporal cue for food pres-
entation. A number of recent food entrainment studies
including those by Mistlberger in which he has done dor-
somedial hypothalamic (DMH) lesions [4,5], have con-
tinued to be performed only under LD. However, if
animals are entrained under LD, and food is provided
only during the light cycle (to nocturnal animals), then
the animals have the opportunity to learn cognitively that
food will appear during the light cycle. Hence, animals
may show classical conditioning by increasing activities
during the light cycle that are associated with feeding (see
next section). This effect is clearly demonstrated in the
recent paper on DMH lesions and food entrainment in
mice by Moriya and colleagues [6], in which food antici-
patory activity of two animals when tested in DD (their
figure Eight C, activity level prior to food omission on
days 7 and 14) was reduced by about 25% compared to
the activity prior to feeding on the preceding days (6 and
13) when the animal was in LD (whereas the masking
effects of light on activity should have caused the opposite
response). In our own studies of the effects of DMH
lesions on circadian rhythms, we tested rhythms of body
temperature (Tb) and locomotor activity (LMA) as meas-
ured by telemetry both in ad lib conditions and under
restricted feeding, in both LD and DD [7,8]. Similarly, the
recent experiments discussed below on the effects of clock
gene deletions on food entrainment [2,9-11] all include
critical experiments under DD.
B. The circadian measures that are used to demonstrate
entrainment should not be ones that are directly altered by the
entraining stimulus in the same way as the "entrained"
responses. For example, most circadian researchers would
agree that light has masking effects on locomotor activity.
Hence, no one in the field would design an experiment
where the animals were exposed to a daily light cycle (e.g.,
in the absence of the SCN), showed masking (i.e.,
decreased activity during the light cycle), and claim that
the SCN was not necessary for circadian rhythms of loco-
motor activity.
Yet this is precisely what is being done in experiments
where the entraining stimulus is a restricted period of
feeding opportunity (i.e., about 20 hours of starvation
each day), and the output that is measured is an increase
in a response that is also increased by food deprivation.
This response will of course be increased toward the end
of the period of starvation, regardless of any circadian
entrainment. For example, the papers cited by Mistlberger
et al. [1] clearly demonstrate that wheel-running and
activity measured by placing an infrared motion sensor
over the food bin are behaviors whose frequency is
increased by food deprivation [4,5,9-11]. Thus, they tend
to produce an "interval timer" effect, i.e., toward the end
of a 20 hour period of food deprivation between feeding
periods, when the animal is very hungry, there will be
more of these behaviors, and this increase can contribute
to apparent anticipatory behavior. In studies where one
wants to measure the circadian component of food antici-
pation, such measures that are increased by food depriva-
tion should be avoided.
This may seem to be a heretical position to take, given that
the phenomenon of food entrainment of circadian
rhythms was first described by using running-wheel activ-
ity [3,12], and that wheel-running has been widely used in
studying this behavior. However, the traditional method
of examining food entrainment, using a running wheel in
an LD environment, includes at least three separate cues
for the intact animal: (i.) a cognitive (conditioned behav-
ior) cue to light; (ii.) a homeostatic or "interval timer"
cue, which increases wheelrunning as animals become
hungrier; and (iii.) a circadian cue. A great deal of effort
went into establishing that food anticipatory activity as
traditionally measured indeed contains a circadian com-
ponent [3]. However, when one wants to eliminate food
anticipatory responses, it is important to remove all three
types of cues.
A number of recent studies of food entrainment have not
followed this principle. Thus in the studies by Mistlberger
and colleagues [4,5,9], where the measure of output was
an infrared detector suspended over the food bin, or Pen-
dergast and coworkers[11] or Storch and Weitz [10],
where wheel-running activity was measured, the overall
activity was increased in animals on restricted feeding and/
or food deprivation. As a result, Pendergast et al. [11]
finally concluded: "In the absence of food, heightened
activity occurs regardless of the previous feeding protocol.
If this is the case, we cannot rule out that Bmal1 is an
important molecular component of the wildtype FEO,
and that in the absence of Bmal1, the mechanism that con-
trols the expression of FAA becomes an interval timer."
Our data support this position. We used circadian meas-
ures that are decreased by food deprivation (such as body
temperature or general cage locomotion as measured by a
telemetry transmitter [2,8]), but which under food restric-
tion continued to find a sharp anticipatory increase in
those measures in the hours just prior to food availability.
This approach avoids the confound of an "interval timer"
or homeostatic effect, and when key experiments are done
in DD, isolates the circadian component of the response.
Under these conditions, when the interval timer effect is
removed, Bmal1 -/- mice have no evidence of a food antic-
ipatory increase in Tb or general locomotor activity.
A related problem arises in a recent study on the role of
clock genes in the methamphetamine-sensitive circadian
oscillator (MASCO). Honma and colleagues [13] origi-
Journal of Circadian Rhythms 2009, 7:9 />Page 4 of 16
(page number not for citation purposes)
nally described the MASCO based upon putting metham-
phetamine (MA) into the drinking water of rats, and
inducing a second free-running rhythm measured with
running wheels whose period was proportional to the
dose of methamphetamine, in addition to the usual 24
hour light-entrained rhythm in activity. Similar to the
food entrainable oscillator, the output that was measured
(running wheel activity) is increased by MA. When rats
drink MA, they remain awake and active, engaging in
wheel-running and increased drinking of further MA, and
further wheelrunning, until the animals are exhausted and
sleep (at which point they stop drinking MA for a while).
This "hourglass" or interval timer effect was raised as a
criticism of the MASCO phenomenon, and Honma and
colleagues [14] then did the control experiment of dem-
onstrating the MASCO after administering MA by a con-
tinuous infusion, rather than in the drinking water. This
method still showed a free-running oscillator even after
SCN ablation, demonstrating that MASCO entrainment
indeed represents an extra-SCN clock whose function is
initiated by MA. More recently, Tataroglu and colleagues
[15] showed that the MASCO also shows temporal char-
acteristics of a circadian timer. However, as with food
entrainment, the presence of a circadian component to
the behavior does not rule out the participation of an
interval timer as well.
A recent study by Mohawk and colleagues [16] used the
original method of drinking water administration of MA,
and found periodic cycling of wheel-running activity,
even in animals with genetic deletions of clock genes
(such as Bmal1). Unfortunately, this study is heir to the
same "hourglass" confound as the original Honma stud-
ies, and hence a critical control would be to use a contin-
uous infusion of MA to avoid the forcing stimulus.
We have recently taken a different approach to study the
MASCO. Using wildtype mice, we provide the MA daily by
injection at the same time each day. This provides a pre-
cise timing stimulus for the MASCO, and permits meas-
urement of anticipatory physiology and behavior (as with
the food entrainable oscillator). Again, we use body tem-
perature and general cage activity, as these are both at rel-
atively low levels in the daytime, and hence a rise in
anticipation of the MA injection represents a real circadian
response, not an hourglass response.
C. The entrained response must persist in the absence of the
entraining stimulus. The most important criterion for judg-
ing whether a response represents circadian entrainment
is to eliminate the entraining stimulus for several periods
at the end of the experiment and see if the response con-
tinues at the same time or phase (i.e., phase control, a pre-
requisite for demonstrating entrainment of an oscillator
system) or, in the case of the MASCO experiment with MA
in the drinking water, a persisting free-running rhythm.
For the MASCO experiments above, for example, we
examine the body temperature and locomotor activity for
three days after the last injection of MA, and find increases
that anticipate the former injection time clearly persist for
at least three days. The Mohawk et al. [16] study, which
claimed that MA induced circadian locomotor rhythms in
mice with clock gene mutations, indicates that animals
were observed after MA was stopped, but does not indi-
cate whether the rhythms were sustained without the
drug. This would have been a critical control for the claim
that the MASCO is independent of known clock genes. (A
"rhythm" that stopped as soon as the drug was withdrawn
would not be a rhythm at all, but rather a demonstration
of the "hourglass effect.")
For experiments involving food entrainment, long term
deprivation at the end of the study is more difficult, as
food deprivation itself can alter physiology in small
rodents. At our institution, the limit permitted by the
Institutional Animal Care and Use Committee for food
deprivation in most rat studies is two days (e.g., Gooley et
al. [8]), but for mice the limit is one day. Interestingly,
none of the studies of the effects of clock gene deletions
on feeding cited by Mistlberger et al[1] included a period
of food deprivation immediately after restricted feeding
(Table 1). Storch and Weitz [10] did not report any data
beyond the period of food restriction. Mistlberger and col-
leagues [9] and Pendergast et al. [11] both released their
animals into ad lib feeding for several days before a period
of food deprivation. In both studies, under DD condi-
tions, the Bmal1 -/- mice had no rhythm at all under either
the ad lib or the food deprivation conditions. These exper-
iments provide prima facie evidence that Bmal1 -/- mice do
not show circadian entrainment at all, but rather show an
increase in activity as they become progressively hungrier
during the restricted feeding procedure (the interval timer
effect).
Among studies of the effects of DMH lesions in rats on
entrainment to food, all of the studies done in by Landry
and colleagues [4,5], and in our own lab [8], used at least
two cycles of food deprivation (Table 1). The only study
done in mice, by Moriya et al. [6], indicates that a 46 or 58
hr period of food deprivation was done at the end of the
study. The authors do not comment on the health of the
animals, but show data only up to hour 39 in their figure,
and hence do not show a second cycle of food depriva-
tion. Interestingly, in the only DMH-lesioned mouse for
which a single cycle of food deprivation was shown dur-
ing DD, there apparently was no entrainment to the food
(no rhythmic behavior during food omission, their figure
Eight A, animal DMHX#34).
Journal of Circadian Rhythms 2009, 7:9 />Page 5 of 16
(page number not for citation purposes)
In summary, while at least 48 hours (two cycles) of food
deprivation is optimal after restricted feeding to demon-
strate entrainment, 24 hours of food deprivation is prob-
ably all that can be reasonably done in mice, due to their
low body mass. As an alternative, Mistlberger et al. [9] and
Pendergast [11] followed restricted feeding with a period
of ad lib feeding under DD followed by a period of food
deprivation. In these studies, Bmal1 -/- mice failed to
show anticipatory behavior. We agree with Pendergast
and colleagues that an "interval timer" effect could
account for the rhythmic behavior during restricted feed-
ing in these animals. We conclude that this approach may
therefore provide a valid substitute for immediate food
deprivation after restricted feeding.
4. Proper techniques for making brain lesions and for analysis of their
extent
One of the issues raised by Mistlberger and colleagues [1]
is the use of lesions of the DMH in assessing its role in cir-
cadian rhythms. To understand the differences in the
results of these experiments, it is necessary to consider
briefly the methodology used for making and assessing
the completeness of these lesions.
The use of large electrolytic lesions, which date back to the
1930's [17], disrupts fibers of passage as well as cell bod-
ies. Because it is not possible to know where all of the
axons passing through any point in the brain originate or
terminate, this method by its nature induces lesions
whose exact extent cannot be assessed. In addition,
because the lesions destroy the brain tissue, there is always
severe distortion of the remaining brain, which makes it
difficult to determine what remains intact, especially
around the borders of the lesion. There is a tendency to
believe that "large lesions" must be effective; but such
lesions may miss their intended target, and the distortion
of the remaining tissue may make it impossible to deter-
mine whether the target was included in the lesion.
Cell-specific lesions were introduced in the 1970's to
avoid these problems [18]. First, the lesion kills cell bod-
ies, but not fibers of passage. Second, because the lesions
cause less injury to the surrounding tissue, there is less tis-
sue loss, and the exact borders of the lesion and the sur-
viving cell groups within the context of the intact brain
can be more clearly defined. This allows accurate quanti-
tative assessment of which areas were damaged by the
lesion, and which were not. We have used counting boxes
and multivariate statistics to compare rigorously the
effects of lesions with the loss of neurons in specific pop-
ulations of neurons that were damaged [8,19,20]. This
procedure requires large numbers of lesions, and careful
analysis of each one (e.g., in the Gooley et al. study, 55
animals were used to assess the effects of lesions of the
DMH vs. surrounding areas). Hence, these methods are
tedious and exacting, but they also provide rigorous and
unbiased procedures for assessing lesions.
In the lesion studies of the DMH cited by Mistlberger and
colleagues [4-6], the lesions were done electrolytically. All
three studies involved smaller numbers of animals (7 ani-
mals in [5], 6 in [4]; the actual numbers used in [6] are not
clear because the numbers given in the Methods, Results,
and figure legends disagree with each other, but it appears
that about 15–16 animals were analyzed). The DMH
lesions were judged as "complete" in the Landry studies
[4] or "more than 80%" in the Moriya study [6] by
attempting to determine by eye whether tissue bordering
the lesions contained viable DMH neurons. More impor-
tantly, there is internal physiological evidence in all three
studies that the DMH lesions were not "complete" at all.
Animals with extensive DMH cell-specific lesions [7] have
a characteristic physiological signature, consisting of (i.)
low levels of total daily activity (ii.) a body temperature
about 0.3°C below that of normal rats; and (iii.) almost
no circadian rhythm remaining in locomotor activity,
wake-sleep, or feeding in a free-run in DD conditions, but
(iv.) clear preservation of the circadian rhythm of Tb. The
animals identified histologically as having DMH lesions
in the Gooley study had these same responses [8]. In the
Landry 2007 study, the animal shown in figure One E
with a partial DMH ablation had levels of daily locomotor
counts similar to the unlesioned animal (in their figure
One A; the complete lesion animal had low activity
counts, as in our studies) [4]. Review of the activity counts
in their figure Two indicates that only animals DMHx1
and DMHx3 had an overall reduction in activity. Thus
only two of the six animals with "complete" DMH lesions
would have been considered on physiological criteria to
have had a potentially complete DMH lesion. The Moriya
paper found that "DMH lesioned" animals examined with
motion sensors had lower daily activity counts, but only
examined the circadian pattern of activity on ad lib feeding
under LD conditions, so it is not possible to tell whether
they would have met physiological criteria for a complete
DMH lesion [4,6]. In the five animals examined by telem-
etry sensors, the animals with "DMH lesions" had a
slightly higher mean Tb at all times of day (figure Nine A),
which strongly suggests that the lesions by Moriya and
colleagues systematically did not include the caudal dor-
sal part of the DMH (which contains a small cell group
that is necessary to maintain normal Tb [21], and when
damaged, results in a fall of baseline Tb [7,8]).
In summary, while we appreciate how difficult it is to do
a lesion study of this type properly, none of the three stud-
ies by Mistlberger and colleagues [4-6] analyzed the lesion
extent rigorously, either anatomically or physiologically,
and there is internal evidence that many of the animals
Journal of Circadian Rhythms 2009, 7:9 />Page 6 of 16
(page number not for citation purposes)
did not have adequate DMH lesions. Hence, it is not sur-
prising that these lesions failed to eliminate food entrain-
ment. Given the difficulty (perhaps impossibility) of
doing careful histological assessment after electrolytic
lesions, such animals should at least be assessed physio-
logically for completeness of DMH lesions before being
used in studies to assess the role of the DMH in circadian
rhythms.
Part II: Specific Issues Related to the Fuller et al. Paper
The review by Mistlberger and colleagues [1] also raised a
number of very specific points about the Fuller 2008
paper [2]. These require detailed responses. Our position
is that none of the allegations about improper labeling or
display of data are correct, and none of the issues raised
would make any difference in the interpretation of our
paper. In the sections below we have numbered our
responses in the same order as the Mistlberger review, so
that the reader can follow along and see our responses to
individual points.
1a. Errors in figure S3
Figure S3 was added relatively late in the review process at
the request of a reviewer, and the errors in the original ver-
sion escaped the notice of the authors, reviewers, and edi-
tors. They were brought to our attention by Dr. Rae Silver,
who contacted the corresponding author (CBS) on July
24, 2008 to point out that the data in figure Three B were
duplicated in figure S3B, but that the onset of the daily
meal had been displaced. We immediately contacted Sci-
ence magazine to tell them about this error, asked to with-
draw this figure which used an incorrect dataset, and
made a replacement figure using the correct dataset
(which has been on-line since October, 2008). This also
required replacing figure S3D, which was derived from the
same dataset as S3B. The editors at Science subsequently
pointed out that in addition a segment of data were miss-
ing from the original figure S3B. The editors of Science
also contacted the Office of Scientific Integrity at Harvard
Medical School, which appointed a committee, hired a
consultant, and reviewed the figures and the data
involved. The reason for the errors in figure S3 was that we
had inadvertently used the wrong data file to make the fig-
ure. As we demonstrated to the committee, we use soft-
ware that starts the recording based on computer clock
time, which may not be the same as real world time
(because the computers are in constant use in animal
facility rooms, they are not synchronized with real world
time; as a result the computer clocks either gain or lose
time, and they are not adjusted for daylight savings time).
So, the investigator writes down in his notebook the exter-
nal world time and the computer clock time when the
experiment starts, and at the end of the experiment the
start time of the data file is adjusted for the actual time at
which the experiment occurred. This type of file was used
to make figure Three B, for example.
In addition, during the experiment the investigators
download chunks of data every day or two, so that they
can follow the progress of the experiment, but mainly to
make sure the animals are healthy. (We record body tem-
perature and locomotor activity, which are good indica-
tors of overall health, so that we do not have to disturb the
animals to examine them, which would also give them cir-
cadian cues.) The data are downloaded by hand, and the
new data each day are appended to the existing "working
file." There may be gaps in these files, if the investigator
chooses a segment that does not overlap with the previous
download. The gaps are filled in by "-1's", which our anal-
ysis routine plots in the actogram as a gap. The threshold
temperature is the three day running mean temperature
(except for the first and last two days, which are two day
running means), excluding any gaps (the "-1's" are recog-
nized by the program as a gap and not included in the
mean temperature calculation). The original figures S3B
and S3D were inadvertently made from the "working file"
for the same animal that was used to make figure Three B.
This file had not been adjusted for real world time, so that
it was displaced by about 1.5 hours. It also contained a
blank segment of approximately 3 hrs., which represented
one of the gaps frequently found in working files. The
Harvard review committee agreed that this was a human
error. The revised figures were not posted online until this
review was complete, and the editors at Science were
informed of the results by the Harvard committee, which
was the reason for the delay. We have maintained all of
the files and they are available for examination by any sci-
entist who would like to visit.
Mistlberger et al. [1] have further questioned why the
graphs for figures Three B and S3B should "appear to be
identical", if there is a segment of data missing from the
datafile used to make figure S3B, claiming that the "gap"
in figure S3B would cause the mean temperature for that
day to be different, and hence affect the way the remaining
points are plotted in the actogram. The mean temperature
for the day in which the "gap" appears in the original fig-
ure S3B was 36.43°C, while the mean temperature for the
same day in figure Three B, in which there is no gap was
36.49°C. Our software compares the body temperature of
the animal to a running three day mean. Thus the 0.06
degree difference was averaged over three days, which
were otherwise identical, and the differences in the three
day rolling averages for the days that included this data in
figure S3B amounted to 0.02 degrees. Another and much
larger source of difference between the two graphs (figures
Three B and original S3B) is that they start at different
times of day, so that the actual temperature readings that
constitute a "day" differ. The result is that the two graphs
Journal of Circadian Rhythms 2009, 7:9 />Page 7 of 16
(page number not for citation purposes)
are not at all identical. If one compares the two at high
magnification, as shown in Figure 1 in this review, there
are a number of times during the day when the two differ,
as would be expected for a graph produced by this thresh-
olding method.
1b. Waveforms for body temperature in figures Two and S3
The claim is made by Mistlberger et al. [1] that the fall in
body temperature during the feeding period in figures
Two and S3C should not occur. Our mice do not agree
with this claim. In our lab, under restricted feeding condi-
tions the intact mice (or those with Bmal1 gene replace-
ment in the DMH) show a strong increase in body
temperature (Tb) in anticipation of the feeding, but their
Tb falls after the food is eaten, back to the levels that were
sustained prior to feeding. The curves, as published, are
exactly what happens. A similar fall in Tb of 1–2°C after
onset of feeding has been reported by Kaur and coworkers
[22] under similar conditions for C57BL6 mice in
restricted feeding.
Although rats under restricted feeding in both Mistlberger
and coworkers 2009 paper [23] and in our own work
(Gooley et al[8], figure One D) do have increased body
temperature when eating, this is not true for mice, which
have a much smaller thermal mass, in a cool laboratory
(22–24°C). In fact, even the mice in the Moriya study [6],
in which Mistlberger was a co-author, showed a peak in
Tb just before and at the time of food presentation, then a
small fall, not a rise, in Tb during the remaining feeding
period (e.g., see the unlesioned animal in their figure
Nine A, on days 2,6, and 13 of restricted feeding; note that
on days 7 and 14, when the animals were not fed, the tem-
perature actually stayed even or rose during this period).
Although the fall in Tb documented by Moriya and cow-
orkers was smaller than in our study or that of Kaur and
colleagues [22], they used a different strain of mice (ddY
compared to C57BL6 in our study and that of Kaur et al.),
and the thermoregulatory behavior of different mouse
strains is notoriously variable.
In response to the series of questions raised by Mistlberger
et al. [1] about this study: the mice were indeed fed at this
time; the data are not misaligned; and they are most cer-
tainly not activity data (e.g., compare with our figure S2,
which shows activity data). C57BL6 mice simply behave
this way.
1c. Correspondence of waveforms in figures S3C and D, with
temperature "actograms" in figures S3A and B
As indicated in the response to 1a, the data in the acto-
grams are thresholded so that temperature intervals (5
min each, so 288 per day) are indicated as dark bars when
that interval is above the three day running mean (except
for the first and last days, which the software program
truncates to a two day running mean). The plots in panels
C and D are the mean body temperature for each 5 min
segment over days 10–14 of the experiment, plus or
minus the SEM, which is a very different type of plot. This
means that if the temperature on four days is 0.1 degrees
above the mean, and on the fifth day is 1.4 degrees below
the mean, the mean temperature for that time of day will
be 0.2 degrees below the mean, but the actogram will
show body temperature above the mean on four of five
days at that time. The plots are not meant to show the data
the same way, and in fact that is precisely why both types
of plots were used. Both plots S3A and C were derived
from the same datasets as S3B and D. We furthermore
show in Figure 2 in this review the full temperature curves
for these animals for all five days of recording. We would
be happy to demonstrate the dataset and analysis routines
to anyone who wants to try this. The claim by Mistlberger
et al. that these must be misaligned or different kinds of
data is simply incorrect.
1d. Whether animals in figures S3A and B are in DD or LD
Mistlberger et al[1] question whether the rhythm of
increased body temperature recorded during the pre-
sumptive dark cycle in these figures could have come from
free-running animals. The evidence for this is supposed to
be a "precise 24 hour rhythm." In fact, it is not precise at
all, as even a casual inspection of the record shows, and
A comparison of the data in figure 3B (upper line) and the original (incorrect) supplementary fig. S3B (lower line) in the Fuller et al. [2] paper, on the day in which fig. S3B contained a "gap"Figure 1
A comparison of the data in figure 3B (upper line) and the original (incorrect) supplementary fig. S3B (lower
line) in the Fuller et al. [2] paper, on the day in which fig. S3B contained a "gap". The images have been cut directly
from the online figures, resized to cover the same time period, and aligned by eye. The red vertical lines marking the feeding
time (the offset in the incorrect figure S3B due to not being corrected for the correct time of day) are clear. A piece of a red
arrow that marks the food deprivation day is also seen toward the left in the upper register. The "gap" period is the blank area
to the left of the red line in the lower register. Note that the lower register (the day in which mean body temperature was
0.06°C lower because of the missing data in the gap period) shows more time periods when the body temperature exceeded
the mean (marked by gray or black boxes, depending upon how high the temperature was). Although the differences are sub-
tle, the two plots do not "appear to be identical" as claimed by Mistlberger [1].
Journal of Circadian Rhythms 2009, 7:9 />Page 8 of 16
(page number not for citation purposes)
the actual period is slightly greater than 24 hours in the
animal in S3A (which is why the onset of increase is
slightly later than the onset of the presumptive light cycle)
and slightly less than 24 hours in the animal in S3B
(which is why the onset of the increase is slightly before
the presumptive light cycle, and gets earlier over the
course of the experiment). Both are within the range seen
for C57 mice.
In summary
We made one unfortunate error in composing the original
figure S3, which was due to inadvertently using a single
incorrect data file to make the graphs S3B and D. We cor-
rected this error as soon as possible after it was pointed
out to us. All of the other issues raised by Mistlberger et al.
about possible "errors in alignment or labeling of figures"
are without foundation.
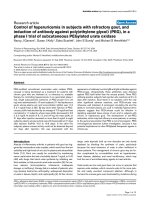
2a. Selectivity of rescue of Bmal1 -/- mice by injection of AAV-Bmal1
Mistlberger et al. [1] raise two concerns with respect to the
autoradiographs used to demonstrate that restricted feed-
ing activates clock gene expression selectively in the DMH.
The first issue is that we showed full sections for the Per1
hybridization, but only cropped photos of the Bmal1
hybridization for our rescued animals. We would point
out that cropping autoradiographic images to the field of
interest is quite common: Mistlberger and colleagues in
the Moriya et al. [6] paper used images of autoradiograms
that were cropped to show the hypothalamus in the same
way as ours. The reason we did not feel it was necessary to
show portions of the brain beyond the injection sites from
Bmal1 -/- animals is that it is well known that animals
without the Bmal1 gene do not express Bmal1 in the brain
[24]. Showing more of the brain would only be of value
to prove that the brains were not mislabeled (i.e., were not
from Bmal1 -/- animals), as Mistlbeger et al. imply. We
therefore are providing two additional figures. Figures 3
and 4 in this review show the full set of autoradiograms
from the forebrains of two Bma1I -/- animals, one with an
injection of AAV-Bmal into of the SCN and one into the
DMH, respectively. These clearly show that the only areas
of hybridization in those brains were at the injection sites.
The second concern was that the background levels of
expression of Per1 shown in our Suplementary figure S4 in
the Fuller et al. paper were similar in images shown for a
Bmal1 +/- mouse (panel E) and a Bmal1 -/- mouse with a
suprachiasmatic injection of AAV-Bmal1 (panel G). With
isotopic in situ hybridization, there is always background
labeling, which depends upon the exact probe used and
its specific activity, stringency of washes, and sensitivity
and duration of emulsion exposure. There may be differ-
ences in hybridization between different batches of probe,
between slides in the same set, and even across a single
slide. It is typical of autoradiograms to show higher back-
ground over areas containing large neuronal cell bodies
(e.g., the pyramidal cells of the cerebral cortex or the hip-
pocampus). This is quite apparent in the paper by Bunger
et al. [24]; compare their figure Three H showing Per2
expression at the level of the SCN in a Bmal1 -/- animal,
with our figure S4B in the Fuller et al. paper. Note that the
Bunger paper only shows Per1 and Per2 and only at one
level of the brain (the SCN). There are no figures in that
paper comparable to our figures S4E or G.
In our study, the autoradiograms were done over a consid-
erable period of time, using different batches of probe,
and thus had different levels of background activity over
the tissue. This study, which was started before the Mieda
et al. [25] paper appeared, was initially intended to be a
survey looking for cell groups with increased clock gene
expression under restricted feeding, and not for quantita-
tive mRNA measurements (see point 4b below), which is
Graphs of body temperature for the animals in the corrected suplementary figure S3 in Fuller et al. [2]Figure 2
Graphs of body temperature for the animals in the
corrected suplementary figure S3 in Fuller et al. [2].
The blue line represents the heterozygote animal shown in
figures S3A and C, and the red line illustrates the Bmal1 -/-
animal with an injection of AAV-Cre into the suprachiasmatic
nucleus, shown in figures S3B and D, across the entire five
day period in restricted feeding from which the summary
graphs in panels C and D were derived. Note that the heter-
ozygote animal (blue) had a normal circadian variation in
body temperature, and a robust spike in temperature peaking
just around the onset of time of feeding (arrows), as shown
in the summary figure S3C. The animal with the injection of
AAV-Cre into the suprachiasmatic nucleus had reconstitu-
tion of the daily circadian pattern, but no evidence of the
anticipatory increase in body temperature prior to feeding,
although there was an increase each day after feeding, con-
sistent with the summary figure S3D.
Journal of Circadian Rhythms 2009, 7:9 />Page 9 of 16
(page number not for citation purposes)
A full set of forebrain autoradiograms on x-ray film from a Bmal1 -/- animal in restricted feeding who received an injection of AAV-Bmal1 into the suprachiasmatic nucleus bilaterallyFigure 3
A full set of forebrain autoradiograms on x-ray film from a Bmal1 -/- animal in restricted feeding who received
an injection of AAV-Bmal1 into the suprachiasmatic nucleus bilaterally. The box with solid lines identifies a section
at the level of the SCN showing hybridization over this nucleus, and only this nucleus. The box with dashed lines represents a
section at the level of the DMH, showing lack of hybridization.
Journal of Circadian Rhythms 2009, 7:9 />Page 10 of 16
(page number not for citation purposes)
A full set of forebrain autoradiograms on x-ray film from a Bmal1 -/- animal in restricted feeding with an injection of AAV-Bmal1 into the dorsomedial hypothalamic nucleus bilaterallyFigure 4
A full set of forebrain autoradiograms on x-ray film from a Bmal1 -/- animal in restricted feeding with an injec-
tion of AAV-Bmal1 into the dorsomedial hypothalamic nucleus bilaterally. The box with solid lines identifies a sec-
tion at the level of the DMH, showing selective hybridization over this nucleus and only this nucleus. The box with dashed lines
demonstrates a section at the level of the SCN, showing lack of hybridization.
Journal of Circadian Rhythms 2009, 7:9 />Page 11 of 16
(page number not for citation purposes)
best done by Northern blots, not by autoradiography.
When we found the robust activation of the DMH with
food restriction, we performed semi-quantitative meas-
urements on these images by using a ratio of the optical
density of hybridization (as measured in darkfield from
emulsion-dipped autoradiograms) over the DMH and
SCN compared to the adjacent lateral hypothalamus, as a
measure of background. (Ratios are commonly used to
compare in situ hybridization autoradiograms, as they
were by Mistlberger and colleagues in the Moriya et al. [6]
paper, although the specific ratio procedure was not
described in either paper.) However, our study was never
meant to measure absolute values of clock gene expres-
sion.
The images in Supplementary figure S4 in the Fuller et al.
paper and in Figures 3 and 4 in this Response, have not
been adjusted for differences in background binding
intensity between animals. Hence, Per1 in situ hybridiza-
tion background over the cerebral cortex, basal ganglia,
and hippocampus varies in Supplementary figure S4 pan-
els C, E, F, and G. We cannot rule out that there may also
have been some subtle variations in overall expression of
Per1 in these brain areas these experiments, because we
did not do the experiments in a way that could reliably
detect those changes.
2b. Were rhythms restored by injections of AAV-Bmal1 into the
DMH?
Mistlberger et al. [1] raise the concern that in figure Three
B in the Fuller et al. paper we do not show data on the
activity patterns in a Bmal1 -/- animal with DMH injec-
tions of AAV-Bmal1, while on ad lib food access prior to
food entrainment. This is important to establish that the
animal was indeed arrhythmic prior to RF. However, the
claim by Mistlberger is incorrect. The figure does in fact
show data from the day before food restriction began (on
the first line), and from the first day of food restriction
(second line), prior to the onset of entrainment. On both
days, the animal shows only the characteristic ultradian
rhythms seen in completely arrhythmic Bmal1 knockout
animals.
2c. Need for 48 hour fast to demonstrate entrainment to food
This is discussed above under point 3C. While we agree
that 48 hours of food deprivation would be ideal, this is
probably not achievable in mice. However, we disagree
with the statement that to establish that food anticipatory
rhythm is "not an hourglass effect" one must remove the
food for at least two cycles. If the anticipatory rhythm
were an hourglass or interval timer effect, it would con-
tinue through the presumptive feeding period, as the ani-
mal became more and more hungry. If the rhythm
represented circadian entrainment, it would collapse at
the time of the presumptive food presentation, even
though no food had been given. In our experiments (e.g.,
figure Three B), we found that the body temperature and
activity levels after the time of presumptive food presenta-
tion was substantially lower than in the interval before it,
thus supporting that this is circadian entrainment. In
addition, unlike the measures that Mistlberger and col-
leagues have applied, the measures that we use are
reduced, not increased, with starvation, and thus the ele-
vated activity prior to food presentation cannot be due to
an interval timer phenomenon.
Also, as pointed out above, Mistlberger himself has at
times completely omitted food deprivation after restricted
feeding (e.g., [9]) and yet claimed entrainment of Bmal1 -
/- mice. In another paper Mistlberger co-authored with
Moriya et al [6], the authors indicate that they used 46 or
58 hour food deprivation to demonstrate food entrain-
ment of mice with DMH lesions, but show data only out
to 39 hrs in their study (i.e., do not show the second cycle
of anticipatory behavior), and the health of these animals
at later time points is not indicated. It is not clear why Mis-
tlberger considers demonstrating data from a 48 hour fast
in mice to be a standard that is necessary for our work, but
not his own.
2d. Is there an anticipatory increase in body temperature in the
Bmal1 knockout animals?
Mice show ultradian cycles in body temperature, and
these are exaggerated in Bmal1 -/- animals. Mistlberger et
al. [1] try to draw lines through these cyclic variations,
which occur at random times prior to the onset of the
feeding in the Bmal1 -/- mice (because they do not
entrain). These look nothing like the robust (greater than
1.5 degrees C) increases in body temperature that are sus-
tained over a 3 hour period prior to food presentation in
wildtype mice, or those in whom Bmal1 has been restored
in the DMH. Compare figures Two B and S3D in the Fuller
et al. paper (reproduced in the Mistlberger review as their
figure Eight) with figures S3A and C (Mistlberger figure
Three). More importantly, the summary figure Two D in
the Fuller paper [2] indicates that when the temperature is
averaged for all animals over the entire three hour antici-
patory time window, a method that averages out the ultra-
dian rhythms precisely because they are not timed by the
food presentation, the Bmal1 -/- animals show no antici-
patory increase in temperature.
2e. Did Bmal1 -/- mice lose weight in food restriction?
Our animals eat about 85% of the total amount of food
on food restriction as when they have food ad lib. This is
because when the animals fail to wake up, we gently
arouse them after food presentation, so that they can eat.
On an ad lib diet the Bmal1 -/- mice are smaller than
wildtype mice, but they gain weight. On food restriction
they initially lose a small amount of weight (about 5%),
Journal of Circadian Rhythms 2009, 7:9 />Page 12 of 16
(page number not for citation purposes)
but rapidly gain that back and at the end of the experi-
ment are approximately the same weight as at the begin-
ning (see Figure 5 in this review). Wildtype mice on
restricted feeding also typically lose about 5% of body
weight initially, gain that back, but then continue to gain
weight, although at a slower rate than ad lib fed wildtype
mice. In the two examples cited by Mistlberger et al[1]
from the Yamazaki laboratory, it is not clear that the
investigators actually took the precaution of awakening
the mice after the onset of the food period, so they could
eat. It is also noteworthy that in the experiment where the
animals lost 25% of their body weight, they were only 5–
8 weeks old (these are very small juvenile animals; ours
were young adults, 9–11 weeks old at the start of the
study). Similarly, the age of the animals in the personal
communication from Nakamura is not stated. In a third
experiment from Yamazaki, where the age of the mice was
not reported, they lost only 8–9% of body weight. This is
much closer to our experience, and indicates that the
weight changes under RF vary depending upon the age of
the animals, configuration of the cage, and probably
many other factors (type of diet, ambient temperature,
etc.). Another important factor in the reports by Yamazaki
and colleagues would be whether the animals had access
to running wheels as they did in the Pendergast et al.
paper [11], and in other investigations such as Storch and
Weitz [10]. Mohawk and colleagues[16] reported that
Bmal1 -/- mice died (presumably from running them-
selves to death) when they were given access to running
wheels, even when fed ad lib. Thus the excessive weight
loss seen in labs using running wheels with Bmal1 -/- mice
does not apply in our laboratory environment, nor does
the method that we use in moving mice to restricted feed-
ing impair their health. The observations in our lab are
precisely as reported.
3a. The numbers of mice used in the different experiments
in our paper [2] were as follows: Recordings of circadian
behavior in Bmal1 -/- mice and controls: n = 12 (6 Bmal -
/- mice and 6 Bmal +/- controls). Replacement of AAV-
Bmal1 in the SCN n = 25 (6 had bilateral SCN hits; 16
missed the SCN; 3 AAV-GFP injections into the SCN were
used as controls). Replacement of AAV-Bmal1 in the DMH
n = 8 (4 had bilateral DMH hits and 4 missed the DMH).
For the circadian study of clock gene expression during
restricted feeding, three mice were used per time point (11
time points), per condition (ad lib vs. restricted feeding),
or 66 mice.
3b. Age of mice
As noted above, the mice used in our studies were young
adults, aged 9–11 weeks at the time of surgery to implant
the temperature/activity recorders. The experiments had
durations of 4–6 weeks. As noted, the animals maintained
their weight during the 4 hour food restriction protocol.
Thus our mice were 13–17 weeks old at the end of the
experiments. By contrast, the mice in the Technical Com-
mentary on our work by Mistlberger et al. [9] were 109 ±
3 days, or 15–16 weeks at the beginning of his experiment
which then went on for 60 days. Thus the comment that
our Bmal1-/- animals may have failed to show entrain-
ment because they were too old is incorrect.
3c. Success rate of injection placement
Mistlberger and colleagues are correct that it is not easy to
place stereotaxic injections in small hypothalamic nuclei
in mice. The senior author (CBS) has been making small
stereotaxic injections into the hypothalamus since 1974,
however, and the technician who made the injections in
this study was trained by him in 1982 and can hit the SCN
bilaterally in about 25% of mice, and the DMH (which is
a bigger target and easier to hit) in about 50%. The injec-
tions were fairly large, about 100 nl on each side, covering
about a 800 micron sphere. As a result they either hit their
target bilaterally (if the injections were at the correct AP
and DV level) or missed bilaterally (if they were not).
There were no unilateral hits in these series. Because
Bmal1 was under its own promoter, it would only be
expressed in cells that would normally express this gene.
For example, nothing else in the SCN region normally
expresses Bmal1 at detectable levels by autoradiography.
Hence, even if the injection spills over into adjacent areas,
Bmal1 expression is confined in the autoradiographs to
the SCN. This is clear in the autoradiograms in figure One
Weights of Bmal1 +/- (blue) and -/- animals (red) across the food restriction experimentsFigure 5
Weights of Bmal1 +/- (blue) and -/- animals (red)
across the food restriction experiments. Each animal is
plotted as a single line, with the heterozygotes in blue and
the homozygotes in red. The Bmal1 -/- animals are smaller,
but both groups maintain their body weight well on the
restricted feeding protocol that we used.
Journal of Circadian Rhythms 2009, 7:9 />Page 13 of 16
(page number not for citation purposes)
in Fuller et al. [2]. All animals with bilateral hits in SCN or
DMH are reported in the Fuller et al. paper, and one of
each type is shown in Figures 3 and 4 in this review. All
animals with bilateral misses, as identified anatomically,
had results similar to Bmal1 -/- animals, and were not
shown in the paper.
3d. Graph of Tb in groups of mice in figure Two D
This graph shows the mean temperature for each group of
animals, for days 10–14 of the experiment. None of the
animals showed torpor during this time window on those
days when kept in DD (see next section). The full temper-
ature curves for both of these animals for those five days
are now shown in Figure 2 in this review.
3e. Timing of torpor
Mistlberger et al[1] question our statement that in ani-
mals on restricted feeding during LD, more episodes of
torpor occurred during the dark period. Our observations
replicate the thermoregulatory behavior of mice that has
been reported by multiple other laboratories. For exam-
ple, Damiola et al. reported a virtually identical pattern of
Tb falling into the low 30's during the dark phase when
mice were fed only during the light phase [26], and Kaur
et al. [22] showed a fall in Tb to about 28°C during the
dark phase with restricted feeding during the light phase.
Moriya et al. [6] do not show data for individual animals,
but in their figure Nine illustrate a fall in mean Tb across
the group down to about 33°C during the night for the
group of control animals on restricted daytime feeding in
LD. These are averaged data, so individual animals pre-
sumably dipped well below this temperature during peri-
ods of torpor. In the Damiola et al. experiment [26], the
animals were wildtype mice that had access to food for 12
hours during the light phase, so this behavior does not
represent a stress response to inadequate opportunity for
feeding. In addition, the same mice did not show torpor
when fed during the presumptive light phase in DD, or
when fed for 12 hours a day only during the dark phase.
This is simply part of the repertoire of thermal responses
of mice when fed only during the day in an LD cycle in a
cool laboratory. Because animals in torpor are not active,
if studies of restricted feeding are done in mice on LD,
without a measure of body temperature, the cycles of tor-
por during the dark phase under LD could be misinter-
preted as circadian entrainment of activity to the light
phase.
3f. Ambient temperature
The rooms used for our experiments are held at 22 ± 1°C.
Within these rooms, the animals are kept in isolation
chambers during the experiment. We have two types of
chambers in our lab: older chambers, which are larger and
leak more air, in which the internal temperature is the
same as the room; and newer smaller chambers with
tighter fitting doors, in which the temperature during an
experiment runs 24 ± 1°C. Thus both temperatures are
correct in our laboratory, and the actual number depends
upon which chambers were used. PMF wrote the original
Supplementary Materials and gave the value for the newer
chambers in which most of the studies, including all of
those with AAV injections, were done. CBS revised the
Supplementary Materials, and was not aware that the new
chambers were different from the older ones in this
regard, so changed this number back to what had previ-
ously been correct in the lab. Note that Mistlberger et al.
[1] misquote us in claiming that our temperatures were ±
0.1°C. Because the range in each of the two types of boxes
we use is actually ± 1°C, the two temperature ranges actu-
ally are very close and as neither temperature is anywhere
near the thermoneutral temperature for mice (about
29°C), this would not have affected our results in any
way.
Conceptual issues
4a. Measurement of food seeking behaviors
This is really the critical issue here. As we note above, any
behavior that is increased by food deprivation should not
be used for measurement of food entrainment because the
results inherently are confounded by homeostatic
responses as the animals become progressively hungrier
between feedings. (This is the "interval timer" identified
by Pendergast and co-workers[11].) The measures we have
used, both Tb and general cage locomotion (measured
with an implanted telemetry device, so that all cage move-
ment is equally recorded) show an overall decrease during
food deprivation both in our experiments (see Gooley et
al., Table, where mean daily Tb falls from 37.50°C in ad
lib to 35.07 with RF, and activity counts from 927 to 635),
and in the experiments reported by Kaur et al. [22] (see
their figures One and Two). Moriya et al. also found this
for Tb when implanted telemetry transmitters were used
[6] (their figure Nine). This is not the case for wheel-run-
ning [10,11], or for the infrared motion detectors used in
the experiments by Mistlberger and colleagues, where
food restriction routinely increases the levels of overall
activity [4,5] (figure Three A in the Landry et al., 2007
paper shows a gradual increase in the number of counts
per day for animals in RF, from about 1600 counts per day
to 2000 counts per day, and this increases to 2100 counts
with food deprivation).
Interestingly, in two recent papers Mistlberger and col-
leagues [6,23] compare the activity during restricted feed-
ing using motion sensors as well as telemetry. In both
papers, the motion counts were ''normalized (using the
daily mean)'' [23], which is explained in Moyriya et al. [6]
as "counts relative to the daily total, i.e., counts for each
hour as a percentage of total daily counts for the day." This
manipulation obscures whether the total counts are
Journal of Circadian Rhythms 2009, 7:9 />Page 14 of 16
(page number not for citation purposes)
increased by food restriction (as they are with motion sen-
sors), or decreased (as they are with telemetry). Mistlberger
(2009b) claims that "overhead motion sensors and telem-
etry are equivalent measures of food anticipatory activity
in rats." We cannot agree that these two methods measure
''the same thing'' in restricted feeding when one measure
is substantially increased by food restriction and the other
is dramatically decreased. Furthermore, the use of only
''normalized activity'' to hide this difference is deceptive,
and should not be employed in studies comparing the
two measures. Although the two measures coincide in
daily pattern during restricted feeding in intact animals,
raw counts in animals with effective DMH lesions or lack
of Bmal1 expression would show that the two measures
diverge (because the motion sensors would still detect the
''interval timer'' effect discussed by Pendergast et al. [11],
while the telemetry transmitters would have no circadian
signal to report). Unfortunately, the text of the report by
Moriya includes only five animals with telemetry trans-
mitters, and it is not clear from either the histology or
physiology which if any of them had effective DMH
lesions [6].
4b. What our experiments have demonstrated
Mistlberger and colleagues consistently misrepresent what
we have shown, and how we frame it. They claim that our
"two studies appear to establish that the DMH contains
Bmal1-dependent circadian oscillators that are both nec-
essary and sufficient for the expression of food-entraina-
ble behavioral and temperature rhythms in rodents." This
is not correct. The study by Gooley et al. [8] shows that
food-entrainment of wake-sleep, Tb, and LMA rhythms in
rats depends upon the integrity of the DMH. We tested the
role of the DMH because our previous work had shown
that it was necessary to relay SCN output to control circa-
dian rhythms of wake-sleep, locomotor activity, corticos-
teroid secretion, and feeding [7]. The point of the Gooley
et al. paper was that the food entrainable oscillator uses
the same output mechanisms through the DMH as does
the SCN. We did not present data on the location of the
food entrainable circadian oscillator in the Gooley paper,
nor did we make any claims to do so.
The Fuller et al. [2] paper shows that there is activation of
robust, rhythmic clock gene expression in the compact
part of the DMH during restricted feeding, and this is con-
sistent with the work of Mieda et al., [25] and Moriya et al.
[6], but was the first to show that a gene from the positive
limb of the clock cycle, Bmal1, cycles in antiphase to the
Per genes that had been studied by Mieda [25]. Moriya et
al. [6] confirm this finding. The compact part of the DMH
is a separate component from the neurons involved in
providing circadian output pathways (which reside in the
diffuse part of the DMH [6]). The Fuller paper shows that
a Bmal1-dependent clock gene mechanism in the DMH is
sufficient to drive food-entrained rhythms of Tb and LMA.
We specifically pointed out that there may be other clocks
elsewhere in the body that are also capable of driving this
rhythm. In fact, the lead sentence in the last paragraph of
our paper is: "In an intact animal, peripheral oscillators in
many tissues in the body, including the stomach and the
liver, as well as elsewhere in the brain, may contribute to
food entrainment of circadian rhythms."
Mistlberger et al. also question whether the robust, rhyth-
mic clock gene expression in the DMH during restricted
feeding is actually gene induction, rather than an increase
and a shift in an existing rhythm. We agree that it is possi-
ble that there is some low level of background clock gene
expression in the DMH under ad lib feeding. However our
experiments were not designed to detect this (see section
2a above), and in fact we did not find the expression of
Per1 or Bmal1 under ad lib feeding to differ from back-
ground in the adjacent lateral hypothalamus. The experi-
ments of Mieda et al. [25] labeled Per1-positive neurons in
the DMH by non-isotopic in situ hybridization. Moriya et
al. misquote the Mieda paper as describing a "three-four
fold higher expression near the end of the dark phase
(ZT13) compared to the mid-light phase (ZT7)" for Per1.
In fact, all of these values are cell counts, not mRNA levels,
and they show fluctuations in background levels of
expression, with "peaks" at ZT1 and ZT13, and troughs at
ZT7 and ZT19, hardly a circadian pattern. Also because
they have only two animals per time point, there is no way
to identify a statistically significant rhythm from their
data. Moriya et al. [6] used densitometry from x-ray film
to measure clock gene expression, but provided no details
on how they dealt with background or variability between
animals and slides. The mRNA levels are shown as a per-
centage, with animals on ad lib feeding at ZT6 always plot-
ted at 100%, suggesting that they were used as an internal
standard for measuring a ratio. Nothing is stated about
measurement of background levels of binding of the
probe (e.g., in animals with clock gene knockouts). Thus,
it is not clear what the low amplitude variations in levels
of expression in animals that were fed ad lib represent.
Northern blots would be preferable for measure of low
levels of gene expression. As in our paper, ratios are
mainly useful for providing semi-quantitative depiction
of large changes in density, such as occur in the SCN and
DMH, and are not suitable for measuring low level
changes in gene expression (less than 2–3 fold differ-
ences).
In summary, we do not know whether there are very low
levels of expression of Per or Bmal1 genes in the DMH in
ad lib fed mice or whether they have a circadian rhythm,
because the levels we observed under those conditions fell
below the threshold for the method we used. Verification
of a baseline level or rhythm of clock gene expression in
Journal of Circadian Rhythms 2009, 7:9 />Page 15 of 16
(page number not for citation purposes)
DMH neurons in ad lib fed animals awaits the application
of more accurate methods. Nevertheless, our observations
[2] and those of Mieda et al. [25] stand that restricted feed-
ing causes a much greater increase in expression of clock
genes (Per1, Per2, and Bmal1 in appropriate phase rela-
tionship) in the DMH [2,25] and the dorsal vagal complex
[25] than other sites in the brain (and no change in the
SCN); that Per expression in the DMH begins during the
time that the animals become active in anticipation of
feeding (with Bmal1 expression in antiphase to this)
[2,25]; and that the clock genes in the DMH continue to
cycle for several days after they are activated, even in the
absence of feeding (whereas those in dorsal vagal complex
do not [25]). Finally, no other brain area shows anywhere
near this robust level of clock gene activation, a finding
that Moriya et al. [6] also supported.
Does this mean that no other clocks in the brain or body
participate in food entrainment of circadian rhythms? No,
we have never claimed that nor would we, because it has
not been tested yet.
Conclusion
We are deeply disappointed that the "review" by Mistl-
berger et al. [1] purports to address "Standards of evidence
in chronobiology," but barely touches the surface of this
important problem. Instead, the authors use the opportu-
nity to attack our work and raise a series of baseless (and
needless) accusations (which we address in the last part of
our Response).
We have used the first part of our Response to return to the
original problem, to identify a set of "standards of evi-
dence in chronobiology," and have reviewed the work
cited by Mistlberger and colleagues as disagreeing with us,
in light of these standards. When viewed in this way, we
believe that the results across the field are explainable by
differences in methodology. In particular, use of activity
measures that are increased during food deprivation
results in preservation of food anticipatory activity in ani-
mals with DMH lesions or clock gene mutations, because
of an "interval timer" effect, rather than persistence of a
circadian oscillator. In addition, lesion studies require
careful and rigorous controls and lesion characterization,
which can only be applied when cell-specific lesions are
used. When that standard is applied, the studies cited by
Mistlberger et al. as showing food entrainment in DMH
lesioned rats and mice are not valid, because the animals
never had adequate documentation of DMH lesions in
the first place.
We stand by our findings that the DMH is necessary for
organizing food entrained circadian rhythms, and that
under restricted feeding there is robust activation of high
levels of rhythmic expression of clock genes in the DMH,
which is sufficient to restore food entrained rhythms. We
do not know whether there are other clocks elsewhere in
the body that are capable of driving the DMH output neu-
rons (as they are usually driven by the SCN clock during
ad lib feeding) and shaping circadian rhythms during food
entrainment. There remains a great deal to be learned
about the organization of circadian rhythms by the brain,
and we hope that this will be done in the spirit of collegial
and open exchange of information, and with the same
high standards for evidence applied to all of the work in
the field.
Competing interests
The authors declare that they have no competing interests.
Authors' contributions
All authors contributed to the writing of this article. All
authors read and approved the final manuscript.
Acknowledgements
The authors thank Nina Vujovic and Joshua Gooley for helpful discussions.
References
1. Mistlberger RE, Buijs RM, Challet E, Escobar C, Landry GJ, Kalsbeek
A, et al.: Standards of evidence in chronobiology: critical
review of a report that restoration of Bmal1 expression in
the dorsomedial hypothalamus is sufficient to restore circa-
dian food anticipatory rhythms in Bmal1-/- mice. J Circadian
Rhythms 2009, 7(3):3.
2. Fuller PM, Lu J, Saper CB: Differential rescue of light- and food-
entrainable circadian rhythms. Science 2008, 320:1074-1077.
3. Stephan FK: The "other" circadian system: food as a Zeitge-
ber. J Biol Rhythms 2002, 17:284-292.
4. Landry GJ, Yamakawa GR, Webb IC, Mear RJ, Mistlberger RE: The
dorsomedial hypothalamic nucleus is not necessary for the
expression of circadian food-anticipatory activity in rats. J
Biol Rhythms 2007, 22:467-478.
5. Landry GJ, Simon MM, Webb IC, Mistlberger RE: Persistence of a
behavioral food-anticipatory circadian rhythm following dor-
somedial hypothalamic ablation in rats. Am J Physiol Regul Integr
Comp Physiol 2006, 290:R1527-R1534.
6. Moriya T, Aida R, Kudo T, Akiyama M, Doi M, Hayasaka N, et al.: The
dorsomedial hypothalamic nucleus is not necessary for food-
anticipatory circadian rhythms of behavior, temperature, or
clock gene expression in mice. Eur J Neurosci 2009,
29:1447-1460.
7. Chou TC, Scammell TE, Gooley JJ, Gaus SE, Saper CB, Lu J: Critical
role of dorsomedial hypothalamic nucleus in a wide range of
behavioral circadian rhythms. J Neurosci 2003, 23:10691-10702.
8. Gooley JJ, Schomer A, Saper CB: The dorsomedial hypothalamic
nucleus is critical for the expression of food-entrainable cir-
cadian rhythms. Nat Neurosci 2006, 9:398-407.
9. Mistlberger RE, Yamazaki S, Pendergast JS, Landry GJ, Takumi T,
Nakamura W: Comment on "Differential rescue of light- and
food-entrainable circadian rhythms".
Science 2008, 322:675.
10. Storch KF, Weitz CJ: Daily rhythms of food-anticipatory behav-
ioral activity do not require the known circadian clock. Proc
Natl Acad Sci USA 2009.
11. Pendergast JS, Nakamura W, Friday RC, Hatanaka F, Takumi T, Yama-
zaki S: Robust food anticipatory activity in BMAL1-deficient
mice. PLoS ONE 2009, 4:e4860.
12. Richter CP: A behavioristic study of the activity of the rat.
Comp Psychol Monogr 1922, 1:1-54.
13. Honma K, Honma S: Effects of methamphetamine on develop-
ment of circadian rhythms in rats. Brain Dev 1986, 8:397-401.
14. Honma K, Honma S, Hiroshige T: Activity rhythms in the circa-
dian domain appear in suprachiasmatic nuclei lesioned rats
given methamphetamine. Physiol Behav 1987, 40:767-774.
Publish with BioMed Central and every
scientist can read your work free of charge
"BioMed Central will be the most significant development for
disseminating the results of biomedical research in our lifetime."
Sir Paul Nurse, Cancer Research UK
Your research papers will be:
available free of charge to the entire biomedical community
peer reviewed and published immediately upon acceptance
cited in PubMed and archived on PubMed Central
yours — you keep the copyright
Submit your manuscript here:
/>BioMedcentral
Journal of Circadian Rhythms 2009, 7:9 />Page 16 of 16
(page number not for citation purposes)
15. Tataroglu O, Davidson AJ, Benvenuto LJ, Menaker M: The metham-
phetamine-sensitive circadian oscillator (MASCO) in mice. J
Biol Rhythms 2006, 21:185-194.
16. Mohawk JA, Baer ML, Menaker M: The methamphetamine-sensi-
tive circadian oscillator does not employ canonical clock
genes. Proc Natl Acad Sci USA 2009, 106:3519-3524.
17. Ranson SW: Somnolence caused by hypothalamic lesions in
monkeys. Arch Neurol Psychiatr 1939, 41:1-23.
18. Olney JW, Price MT: Excitotoxic amino acids as neuroendo-
crine research tools. Methods Enzymol 1983, 103:379-93.
19. Lu J, Greco MA, Shiromani P, Saper CB: Effect of lesions of the
ventrolateral preoptic nucleus on NREM and REM sleep. J
Neurosci 2000, 20:3830-3842.
20. Lu J, Zhang YH, Chou TC, Gaus SE, Elmquist JK, Shiromani P, et al.:
Contrasting effects of ibotenate lesions of the paraventricu-
lar nucleus and subparaventricular zone on sleep-wake cycle
and temperature regulation. J Neurosci 2001, 21:4864-4874.
21. Nakamura K, Morrison SF: Central efferent pathways mediating
skin cooling-evoked sympathetic thermogenesis in brown
adipose tissue. Am J Physiol Regul Integr Comp Physiol 2007,
292:R127-R136.
22. Kaur S, Thankachan S, Begum S, Blanco-Centurion C, Sakurai T, Yan-
agisawa M, et al.: Entrainment of temperature and activity
rhythms to restricted feeding in orexin knock out mice. Brain
Res 2008, 1205:47-54.
23. Mistlberger RE, Kent BA, Landry GJ: Phenotyping food entrain-
ment: motion sensors and telemetry are equivalent. J Biol
Rhythms 2009, 24:95-98.
24. Bunger MK, Wilsbacher LD, Moran SM, Clendenin C, Radcliffe LA,
Hogenesch JB, et al.: Mop3 is an essential component of the
master circadian pacemaker in mammals.
Cell 2000,
103:1009-1017.
25. Mieda M, Williams SC, Richardson JA, Tanaka K, Yanagisawa M: The
dorsomedial hypothalamic nucleus as a putative food-
entrainable circadian pacemaker. Proc Natl Acad Sci USA 2006,
103:12150-12155.
26. Damiola F, Le MN, Preitner N, Kornmann B, Fleury-Olela F, Schibler
U: Restricted feeding uncouples circadian oscillators in
peripheral tissues from the central pacemaker in the supra-
chiasmatic nucleus. Genes Dev 2000, 14:2950-2961.