Báo cáo y học: "Measuring the impact of apnea and obesity on circadian activity patterns using functional linear modeling of actigraphy data" pps
Bạn đang xem bản rút gọn của tài liệu. Xem và tải ngay bản đầy đủ của tài liệu tại đây (822.01 KB, 10 trang )
RESEARCH Open Access
Measuring the impact of apnea and obesity on
circadian activity patterns using functional linear
modeling of actigraphy data
Jia Wang
1
, Hong Xian
1,2
, Amy Licis
3
, Elena Deych
1
, Jimin Ding
4
, Jennifer McLeland
3
, Cristina Toedebusch
3
, Tao Li
1
,
Stephen Duntley
3
and William Shannon
1*
Abstract
Background: Actigraphy provides a way to objectively measure activity in human subjects. This paper describes a
novel family of statistical methods that can be used to analyze this data in a more comprehensive way.
Methods: A statistical method for testing differences in activity patterns measured by actigraphy across subgroups
using functional data analysis is described. For illustration this method is used to statistically assess the impact of
apnea-hypopnea index (apnea) and body mass index (BMI) on circadian activity patterns measured using
actigraphy in 395 participants from 18 to 80 years old, referred to the Washington University Sleep Medicine
Center for general sleep medicine care. Mathematical descriptions of the methods and results from their
application to real data are presented.
Results: Activity patterns were recorded by an Actical device (Philips Respironics Inc.) every minute for at least
seven days. Functional linear modeling was used to detect the association between circadian activity patterns and
apnea and BMI. Results indicate that participants in high apnea group have statistically lower activity during the
day, and that BMI in our study population does not significantly impact circadian patterns.
Conclusions: Compared with analysis using summary measures (e.g., average activity over 24 hours, total sleep
time), Functional Data Analysis (FDA) is a novel statistical framework that more efficiently analyzes information from
actigraphy data. FDA has the potential to reposition the focus of actigraphy data from general sleep assessment to
rigorous analyses of circadian activity rhythms.
Keywords: Apnea, BMI, circadian activity patterns, Functional Data Analysis
1. Introduction
Activity measured by wrist actigraphy has been shown
to be a valid marker of entrained Polysomnography
(PSG) sleep phase and is strongly correlated with
entrained endogenous circadian phase [1]. Actigraphy
data is recorded densely, such as every minute or every
15 seconds, for each patient over multiple days. This
data is generally analyzed by reducing the time series
activity values to summary statistics such as sleep/wake
ratios, [2,3] total sleep time, [2,4] sleep efficiency, [5,6]
wake after sleep onset, [2,3,6] ratio of nighttime activity
to daytime activity or tot al activity, [7,8] standard devia-
tion of sleep onset time, [9] and intra-daily variability
[10]. More complex modeling of actigraphy includes
spectral analysis, [7] cosinor analysis [7] and waveform
eduction calculated as an “ average waveform” for s ome
period [11].
In this paper we propose a novel statistical framework,
Functional Linear Modeling (FLM), a subset of Func-
tional Data Analysis (FDA), for analyzing actigraphy
data to extract and analyze circadian activity informa-
tion through direct analysis of raw activity values [12].
FLM extends standard linear regression to the analysis
of functions, which in this case repre sent circadian
activity patterns. FLM is performed by 1) converting a
subject’s raw actigraphy data to a functional form (i.e.,
* Correspondence:
1
Dept. of Medicine, Washington University School of Medicine, (660 South
Euclid Avenue), St. Louis, (63110), USA
Full list of author information is available at the end of the article
Wang et al. Journal of Circadian Rhythms 2011, 9:11
/>© 2011 Wang et al; licensee BioMed Central Ltd. This is an Open Access article distributed under the terms of the Creative Commons
Attribu tion License (http://creativecomm ons.org/licenses/by/2.0), which permits unrestricted use, distribution, and reproduction in
any medium, provided the original work is properly cited.
continuous curve over time), and 2) analyzing sets of
functions to see if they differ statistically across groups.
Our FLM-based analysis shows where and with what
level the difference between groups occurs along the
time, which provides valua ble reference for clinical ana-
lysis and treatments, and distinguishes our methods
from existing circadian analysis works (see [13] for a
review). Moreover, we adopted a non-parametric per-
mutation F test to detect the difference between groups,
which makes the results robust to the uncertaint y in
raw data distribution. Using FLM, we show that the
apnea-hypopnea index (apnea) has a statistically signifi-
cant impact on circadian activity patterns, while body
mass index (BMI) in this dataset has little impact.
2. Methods
2.1 Participants and Measures
Participants were recruited prospectively from the clinic
at Washington University in St. Louis Sleep Medicine
Center. The sleep center is a multidisciplinary clinic at a
tertiary medical facility. Clinic patients with a suspected
diagnosis of obstructive sleep apnea (OSA), insomnia, or
restless legs syndrome (RLS) were invited to participate.
Pregnant women, individuals under age of 18, and
patients who report working an evening or overnight
shift were excluded from participation due to known
biologically different circadian clocks. Clinical covariates
such as BMI, co-morbidities, concomitant medications,
and presenting sleep complaints were collected. Partici-
pants underwent an overnight PSG when clinically indi-
cated. These data were collected in accordance with the
standards of the American Academy of Sleep Medicine
(AASM) and were reviewed by a bo ard certified sleep
physician. PSG data were scored according to the
AASM Manual for the Scoring of Sleep and Associated
Events. This ongoing study has been approved by the
Washington University School of Medicine Institutional
Review Board.
Activity was measured using Actical devices (Philips
Respironics Inc.) which were positioned on the non-domi-
nant wrist of subjects at the initial sleep center visit and
set to measure activity every minute for 7 days. Three
hundred and ninety five patients have been recruited, of
which 305 have apnea and/or BMI measured. This sub-
group comes from a larger NIH funded study currently
recruiting a cross section of 750 patients referred to the
Washington University Sleep Medicine Center for the pur-
pose of developing and validating functional data analysis
methods for actigraphy data (HL092347).
2.2. Functional Data Analysis (FDA)
FDA is an emerging field in statistics that extends classi-
cal statistical methods for analyzing sets of numbers
(scalars for univariate analyses, and vectors for
multivariate analyses) to analyzing sets of functions [13]
[15]. FDA is a subset of the larger field called ‘object
data analysis’ or ‘object oriented data analysis’ that uses
statistical methods to analyze data that are in non-
numeric form such as images, graphs (e.g., trees), or
functions [14,15]. The goal of object oriented data ana-
lysis is to analyze objects in their natural form (e.g.,
functions, graphs) to extract more information than
generally can be extracted when the objects are con-
verted into simpler summary measures (e.g., average
activity level, total sleep time) where standard statistical
methods can be applied.
2.2.1 Functional smoothing
Functional data analysis (FDA) begins by replacing dis-
crete activity values measured at each time unit (e.g.,
minute) by a function to model the data and reduce
variability. The function represents the expected activity
value at each time point measured. Since the actigraphy
has equidistant data, to allow flexibility i n representing
the data as a function, a Fourier expansion model is
used, though any smoothing method coul d be used. Let
y
kj
be the discrete activity count for patient k at time
point t
kj
, then the model
y
kj
= Activity
k
(t
kj
)+ε
k
(t
kj
)
(1)
represents activity, where k =1,2, ,N,N is total num-
ber of patients, j = 1, 2, ,T
k
, T
k
is the total number of
time points for patient k. In our dataset, observation
times are minutes fr om midnight to midnight in 24
hours, so all subjects have the same number of measure-
ments T
k
.
We convert the raw actigraphy data to a functional
form using a basis function expansion for Activity
k
(t
j
)
Activity
k
(t
j
)=a
1k
1
(t
j
)+a
2k
2
(t
j
)
+ ···+ a
nk
n
(t
j
)
(2)
where
{
a
ik
}
n
i
=
1
are scalar coefficients for patient k and
{
i
(·)}
n
i=1
are basis functions. Possible basis functions
include polynomial s (f(t)=a
1
t + a
2
t
2
+ +a
n
t
n
), Four-
ier basis
(f (t)=a
1
+ a
2
sin(ωt)+a
3
cos(ωt)+
a
4
sin(2ωt)+a
5
cos(2ωt)+···+ a
n
ϕ
n
)
,splines,
and wavelets.
Experimental results (unpublished) show most basis
functions work equally well and we have found a Four-
ier expansion with n = 9 basis functions capture the
major trend of activity pattern with reduced noise. Let
1
(t)=1,
2
(t)=cos(ωt),
3
(t)=
sin(ωt), ,
8
(t)=cos(4ωt),
9
(t) = sin(4ωt), ω =
2π
T
where T is the period, in our case T = 1440 (number
of minutes in 24 hours). Equation 1 becomes
Wang et al. Journal of Circadian Rhythms 2011, 9:11
/>Page 2 of 10
Activity
k
(t
j
)=
9
i=1
a
ik
i
(t
j
)
We will use this functional representation for all ana-
lyses in this paper.
Smooth coefficients of the expansion
{
a
ik
}
9
i=i
are esti-
mated by minimiz ing the unweighted least squares cri-
terion SMSSE [12]:
SMSSE
y
k
| a
k
=
1440
j=1
[y
jk
−
9
i=1
a
ik
i
t
j
]
2
(3)
where y
k
=(y
1k
, y
2k
, ,y
1440k
)
’
, a
k
=(a
1k
, a
2k
, ,a
9k
)’.
In matrix terms, this criterion becomes:
SMSSE
y
k
| a
k
=(y
k
− a
k
)
(y
k
− a
k
).
(4)
where F is a 1440 × 9 matrix w ith columns for basis
functions and rows for basis value at each minute.
Taking the derivative of the criterion SMSSE( y
k
|a
k
)
with respect to a, gives 2F
’
Fa
k
-2F
’
y
k
, and setting this
equal to 0 and solving for a provides the estimate
ˆ
a
that minimizes the least square solution,
ˆ
a
k
=
−1
yk.
(5)
Then, the vector
ˆ
y
of smoothed activity fitted values
is
ˆ
y
k
=
ˆ
a
k
=
−1
y
k
(6)
The raw data does not need to be normalized since all
analyzes are done on the functional form of the data.
To avoid introducing variation between weekday and
weekend activity patterns, only data from midnight
Monday to midnight Friday was used in this paper,
although this simplification is not required for analysis.
The five week days of actigraphy data wer e averaged into
a single 24 hour profile and a smooth Fourier expansion
function was fitted using a 24 hour periodicity and 9
basis functions. This produced a single 24 hour circa-
dian activity pattern for each subject that can be used to
estimate patient’ s activity level at any time point
throughout the day. We are developing and preparing to
publish functional linear mixed models which will ana-
lyze every day’s activity data to incorporate day effects,
weekday/weekend effects, and pre/post treatment effects
which will provide more insight into circadian rhythm
patterns and within-subject variability.
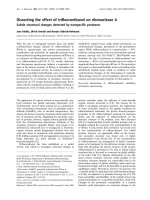
This data smoothing method is illustrated in Figure 1
for a typical subject. Plot (a) shows weekdays ordered
Monday through Friday from top to bottom , with the
time of day indicated on the X axis running from mid-
night to midnight, and the height of the spike indicating
the raw act ivity level on the Y axis collected by the acti-
graphy watch at each minute interval. Plot (b) shows the
activity averaged at each minute over the 5 days (black
points) and the Fourier expansion representing this
patient’s circadian activity pattern (red solid line).
2.2.2 Functional Linear Models
Reducing actigraphy data to a summary statistic can
mask differences across groups. For example, if one
Figure 1 Data flow for one subject. Plot (a) shows weekdays ordered M onday through Friday from top to bottom, with the time of day
indicated on the X and the height of the spike indicating the raw activity level on the Y axis. The plot (b) shows the activity averaged at each
minute over the 5 days (black points) and the Fourier expansion representing this patient’s circadian activity pattern (red solid line).
Wang et al. Journal of Circadian Rhythms 2011, 9:11
/>Page 3 of 10
group of patients has high activity in the morning and
low activity in the afternoon, and another group has a
reversed pattern with the same magnitude of activity,
low activity in the morning and high activity in the
afternoon, their average activity may be similar, and a
significant difference in circadian activity patterns would
be missed. F LM avoids masking by extending the linear
regression model to the analysis of smooth functions (i.
e. circadian activity patterns), and differences such as
described in this example become apparent.
The conceptual change going from cla ssical linear
regression to FLM is that the model regression coeffi-
cients, (e.g. b
0
, b
1
), and error term are functions. To
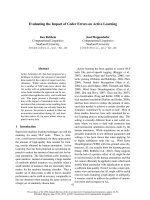
illustrate the use of FLMs for analyzing actigraphy data,
four subjects from our database with the highest apnea
scores and four subjects with the lowest apnea scores
were selected. apnea is a measure of apnea-hypopnea
index used routinely in sleep medicine, and measures
the severity of sleep apnea with high values indicating
more severe disease. In Figure 2, the circadian activity
patterns fitted by Fourier expansion for each of the 8
subject s are shown in separate plots with time recorded
on the X axis, and activity level on the Y axis. The top 4
plots show the high apnea subjects (severe sleep apnea)
and the bottom 4 plots show the low apnea subjects
(mild or no sleep apnea). Visually there is a large differ-
ence between the circadian patterns in th e high and low
apnea subjects.
Using this subset of subjects, functional smoothing
and linear modeling is illustrated in this section. In the
following section the methods are applied t o the full
dataset.
To test whether high and low apnea patients have dif-
ferent activity levels, standard approaches would reduce
each subject’s data to an average activity level, and a
classical statistical method such as linear regression
would test if these values are the same or different. For
example, a linear regression model to test if there are
differences in average activity between the high apnea
(average activity = 78, 76, 80 and 76) and low apnea
(average activ ity = 370, 397, 482 and 421) groups is
defined as
Activity
k
= β
0
+ β
1
× AHI + ε
k
.
(7)
where k = 1,2, ,8 are the subjects in Figure 2, apnea is
the group membership indicator with apnea = 1 for low
apnea subjects, apnea = -1 for high apnea subjects, and
ε
k
is the error term. The resulting model fit to this data
is Activity
k
=247.9+169.9×apnea,P<0.001,andR
2
= 0.97. The estimated mean activity in the 4 low apnea
subjects is 247.9 + 169.9 = 417.8, and in the 4 high
apnea subjects is 247.9 - 169.9 = 78. This statistical ana-
lysis confirms the clinical belief that apnea impacts
activity, and confirms what is seen in Figure 2. However,
it does not tell us when during the day activity levels are
different.
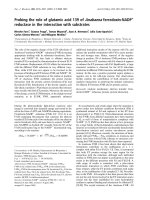
Figure 3 illustrates how functional linear modeling is
applied to actigraphy data to test for differences
between the two apnea groups, and show where during
the day those differences occur. Plot (a) shows the 8
individual circadian activity patterns with blue and red
line for high and low apnea groups, respectively. The
overall mean circadian activity pattern is the solid
Figure 2 Smoothed activity of 8 subjects fitted by Fourier expansion and shown in separate plots with time recorded on the X axis,
and activity level on the Y axis. The top 4 plots show the high apnea subjects and the bottom 4 plots show the low apnea subjects.
Wang et al. Journal of Circadian Rhythms 2011, 9:11
/>Page 4 of 10
black line and the mean circadian activity patterns
separately for the high and low apnea groups are the
thick blue and red line, respectively. Plot (a) shows a
clear separation of the mean circadian activity patterns
for the two apnea groups and identifies when during
daytime those curves differ. In addition, circadian
activity behaviors become apparent with this analysis.
For example, the maximum activity in the high apnea
group (thick blue line) occurs in the morning with a
steady decline in activity the remainder of the day,
compared to low apnea group (thick red line), the
maximumactivityoccursatabout3PMandisstable
from about 9 AM to noon and from about 6 PM to 9
PM.
As in the linear regression model described above, we
are interested in estimating regression coefficients that
will produce t he group-specific mean circadian activit y
patterns, and test if these mean circadian activity pa t-
terns are different across groups. This model, for apnea,
is defined as [12]:
Activity
k
(t )=β
0
(t )+β
1
(t ) × AHI+
ε
k
(t ), k =1,2, N
(8)
where the (t) notation indicates functions over the cir-
cadian period for activity (fitted by the Fourier
expansion to the actigraphy data for each subject k)
Activity
k
(t), the mean circadian activity pattern over all
subjects b
0
(t), the functional coefficient indicating how
the mean circadian activity patterns changes for low
apnea subjects (apnea = 1, b
0
(t)+b
1
(t)), or for high
apnea subjects (apnea = -1, b
0
(t)-b
1
(t)), and ε
k
(t)isthe
functional error term. In other words, the low apnea
group is predicted to have a mean circadian activity pat-
tern found by adding the two functions b
0
(t)+b
1
(t),
and the high apnea group is predicted to have a mean
circadian activity pattern found by subtracting the two
functions b
0
(t)-b
1
(t). In Figure 3A b
0
(t)isthethick
black line representing the overall mean, b
0
(t)+b
1
(t)is
thethickredlineforthemeanofthelowapneagroup,
and b
0
(t)-b
1
( t) is the thick blue line for the mean of
the high apnea group.
Equation 8 can be formulated as a matrix analysis pro-
blem as described above using a Nx2 design matrix Z
with rows indicating subjects and columns indicating
the mean function (column 1) and effects on the activity
due to apnea level g (column 2). In standard matrix
notation each row is a vector of 1’s and -1’s indicating if
the subject belongs to high apnea (1, -1) and low apnea
(1, 1). The two functional linear coefficients are repre-
sented in matrix notation as a ‘functional vector’
β(t)=
β
0
(t )
β
1
(t )
and the smo othed functional data represented in
matrix form by
Act(t)=
⎡
⎢
⎢
⎢
⎣
Activity
1
(t)
Activity
2
(t)
.
.
.
Activity
N
(t)
⎤
⎥
⎥
⎥
⎦
where each row represents a subject’s fitted activity
values. Finally, the functional error matrix is defined as
ε(t)=(ε
1
(t), ε
2
(t), ,ε
N
(t))
’
. Equation 8 in matrix notation
becomes,
Act(t)=Zβ(t)+ε(t).
(9)
The coefficients b(t) are estimated by minimizing a
least squares estimate
LMSSE(β)=
N
k=1
Act
k
(
t
)
− Z
k
β(t)
2
dt
(10)
where Z
k
is the k
th
row of the design matrix Z.
After we estimate
ˆ
β(t)
for b(t)infunctionlinear
regression, we also want to measure the accuracy of our
estimation result. We calculate the point-wise 95% con-
fidence limits for these effects using residuals from the
Figure 3 FLM result for 8 subjects. Plot (a) shows the 8 individual
circadian activity patterns with blue and red line for high and low
apnea groups, respectively. The overall mean circadian activity
pattern is the solid black line and the mean circadian activity
patterns for the high and low apnea groups are thick blue and red
line, respectively. Plot (b) shows F-test result the red solid curve
represents the observed statistic F(t) at each time point, the blue
dashed and dotted lines correspond to a global and point-wise test
of significance at significant level a = 0.05, respectively.
Wang et al. Journal of Circadian Rhythms 2011, 9:11
/>Page 5 of 10
model. This formulation is the same as the standard lin-
ear model except that instead of numeric coefficients we
are now estimating functional coefficients defined over
the 24 hour circadian period. A statistical test of the
null hypothesis that the circadian activity patterns are
the same in both groups is given by the function [12]:
F( t)=
Var[(Z
ˆ
β)
k
(t )]
1
N
N
k=1
(Act
k
(t ) − (Z
ˆ
β)
k
(t ))
2
(11)
where Z is the d esign matrix and
ˆ
β
is a vector of the
estimated regression coefficient functions.
Because of the nature of functional statistics, it is diffi-
cult to attempt to derive a theoretical null distribution
for any given test statistic. Instead, we applied a non-
parametr ic permutation test methodology. If there is no
relationship between activity pattern and apnea levels, it
should make no difference if we randomly rearrange the
apnea group assignment. The advantage of this is that
we no longer need to rel y on distributional assumptions
while the disadvantage is that we cannot test for the sig-
nificance of an individual covariate among many. The p
value of the test can then be calculated by counting the
proportion of permutation F values that are larger than
the F statistics for the observed pairing. Here we used
two different ways to counting the proportion: global
test and point-wise test. Global test provides a single
number which is the proportion of maximized F values
from each permutation. Point-wise test provid es a curve
which is the proportion of all permutat ion F values at
each time point.
Plot (b) i n Figure 3 provides a display for the statisti-
cal significance test for the differences in circadian activ-
itypatternscontinuouslyovertime.Thebluedashed
and dotted l ines correspond to a global and point-wise
test of significance at significant lev el a =0.05,respec-
tively, and the red solid curve represents the observed
statistic F(t) at each time point. When F(t) is above the
blue dashed or dotted line, it is concluded the two
apnea groups have significantly different mean circadian
activity patterns at those time points. The global critical
value (blue dashed line) is preferred since this represents
a more conservative t est. For these data, the two apnea
groups are statistic ally different in activity from approxi-
mately 7 AM - 9 PM.
The statistical and computational details for fitting
FLM models are well descr ibed elsewhere and are out-
side the scope of this paper. The reader interested in
these details are referred to Ramsay and Silverman [12].
This illustration was meant as an introduction to the
methodology only, and not an indicator of a clinical
conclusion. In the following section, these methods are
applied to the entire 395 subject dataset, and show how
apnea and BMI clinically impacts circadian activity
patterns.
3. Results
3.1 Demographic Information
Table 1 shows basic demographic informa tion and sam-
ple characteristics. Baseline covariates have been col-
lected from 395 participants (196 females), age ranging
from 18 to 80 years old. The average apnea score is 22.1
(standard deviation = 28.1) and avera ge BMI is 34.7
(standard deviation = 8.9). Clinically, BMI > 30 is used
to separate subjects into obese and non-obese cate-
gories. However, subjects in our database were recruited
from a sleep center and had higher BMI than found in
the general population, so we cannot generalize our
conclusions of t he impact of BMI on circadian activity
to the entire population.
Table 1 Demographic information and sample
characteristics
Variable N (%) Mean ± std
(N Total 395)
Female 196(49.87%)
Race African-American 134 (35.08%)
Caucasian 237 (62.04%)
Presenting Symptoms Snoring 279 (70.63%)
Gasping 93 (23.54%)
Morning headache 67 (16.96%)
RLS symptoms 26 (6.58%)
PLMS 3 (0.76%)
Witnessed apneas 146 (36.96%)
Insomnia 42 (10.63%)
Excessive day sleepiness 91 (23.04%)
Nonrestorative sleep 9 (2.28%)
Mallampati score Class 4 145 (41.55%)
Class 3 136 (38.97%)
Class 2 53 (15.19%)
Class 1 15 (4.30%)
Diagnosis Result OSA 292 (73.92%)
RLS 5 (1.27%)
Insomnia 8 (2.03%)
Hypersomnia 20 (5.06%)
BMI > 30 241 (60.86%)
BMI 34.66 ± 8.88
(Median = 34)
Age(years) 47.9 ± 14.8
apnea 22.11 ± 28.11
(Median = 12.95)
Wang et al. Journal of Circadian Rhythms 2011, 9:11
/>Page 6 of 10
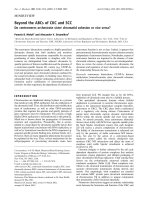
3.2 Smoothed Functional Actigraphy Data
Raw actigraphy data were read into the R statistical soft-
ware for analysis using the FDA package and software
written by our group to apply FLM methods. Two hun-
dred and eighty nine patients have actigraphy data. Each
patient’s data from midnight Monday through midnight
Friday were averaged and fit by a 9 basis Fourier expan-
sion and their circadian activity patterns plotted in Fig-
ure 4. The mean circadian activity pattern across all
subjects is shown by the red line. While general struc-
ture is visible (e.g., lower activity during sleep hours),
the overlap of these curves m akes clinically meaningful
interpretation difficult.
3.3. Functional Liner Model (FLM) Results
WeapplyFLMtomeasuretheimpactofapneaand
BMI on subject circadian activity patterns and test the
null hypothesis that circadian activity patterns are the
same regardless of apnea and BMI values. The alterna-
tive hypothesis is that apnea, BMI, and/or their interac-
tion effect activity behavior in a statistically significant
way. In addition to the tests of hypotheses, FLM pro-
vides a graphical view of the subgroup circadian activity
patterns that can aid interpretation of behavioral
differences.
To fit these models, each subject is categorized
according to their apnea and BMI values by:
AHI =
1ifAHI< Median of AHI
-1ifAHI≥ Median of AHI
BMI =
1ifBMI< 30
- 1 if BMI ≥ 30.
For the 295 subjects, 235 subjects had data on apnea
and actigraphy, 277 subjects had BMI and actigraphy,
and 232 subjects had apne a, BMI, and actigraphy. The
following analyses are based on these subsets.
We fit the following three functional linear models as
defined in Table 2. The first two m odels measure the
univariate impact of apnea (N = 235) and BMI (N =
277) separately, and the third model measures their
multivariate impact (N = 232). The models are pre-
sented in this order to go from a less to more compli-
cated analysis. Converting apnea and BMI into binary
categories was done for simplification but is not neces-
sary for functional linear modeling, and continuous
apnea, BMI, or other covariates could be used. At the
end, we show how BMI can be analyzed by FLM as a
continuous variable.
3.3.1 Apnea Main Effect Models
The impact of apnea as a main effect on circadian activ-
ity patterns was tested with Model 1, Table 2. The null
hypothesis is that the circadian actigraphy patterns are
the same in the two apnea groups. Of the 235 subjects
in this analysis, 118 have apnea less than the median
apnea = 10.8, and 117 patients have apnea larger than
or equal to 10.8.
Figure 5 presents the estimated group means with 95%
confi dence bands in pl ot (a). The low apnea group indi-
cating less disease sev erity (red solid line) has higher
activity during the day compared to the high apnea
group (blue solid line). The confidence bands around
the two group mean curves do not overlap during the
day suggesting the variability in the group circadian
activity patterns do not cross. The F-test in the plot (b)
indicates when these curves are statistically different
during the day. The F-test result shows that the two
apnea groups are significantly different from about 7
AM to 9 PM.
3.3.2. BMI main effect
Next, the impact of BMI as a main effect on circadian
activity patterns was measured using Model 2, Table 2.
The null hypothesis is that the circadian activity pat-
terns are the same in non-obese (BMI < 30) and obese
(BMI > = 30) groups. 182 patients are classified as obese
Figure 4 Smoothed Activity for individuals as black solid
curves and overall mean as red curves.
Table 2 Three Functional Linear Models
Model 1 apnea Main Effect Only Activity
k
(t)=b
0
(t)+b
AHI
(t) × AHI
k
+ ε
k
(t)
Model 2 BMI Main Effect Only Activity
k
(t)=b
0
(t)+b
BMI
(t) × BMI
k
+ ε
k
(t)
Model 3 apnea+BMI+interaction Activity
k
(t)=b
0
(t)+b
AHI
(t) × AHI
k
+ b
BMI
(t) × BMI
k
+b
AHI
×
BMI
(t) × AHI
k
× BMI
k
+ ε
k
(t)
Wang et al. Journal of Circadian Rhythms 2011, 9:11
/>Page 7 of 10
and 95 as non-obese. Figure 6 presents estimated group
means with 95% confid ence band and F-test result. The
high BMI group (blue solid line) has higher activity dur-
ing night and lower activity during daytime, but activity
patterns for the two groups are only significantly differ-
ent around 3 AM and 6 PM.
We emphasize that the po pulation of participants in
this study had a higher overall BMI compared to the
general population which may explain why the expected
difference in circadian activity patterns across these
groups was not observed.
3.3.3 Apnea and BMI effect, with interaction
Model 3, Table 2 was used to measure the impact of
apnea, BMI, and the apnea × BMI interaction term on
circadian activity patterns. The null hypothesis is that
the circadian activity patter ns measured are the same in
the four apnea × BMI groups versus the alternative that
apnea and/or BMI and/or their interaction impacts cir-
cadian activity patterns in a statistically significant way.
Table 3 shows the sample sizes for each group.
This interaction model has four functional coefficients
ˆ
β
o
(t ),
ˆ
β
AHI
(t),
ˆ
β
BMI
(t),
ˆ
β
AHI×BMI
(t)
which in combina-
tion define the four clinical groups (e.g., low BMI and
low apnea; low BMI and high apnea, etc). The four sub-
groups’ circadian activity can be estimated by adding or
subtracting the functional coefficients as shown in Table
4.
When a subject’s apnea or BMI is low, the functional
coefficient for that factor is added to the mean activity
pattern. When a subject’ sapneaorBMIishigh,the
functional coefficient for that factor is subtracted from
the mean activity pattern. The interaction coefficient is
added when apnea and BMI are concordant (high/high
orlow/low)andsubtractedwhenapneaandBMIare
discordant (low/high, high/low). Figure 7 shows the
activity curves for each of the four groups defined
according to their apnea/BMI status. The F-test shows a
significant difference among these four group activity
patterns between about 7 AM to 11 AM and 12:30 PM
to 8 PM.
Figure 5 FLM result for apnea main effect model.Plot(a)is
estimated activity patterns for two apnea groups and 95%
confidence band. Plot (b) is F-test result for this model.
Figure 6 FLMresultforBMImaineffectmodel.Plot(a)is
estimated activity patterns for two BMI groups and 95% confidence
band. Plot (b) is F-test result for this model.
Table 3 Sample size for apnea, BMI mode
apnea Low
(< 10.75)
apnea High
(> = 10.75)
Total
BMI > = 30 61 94 155
BMI < 30 55 22 77
Total 116 116 232
Table 4 Four group circadian activity result
apnea BMI Group Mean
Low Low
ˆ
β
o
(t )+
ˆ
β
AHI
(t) +
ˆ
β
BMI
(t) +
ˆ
β
AHI×BMI
(t)
Low High
ˆ
β
o
(t )+
ˆ
β
AHI
(t) −
ˆ
β
BMI
(t) −
ˆ
β
AHI×BMI
(t)
High Low
ˆ
β
o
(t ) −
ˆ
β
AHI
(t) +
ˆ
β
BMI
(t) −
ˆ
β
AHI×BMI
(t)
High High
ˆ
β
o
(t ) −
ˆ
β
AHI
(t) −
ˆ
β
BMI
(t) +
ˆ
β
AHI×BMI
(t)
Wang et al. Journal of Circadian Rhythms 2011, 9:11
/>Page 8 of 10
It is an established statistical practice in a linear
regression model to test the main effects of two covari-
ates and the effect of the interaction of the two covari-
ates. We extended this method to the functional linear
model. The comparisons of all 4 groups in this section
are actually the evaluation of the combination of the
main and inter action effects which should be consistent
with a 2-way ANOVA.
3.3.4 BMI as a Continuous Variable
As noted above, BMI showed little impact on circadian
activity patterns which does not correspond to general
clinical belief. This is most likely explained by the fact
that our subject population has high BMI relative to the
general population, so the distinction between obese
and non-obese was less pronounced. In this sectio n, we
fit a functional linear model treating BMI as a continu-
ous variable. BMI ranges from 17 to 67 in this dataset.
Figure 8 presents estimated means and F-test result. In
this plot, each color represents one BMI group. The lar-
gest BMI group has higher activity during night and
lower activity during daytime. BMI impact is significant
around 1 AM to 4 AM and 4 PM to 8 PM. It is noted
that the significantly different time periods are longer
than those obtained from categorized BMI effect model.
4. Discussion
Traditionally, actigraphy data is transformed into sum-
mary numbers, such as total sleep time, sleep efficiency,
wake after sleep onset, and other measurements. These
transformations allow data analysts to test hypothesis
using simple classical statistical methods. However, large
amount of information can be lost and problems of
masking circadian patterns may arise.
The merit of functional linear mod eling reli es in
determining when along the 24-hour scale gro ups differ.
Results from parameter tests in a cosinor approach
would provide information as to differences in harmonic
content between groups. Another advantage of the func-
tional linear modeling approach is exemplified in Figure
8, where BMI is used as a variable instead of comparing
groups with higher versus lower BMI values.
In this paper we have p resented a novel approach for
analyzing the full actigraphy data which we believe
avoids significant information loss and masking effect.
Representing actigraphy data as smooth continuous
functions, and applying Functional Linear Modeling
methods allowed us to directly compare and test differ-
ences of circadian activity patterns across apnea and
BMI subgroups. Other Functional Data Analysis meth-
ods using principal components analysis ( [15]; Zeitzer,
et al. ‘Phenotyping apathy in individuals with Alzhei-
mer’ s using functional principal component analysis’,
Revised and Resubmitted) for identifying sources of
variability within circadian activity patterns across s ub-
groups, and mixed effect models (Ding, et al., ‘ Func-
tional Linear Mixed Effects Model for Actigraphy Data ’,
In Preparation) for incorporating additional sources of
within subject v ariability are currently being developed
in our lab and applied to this type of data. Functional
linea r mixed models are also being developed in our lab
Figure 7 F LM result for apnea and BMI model.Plot(a)is
estimated activity patterns for the four groups and 95% confidence
band. Plot (b) is F-test result for this model.
Figure 8 FLM result for BMI model treating BMI as continuous.
Plot (a) is estimated activity patters for BMI groups. Plot (b) is F-test
result for this model.
Wang et al. Journal of Circadian Rhythms 2011, 9:11
/>Page 9 of 10
which will allow within-subject variability such as day-
to-day or pre-treatment to post-treatment differences in
activity to be analyzed.
Acknowledgements
We are particularly grateful to the editor and reviewers who have greatly
increased our knowledge of existing work in circadian rhyt hm data analysis.
This work was supported by R01 HL092347 “New Data Analysis Methods for
Actigraphy in Sleep Medicine” (Shannon, PI), the Washington University
Dept. of Medicine’s Biostatistics Center (Shannon, Director), and the Dept. of
Neurology Sleep Center (Duntley, Director)
Author details
1
Dept. of Medicine, Washington University School of Medicine, (660 South
Euclid Avenue), St. Louis, (63110), USA.
2
St.Louis VA Medical Center, Research
Service, (501 North Grand Ave), St. Louis, (63103), USA.
3
Dept. of Neurology,
Washington University School of Medicine, (212 N Kingshighway), St. Louis,
(63108), USA.
4
Dept. of Mathematics, Washington University, (One Brookings
Drive), St. Louis, (63130), USA.
Authors’ contributions
JW and HX carried out statistical analysis, contributed to development of
methodology and wrote sections of the manuscript. AL provided clinical
input and oversight. ED developed the clinical database, contributed to
statistical programming and reviewed the manuscript. JD developed
theoretical mathematical basis for the analysis and wrote section of the
manuscript. JM and CT acted as clinical coordinators, entered the data,
wrote sections and critically reviewed the manuscript. TL provided
programming and mathematical support and critically reviewed the
manuscript. SD is co-PI on the project, oversaw all clinical aspects of the
project, provided clinical theoretical perspectives and wrote sections of the
manuscript. WS was the PI on the project, developed statistical
methodology, oversaw the work of statisticians and programm ers, wrote
sections of the manuscript and critically reviewed all its contents. All authors
have read and approved the final manuscript.
Competing interests
The authors declare that they have no competing interests.
Received: 5 August 2011 Accepted: 13 October 2011
Published: 13 October 2011
References
1. Ancoli-Israel S, Cole R, Alessi C, Chambers M, Moorcroft W, Pollak CP: The
role of actigraphy in the study of sleep and circadian rhythms. Sleep
2003, 26:342-392.
2. Jean-Louis G, von Gizycki H, Zizi F, Fookson J, Spielman A, Nunes J,
Fullilove R, Taub H: Determination of sleep and wakefulness with the
actigraph data analysis software (ADAS). Sleep 1996, 19:739-743.
3. Blood ML, Sack RL, Percy DC, Pen JC: A comparison of sleep detection by
wrist actigraphy, behavioral response, and polysomnography. Sleep 1997,
20:388-395.
4. Kushida CA, Chang A, Gadkary C, Guilleminault C, Carrillo O, Dement WC:
Comparison of actigraphic, polysomnographic, and subjective
assessment of sleep parameters in sleep-disordered patients. Sleep Med
2001, 2:389-396.
5. Reid K, Dawson D: Correlation between wrist activity monitor and
electrophysiological measures of sleep in a simulated shiftwork
environment for younger and older subjects. Sleep 1999, 22:378-385.
6. Shinkoda H, Matsumoto K, Hamasaki J, Seo YJ, Park YM, Park KP: Evaluation
of human activities and sleep-wake identification using wrist actigraphy.
Psychiatry Clin Neurosci 1998, 52:157-159.
7. Satlin A, Teicher MH, Lieberman HR, Baldessarini RJ, Volicer L, Rheaume Y:
Circadian locomotor activity rhythms in Alzheimer’s disease.
Neuropsychopharmacology 1991, 5:115-126.
8. Mishima K, Hishikawa Y, Okawa M: Randomized, dim light controlled,
crossover test of morning bright light therapy for rest-activity rhythm
disorders in patients with vascular dementia and dementia of
Alzheimer’s type. Chronobiol Int 1998, 15:647-654.
9. Gruber R, Sadeh A, Raviv A: Instability of sleep patterns in children with
attention-deficit/hyperactivity disorder. J Am Acad Child Adolesc Psychiatry
2000, 39:495-501.
10. Van Someren EJ, Kessler A, Mirmiran M, Swaab DF: Indirect bright light
improves circadian rest-activity rhythm disturbances in demented
patients. Biol Psychiatry 1997, 41:955-963.
11. Pollak CP, Tryon WW, Nagaraja H, Dzwonczyk R: How accurately does wrist
actigraphy identify the states of sleep and wakefulness? Sleep 2001,
24:957-965.
12. Ramsey J, Silverman BW: Functional Data Analysis. second edition. New
York; 2005.
13. Refinetti R, Cornélissen G, Halberg F: Procedures for numerical analysis of
circadian rhythms. Biological Rhythm Research 2007, 38(4):275-325.
14. Shannon WD, Banks D: Combining classification trees using MLE. Stat Med
1999, 18:727-740.
15. Ding J, Symanzik J, Sharif A, Wang J, Duntley S, Shannon WD: Powerful
Actigraphy Data Through Functional Representation. Chance 2011.
doi:10.1186/1740-3391-9-11
Cite this article as: Wang et al.: Measuring the impact of apnea and
obesity on circadian activity patterns using functional linear modeling
of actigraphy data. Journal of Circadian Rhythms 2011 9:11.
Submit your next manuscript to BioMed Central
and take full advantage of:
• Convenient online submission
• Thorough peer review
• No space constraints or color figure charges
• Immediate publication on acceptance
• Inclusion in PubMed, CAS, Scopus and Google Scholar
• Research which is freely available for redistribution
Submit your manuscript at
www.biomedcentral.com/submit
Wang et al. Journal of Circadian Rhythms 2011, 9:11
/>Page 10 of 10