Báo cáo y học: "A base-calling algorithm for Tm-shifted melting curve SNP assa" ppsx
Bạn đang xem bản rút gọn của tài liệu. Xem và tải ngay bản đầy đủ của tài liệu tại đây (797.9 KB, 6 trang )
RESEARCH Open Access
A base-calling algorithm for Tm-shifted melting
curve SNP assay
Kung-Hao Liang
1*
, Jun-Jeng Fen
1,2
, Hsien-Hsun Chang
1,3
, Hsei-Wei Wang
2,4
and Yuchi Hwang
1
Abstract
Background: Tm-shifted melting curve SNP assays are a class of homogeneous, low-cost genotyping assays. Alleles
manifest themselves as signal peaks in the neighbourhood of theoretical allele-specific melting temperatures. Base
calling for these assays has mostly relied on unsupervised algorithm or human visual inspection to date. However,
a practical clinical test needs to handle one or few individual samples at a time. This could pose a challenge for
unsupervised algorithms which usually require a large number of samples to define alleles-representing signal
clusters on the fly.
Methods: We presented a supervised base-calling algorithm and software for Tm-shifted melting curve SNP assays.
The algorithm comprises a peak detection procedure and an ordinal regression model. The peak detection
procedure is required for building models as well as handling new samples. Ordinal regression is proposed
because signal intensities of alleles AA, AB, and BB usually follow an ordinal pattern with the heterozygous allele lie
between two distinct homozygous alleles. Coefficients of the ordinal regression model are first trained and then
used for base calling.
Results: A dataset of 12 SNPs of 44 unrelated persons was used for a demonstration purpose. The call rate is
99.6%. Among the base calls, 99.1% are identical to those made by the sequencing method. A small fraction of the
melting curve signals (0.4%) is declared as “no call” for further human inspection. A software was implemented
using the Java language, providing a graphical user interface for the visualization and handling of multiple melting
curve signals.
Conclusions: Tm-shifted melting curve SNP assays, together with the proposed base calling algorithm and
software, provide a practical solution for genetic tests on a clinical setting. The software is available in http://www.
bioinformatics.org/mcsnp/wiki/Main/Home Page
Background
Discoveries of associations between genetic variants and
clinical traits have improved our knowledge of human
in health and disease [1]. Most of these findings came
from research-phrase genome-wide association studies
(GWAS) of various common-complex diseases [2-5].
Once validated in independent cohorts, these associa-
tions can facilitate the development of genetic tests for
estimating personal disease risks. As GWAS gains popu-
larity among clinical scientists, genetic tests are antici-
pated to play an increasingly important role in
preventive and personalized healthcare systems.
Single nucleotide polymorphism (SNP) is an important
class of human genomic variants widely assayed on
GWAS. Current genetic tests are constructed on high-
density genome-wide assays [6] or low-cost, SNP-speci-
fic assays. The former aims to provide an extensive list
of disease reports, while the latter gives results pertain-
ing to a particular disease or a clinical trait.
A variety of assays h as been developed for genotyping
SNPs on the human DNA [7,8]. For research-phase pro-
jects, samples are usually collected in panels of many
reaction wells and analyzed using unsupervised base
calling algorithms. The entire panel is usually designated
for a particular SNP. The fluorescent intensity signal of
the entire panel is then clustered on-the-fly to make
calls (e.g. [5] and the Rotor-Gene ScreenClust HRM
Software). Al l t hree alleles of the SNP need to exist in
* Correspondence:
1
Vita Genomics Inc., Jungshing Road, Taipei County, 248 Taiwan
Full list of author information is available at the end of the article
Liang et al. Journal of Clinical Bioinformatics 2011, 1:3
/>JOURNAL OF
CLINICAL BIOINFORMATICS
© 2011 Liang et al; licensee BioMed Central Ltd. This is an Open Access article distributed under the terms of the Creative Commons
Attribution License (http: //creativecommons.org/licens es/by/2.0), whi ch permits unrestricted use, distribution, an d reproduction in
any medium, provided the original work is properly cited.
the panel to define clusters properly. For cases when
one allele type is rare, a larger pool of samples may b e
required to make t he rare allele well represented [8]. In
practice, many clinical labs received samples individu-
ally, each requiring the results to be delivered as soon as
possible. Consequently, it is more practical and cheaper
to run different assays (for different SNPs and/or differ-
ent persons) concurrently in the same panel. Different
SNPs may have diff erent SNP-specific fluorescent distri-
butions, prohibiting themselves to be clustered together.
Therefore, a supervised b ase calling algorithm may be
more adequate in a clinical setting. The S NP-specific
coefficients are pre-trained to facilitate the base call ing
of individual samples.
The melting curve SNP genotyping assay, ab breviated
as McSNP, is a class of simple, fast and relatively low-
cost assays [9-19]. Among them, the Tm-shifted meth-
ods employ allele-specific primers which are designed to
increase the melting temperature (Tm) difference
between two allele-specific PCR duplex [14,18,19]. They
are homogeneous assays where the entire process,
including amplification and detection, is performed in
solution within a single reaction well. Each allele mani-
fested diff erently at its particular Tm. The base calling
of Tm-shifted McSNP technology has r elied mostly on
unsupervised algorithm [18], user-specified cut-offs [16]
or human visual inspection to date. Hence, we were
motivated to propose a supervised base calling algo-
rithm, enabling the McSNP assay a practical genetic test.
Denote the two alleles of a haploid SNP as A and B
respectively. The goal of a base calling algorithm is to
identify whether the assayed diploid SNP is homozygous
AA (allele 1), heterozygous AB (allele 2), or homozygous
BB (allele 3). Signals of AA, AB and BB usually follow a
sequential order on a variety of assays including
McSNP. Hence, we proposed an algorithm which c om-
prises two procedures: (1) p eak detection; and (2) base
calling by an ordinal regression model. The peak detec-
tion procedure is required for both model training and
the actual base calling. We also proposed the use SNP-
specific offsets for adequate adjustments of the model to
accommodate SNP-specific signal strengths. Samples of
known alleles (determined by the conventional sequen-
cing method) were used to train the coefficients of the
algorithm, including the SNP-specific offsets and the
ordinal regression coefficients. The trained model can
then used for handling new coming samples.
Methods
The Tm-shifted McSNP assay
There are several variants of Tm-shifted McSNP assay
[14,18,19]. We followed the protocol in [14] for primer
design and experiment setting as an example. This
technique require s two forward primers an d one com-
mon reverse primer. The three primers form two primer
pairs, amplifying allele-specific PCR products containing
alleles A and B respectively. Reagents comprised SYBR
Green PCR Master Mix (Applied Biosystem #4309155)
(6 μL), two forward and one reverse SNP-specific pri-
mers (0.4 μM each), and the human genomic DNA
(20 ng). The total reaction volume was 10 μL.
The assay started with a PCR procedu re for DNA
amplification. This started f orm the pre-incubation at
95°C to activate the Taq DNA polymerase (10 mins),
followed by 50 cycles of thermal cycling comprising (1)
denaturation at 95°C (15s) and (2) primer annealing and
extension at 60°C (1 min). Afterwards, we continued the
dissociation of the DNA duplex by gradually increasing
the temperature up to 95°C at a temperature gradient of
0.2°C/min.
The Applied Biosystems ABI 7900HT instrument was
used. The fluorescent signal was captured by the accom-
panied SDS 2.2 software. The theoretical temperature
Tm was calculated using th e dnaMate server [20] where
a consensus melting temperatur e was calculated using
the nearest-neighbour model based on three indepen-
dent thermodynamic tables.
Signal processing and peak Detection
A disa ssociation curve, denoted as F(T),isthefluores-
cent intensity plot captured during a dissociation pro-
cess with increasin g temperature T . Define a melting
curve M as the negative first-derivative of the disassocia-
tion curves F [13], therefore
MdFdT= –/
Denote Tm(A) and Tm(B) as the t heoretical melting
temperatures of the PCR products, where Tm(A) <Tm
(B). Alleles manifest themselves as peaks on M occur-
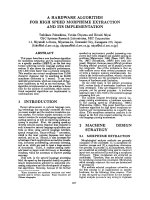
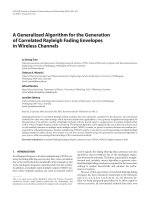
ring near Tm(A) and Tm(B). Figure 1 illustrates the typi-
cal melting curve signals of the three t ypes of alleles. A
single peak on M indicates a homozygous allele ( Figure
1a and 1c), while two peaks indicate a heterozygous
allele (Figure 1b). An optional Gaussian smo othing is
applied to M to suppress the small noisy fluctuations of
the signal while preserving the major bending curves o n
M.
The proximity of Tm(A) and Tm(B), d enoted as R(A)
and R(B) respectively, are the main t arget regions of
peak searching. This allows some degree of variation of
the real Tm from the theoretical Tm.
R 2* Tm A Tm B , Tm A + Tm B / 2
RTmATmB/2, 2*
A
B
=
()
×
() () ()
()
(
⎤
⎦
=
() ()
()
+ TTm B Tm A
()
×
()
(
⎤
⎦
Liang et al. Journal of Clinical Bioinformatics 2011, 1:3
/>Page 2 of 6
A derivative of the melting curve is then calculated
within R
A
and R
B
. A zero-crossing of the derivative either
represents a peak (convex) or a valley (concave) on the
melting curve. The peaks and valleys of a region are com-
pared based on their height to f ind the tallest peak. The
signal strengths of A and B alleles, denoted as D
A
and D
B
respectively, are the heights of the tallest peaks on R
A
and
R
B
, deducting the average height of the entire curve for
normalization purposes. D
A
or D
B
takes the value of zero
if no peak is detected in the corresponding region. If both
D
A
and D
B
are 0, then a “no call” is reported. Otherwise, a
variable x is introduced as the ratio of signal strengths:
x=D / D +D
BAB
()
The ordinal regression model for base calling
Thebasecallingmodelwasbuiltupontheordinal
regression method, taking advantage of the fact that sig-
nal patterns of AA, AB and BB usually follow a sequen-
tial order , with the heterozygous allele lie between two
distinct homozygous alleles. Alleles 1 (AA), 2 (AB) and
3 (BB) constitute the three ordered categories of the
response variable Z of the regression model. Our imple-
mentation has three model coefficientsa1, a2 and b.
Given the coefficients, the cumulative response probabil-
ities when Z={allele1}(denoted as P(Z ={1})) and Z=
{alleles 1,2} (denoted as P(Z ={ 1,2})), can be estimated
using the following equations.
logit P Z X
logit P Z X
=
()
()
=−
=
()
()
=−
{}
{}
11
1,2 2
The individual allele probability functions of alleles 2
and 3 can then be calculated by
PZ PZ PZ
PZ P
=
()
==
()
−=
()
=
()
=−
()
{} { } {}
{}
21,21
31 1,2
A probability margin rwas introduced. Bases are called
by the following rules:
If ((P(Z={2})-P(Z={1}))>r & (P(Z={2})-P(Z={3}))>r)
"Allele 2";
else if ((P(Z={3})-P(Z= {1}))>r &(P(Z={3})- P(Z={2} ))>r)
"Allele 3";
else if ((P(Z={1})-P(Z= {2}))>r &(P(Z={1})- P(Z={3} ))>r)
"Allele 1";
else “no call”
If the difference the top two probabilities is smaller
than r, then the base is called “no call” so as to trigger
a warming message for human inspection.
Figure 1 Typical melting curve plots of three alleles. (A) allele 1;
(B) allele 2; (C) allele 3. The horizontal axis represents the
temperature (T). The vertical axis is the fluorescent intensity
derivative (M) w.r.t. temperature. The major peaks of the curve occur
in the proximity of theoretical melting temperatures of the two
allele-specific PCR duplex.
Liang et al. Journal of Clinical Bioinformatics 2011, 1:3
/>Page 3 of 6
Results and Discussion
Determining coefficients
The algorithm was trained on 44 human samples for a
demonstration of t his algorithm. Samples were from
healthy Asian volunteers who has sign the inform con-
sent form. Each sample was genotyped on a set of
12 SNPs (Table 1), producing 528 melting curve plots in
total. The signal strength ratio x was calculated for each
plot (see Methods). These samples were also genotyped
by the conventional sequencing method, serving as the
expected calling results.
We aimed to obtain general c oefficients rather than
SNP specific coefficients to suit multiple SNPs. How-
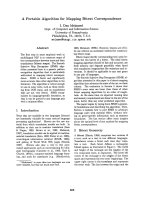
ever, variations of x do occur between different SNPs.
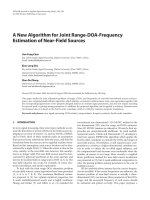
Figure 2 shows the averages of x for each allele o f t he
12 SNPs. To accommodate the variations of x,aSNP-
specific offset δ is introduced which is calculated as fol-
lows. First, we take grand means 〈x〉 of the SNP-spe-
cificaveragesacrossallthe12SNPsforalleles1,2
and 3. Second, δ’ s are calculated by the SNP-specific
averages of x minus the grand means 〈x〉.Wehoped
to maintain zero offsets for most SNPs, therefore, the
offsets were purposely kept in low resolution. They were
rounding off to one decimal digit. As a consequence, 8
SNPs have zero offsets; SNPs 6 and 8 have an offset of
0.1. SNPs 5 and 10 have an offset of -0.1.
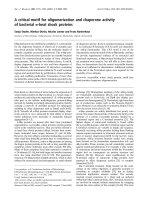
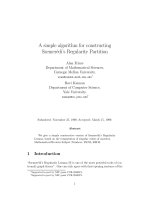
We further introduced the adjusted signal strength
ratio X, defined as X=x-δ. Compared with x,thedis-
tributions o f X of the 12 SNPs resemble each other
better (Figure 3). Hence, X is used for building the
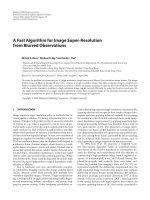
ordinal regression model. Based on all the 528 plots,
a1 = 15.3, a2 = 35.8, b = 51. The resulting allele prob-
ability functions P(Z = {1}), P(Z = {2}) and P(Z = {3})
are shown in Figure 4 which is the basis for subse-
quent base calling.
Table 1 List of SNPs
ID Gene Symbol SNP Allele (A/B)
SNP1 rs2241796 T/C
SNP2 TGFBRAP1 rs1866040 G/A
SNP3 rs2576737 A/G
SNP4 rs518604 C/T
SNP5 CASP5 rs2282658 C/G
SNP6 rs484345 A/G
SNP7 rs1699087 G/T
SNP8 ADAR rs903323 T/C
SNP9 IFI44 rs2070123 T/C
SNP10 rs305067 G/C
SNP11 ICSBP1 rs305088 A/G
SNP12 rs870614 G/A
These SNPs were assayed by both the sequencing and the McSNP methods
for the demonstr ation of propose d algorithm.
Figure 2 Allele-specific signal strength ratio (x) derived from
melting curves. Average x of alleles 1, 2 and 3 for each of the 12
SNPs.
Figure 3 Adjusted signal strength ratio (X). Average X of alleles
1, 2 and 3 for each of the 12 SNPs. SNPs 5, 6, 8 and 10 are offset
from x in Figure 2.
Figure 4 Allele probability functions. Allele probability, a function
of X, is given by the ordinal regression model. Green: allele 1. Red:
allele 2. Blue: allele 3.
Liang et al. Journal of Clinical Bioinformatics 2011, 1:3
/>Page 4 of 6
X and x is only different by an offsetδ which takes one
of three values, -0.1, 0 and 0.1. Referring to the ordinal
regression equation:
logit P Z X
x
x
=
()
()
=−
=− −
=−−
{}
()
(),
11
1
1
the three offsets effectively generates three different
models to accommodate the variation of signal strength
ratios of the 12 SNPs. The model with zero offsets may
have the widest use because i t is built upon a large por-
tion of the training dataset.
Base calling performance
The margin of probability r was set at 0.05 for the base
calling. The performance was summarized in Table 2.
Table 2 SNP-specific calling performance
SNP 1 SNP 2 SNP 3 SNP 4 SNP 5 SNP 6 SNP 7 SNP 8 SNP 9 SNP 10 SNP 11 SNP 12
No calls 000001100 0 0 0
# discordant calls 000014000 0 0 0
Concordance rate (%) 100 100 100 100 97.7 90.7 100 100 100 100 100 100
The number of no calls, discordant calls and the concordance rates between the proposed algorithm and the sequencing method
Table 3 Comparison of the discordant calls between
McSNP and sequencing
McSNP Sequencing X P(allele
1)
P(allele
2)
P(allele
3)
SNP5 allele 3
(CC)
allele 2 (CG) 0.73 0 0.19 0.81
SNP6 allele 3
(AA)
allele 2 (AG) 0.71 0 0.40 0.60
SNP6 allele 3
(AA)
allele 2 (AG) 0.72 0 0.28 0.72
SNP6 allele 3
(AA)
allele 2 (AG) 0.71 0 0.40 0.60
SNP6 No call allele 2 (AG) 0.70 0 0.52 0.48
SNP6 allele 3
(AA)
allele 2 (AG) 0.71 0 0.40 0.60
SNP7 No call allele 2 (GT) 0.70 0 0.52 0.48
Base calls, alle le signals (X) and their corresponding allele probabilities are
presented.
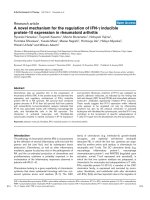
Figure 5 The graphical user interface of the software. The software was implemented in Java for providing a convenient interface for data
visualization and handling.
Liang et al. Journal of Clinical Bioinformatics 2011, 1:3
/>Page 5 of 6
The call rate is 99.6% because two SNPs are declared as
no calls. Among the 12 SNPs, 10 SNPs reached 100%
concordance rate, defined as the percentage of base calls
identical to those from the sequencing method. The
average concordance rate is 99.1%. For all the discordant
callings, base calls by the sequencing method were allele
2, while by McSNP were allele 3 (Table 3). This is
because the melting-curve signals on the first allele is
relatively weak, occasionally missing, thus the first alleles
are not easily detected by the base calling algorithm.
The software
A software was developed on the Java programming lan-
guage to implement the proposed algorithm and also
prov ide a user friendly graphical interface. The softwar e
can handle a fluorescent signal exports from SDS2.2 and
then calculate the signal strength ratio x. Given SNP-
specific offsets, theoretical melting temperatures and the
coefficients of the ordinal regression model, the software
can then make calls. The graphical user interface was
designed for the ease of signal visualization and manipu-
lation (Figure 5). The software is available in http://
www.bioinformatics.org/mcsnp/wiki/Main/HomePage.
Conclusions
The supervised base cal ling algorithm and software were
designed for the clinical use of Tm-shifted me lting curve
SNP genotyping assays. A supervised algorithm was
designed due to practical considerations of its clinical use.
An ordinal regression model was employed to capture the
sequential order of average allele signals. A set of general
coefficients were provided based on a demonstration data-
set. Clinicians can conduct the base calling using the gen-
eral coefficients, or carry out the coefficients training and
the subsequent base calling themselves
Although this algorithm was developed upon the Tm-
shifted McSNP data, it can be adapted for other McSNP
methods. Particularly, this line of technology is still evol-
ving and new improvements of the analytical chemistry
appear gradually. The proposed algorithm and training
strategy can also evolve accordingly. By the combination
of efficient base calling software and a small-scale human
inspection, a practical SNP tests can be established.
Author details
1
Vita Genomics Inc., Jungshing Road, Taipei County, 248 Taiwan.
2
Institute of
Biomedical Informatics, National Yang-Ming University, Linong Street, Taipei,
112 Taiwan.
3
Graduate Institute of Biomedical Materials and Engineering,
Taipei Medical University, Wu-Hsing Street, Taipei, 110 Taiwan.
4
Institute of
Microbiology and Immunology, National Yang-Ming University, Li-Nong
Street, Taipei, 112 Taiwan.
Authors’ contributions
KHL designed the algorithm, implemented the prototype of the core
algorithm and drafted the manuscript. JJF implemented the JAVA version of
the software with friendly graphical user interface. HHC conducted the
McSNP and sequencing experiments. HWW contributed on the study design
and data analysis. YCH conceived and coordinated the study. All authors
read and approved the final manuscript.
Competing interests
The authors declare that they have no competing interests.
Received: 14 July 2010 Accepted: 20 January 2011
Published: 20 January 2011
References
1. Hirschhorn JN: Genomewide association studies: Illuminating biologic
pathways. N Engl J Med 2009, 360(17):1699-1701.
2. Sladek R: A genome-wide association study identifies novel risk loci for
type 2 diabetes. Nature 2007, 445:881-885.
3. SLEGEN: Genome-wide association scan in women with systemic lupus
erythematosus identifies susceptibility variants in ITGAM, PXK, KIAA1542
and other loci. Nat Genet 2008, 40(2):204-210.
4. Thomas G: Multiple loci identified in a genome-wide association study of
prostate cancer. Nat Genet 2008, 40:310-315.
5. Wellcome Trust Case Control Consortium: Genome-wide association study
of 14000 cases of seven common diseases and 3000 shared controls.
Nature 2007, 447:661-678.
6. Fan JB, Chee MS, Gunderson KL: Highly parallel genomic assays. Nat Rev
Genet 2006, 7:632-644.
7. Shi MM: Enabling large-scale pharmacogenetic studies by high-
throughput mutation detection and genotyping technologies. Clin Chem
2001, 47:164-172.
8. Callegaro A, Spinelli R, B L, Bicciato S, Caristina L, Censuales S, De Bellis G,
Battaglia C: Algorithm for automatic genotype calling of single
nucleotide polymorphisms using the full course of TaqMan real-time
data. Nucleic Acids Res 2006, 34:e56.
9. Akey JM, Sosnoski D, Parra E, Dios S, Heister K, Su B, Bonilla C, Jin L,
Shriver MD: Melting curve analysis of SNPs (McSNP): a gel free and
inexpensive approach for SNP genotyping. BioTechniques 2001, 30:358-367.
10. Liew M, Pryor R, Palais R, Meadows C, Erall M, Lyon E, Wittwer C:
Genotyping of single-nucleotide polymorphisms by high-resolution
melting of small amplicons. Clin Chem 2004, 50(7):1156-1164.
11. Liew M, Nelson L, Margraf R, Mitchell S, Erall M, Mao R, Lyon E, Wittwer C:
Genotyping of human platelet antigens 1 to 6 and 15 by high
resolution amplicon melting and conventional hybridization probes.
J Mol Diag 2006, 8(1):97-103.
12. Lipsky RH, Mazzanti CM, Rudolph JG, Xu K, Vyas G, Bozak D: DNA melting
analysis for detection of single nucleotide polymorphisms. Clin Chem
2001, 47:635-644.
13. Herrmann MG, Durtschi JD, Bromley LK, Wittwer CT, Voelkerding KV: Amplicon
DNA melting analysis for Mutation Scanning and Genotyping: Cross-
Platform Comparison of Instruments and Dyes. Clin Chem 2006, 52:494-503.
14. Papp AC, Pinsonneault JK, Cooke G, Sadee W: Single nucleotide
polymorphism genotyping using allele-specific PCR and fluorescence
melting curves. BioTechniques 2003, 34(5):1067-1072.
15. Ririe KM, Rasmussen RP, Wittwer CT: Product differentiation by analysis of
DNA melting curves during the polymerase chain reaction.
Anal Biochem
1997, 245:154-160.
16. Ye J, Parra EJ, Sosnoski DM, Hiester K, Underhill PA, Shriver MD: Melting
curve SNP (McSNP) genotyping: a useful approach for diallelic
genotyping in forensic science. J Forensic Sci 2002, 47(3):593-600.
17. Zhou L, Wang L, Palais R, Pryor R, Wittwer CT: High-resolution DNA
melting analysis for simultaneous mutation scanning and genotyping in
solution. Clin Chem 2005, 51(10):1770-1777.
18. Wang J, Chuang K, Ahluwalia M, Patel S, Umblas N, Mirel D, Highchi R,
Germer S: High-throughput SNP genotyping by single-tube PCR with
Tm-shift primers. BioTechniques 2005, 39(6):885-893.
19. Germer S, Higuchi R: Single-tube genotyping without oligonucleotide
probes. Genome Res 1999, 9:72-78.
20. Panjkvoich A, Norambuena T, Melo F: dnaMATE: a consensus melting
temperature prediction server for short DNA sequences. Nucleic Acids Res
2005, 33:W570-W572.
doi:10.1186/2043-9113-1-3
Cite this article as: Liang et al.: A base-calling algorithm for Tm-shifted
melting curve SNP assay. Journal of Clinical Bioinformatics 2011 1:3.
Liang et al. Journal of Clinical Bioinformatics 2011, 1:3
/>Page 6 of 6