Báo cáo y học: "A filter-based feature selection approach for identifying potential biomarkers for lung cancer" pot
Bạn đang xem bản rút gọn của tài liệu. Xem và tải ngay bản đầy đủ của tài liệu tại đây (302.25 KB, 8 trang )
RESEARCH Open Access
A filter-based feature selection approach for
identifying potential biomarkers for lung cancer
In-Hee Lee, Gerald H Lushington
*
and Mahesh Visvanathan
*
Abstract
Background: Lung cancer is the leading cause of death from cancer in the world and its treatment is dependant
on the type and stage of cancer detected in the patient. Molecular biomarkers that can characterize the cancer
phenotype are thus a key tool in planning a therapeutic response. A common protocol for identifying such
biomarkers is to employ genomic microarray analysis to find genes that show differential expression according to
disease state or type. Data-mining techniques such as feature selection are often used to isolate, from among a
large manifold of genes with differential expression, those specific genes whose differential expression patterns are
of optimal value in phenotypic differentiation. One such technique, Biomarker Identifier (BMI), has been developed
to identify features with the ability to distinguish between two data groups of interest, which is thus highly
applicable for such studies.
Results: Microarray data with validated gene s was used to evaluate the utility of BMI in identifying markers for
lung cancer. This data set contains a set of 129 gene expression profiles from large-airway epithelial cells (60
samples from smokers with lung cancer and 69 from smokers without lung cancer) and 7 genes from this data
have been confirmed to be differentially expressed by quantitative PCR. Using this data set, BMI was compared
with various well-known feature selection methods and was found to be more successful than other methods in
finding useful genes to classify cancerous samples. Also it is evident that genes selected by BMI (given the same
number of genes and classification algorithms) showed better discriminative power than those from the original
study. After pathway analysis on the selected genes by BMI, we have been able to correlate the selected genes
with well-known cancer-related pathways.
Conclusions: Our results show that BMI can be used to analyze microarray data and to find useful genes for
classifying samples. Pathway analysis suggests that BMI is successful in identifying biomarker-quality cancer-related
genes from the data.
Background
Lung cancer accounts for large porti on of cancer deaths
(29%) in the United States for men as well as woman
[1]. The major types of lung cancer are small-cell and
non-small-cell cancer. Non-small-cell cancer can be
further divided into three histological subtypes: squa-
mous-cell carcinoma, adenocarcinoma and large cell
lung cancer [2]. Regardless of subtype, the 5-year survi-
val rate for lung cancer is among the lowest of all can-
cers at 15% (data for USA) [1]. Since the treatment of
lung cancer depends on the subtype and the stage of
cancer, it is important to have determined specific mole-
cular biomarkers that can identify the type of cancer as
a function of genes closely related to each distinct
phenotype.
With advance of microarray technologies, it is possible
to conduct high throughput determination of the rela-
tive rates with which genes are expressed in a given cell
or tissue type. This can help researchers better under-
stand a disease at the genomic level and h as become an
important tool in biological sciences as well as medical
and pharmaceutical research. In the context of lung can-
cer, microarray technology can be used to identify genes
whose expression profile in a type of cancer differs from
normal tissues or from other types of cancer. Such
biomarkers are important since they can provide the
basis for improving a diagnostic classifier or for enhan-
cing the prediction of patient-specific prognosis or
* Correspondence: ;
Bioinformatics Core Facility, University of Kansas, Lawrence, KS 66046 , USA
Lee et al. Journal of Clinical Bioinformatics 2011, 1:11
/>JOURNAL OF
CLINICAL BIOINFORMATICS
© 2011 Lee et al; licensee BioMed Central Ltd. This is an Open Access article distributed under the terms of the Creative Commons
Attribution License (http://creativecom mons.org/licenses/by/ 2.0), which permits unres tricted use, distribution, an d repro duction in
any medium, provided the original work is properl y cited.
therapeutic response [3]. From an informatics perspec-
tive, the process of selecting differentially expressed
genes is readily achieved via data- mining techniques
known as feature selection. Feature selection, an impor-
tant step in the data-mining process, aims to find repre-
sentativefeaturesubsetsthat meet desired criteria. In
microarray data analysis, one criterion for a desired fea-
ture subset would be a set of genes whose expression
patterns vary significantly when compared across differ-
ent sample groups. The resulting subset can then be
used to further analysis such as building a diagnostic
classifier.
Feature selection methods, in general, can be categor-
ized into three types, depending on how they are com-
bined with other analysis steps: filter methods, wrapper
methods and embedded methods [4]. Filter methods
assess the relevance of features as scores by looking only
at the properties of the data. Features can be sorted by
their scores and low-scoring f eatures can be removed.
Wrapper methods embed the analysis model within the
feature subset search. In this setup, a subset of features
is evaluated by applying a specific analysis model to
reduced data with the selected feature subset. In
embedded methods, the search for an optimal feature
subset is built into the analysis algorithm. Filter methods
are the most commonly applied in bioinformatics stu-
dies since they are computationally simple, fast and
independent of other analysis algorithms. Also they
allow features to be quantified and prioritized according
to the scores, which is particularly important for biologi-
cal interpretation.
In this paper, a filter-based feature selection method,
biomarker identifier (BMI), is adopted to analyze gene
expression data that might be used to discriminate
between samples with and without lung cancer. The
data consists of gene expression patterns in histologi-
cally normal large-airway epithelial cells obtained via
bronchoscopy from smokers. Genes identified using this
data set can be used to diagnosing lung cancer among
smokers with suspected lung cancer. The genes selec ted
by BMI were compared with those from various other
feature selection a lgorithms and those identified from
the original experimental study. Pathway analysis for the
genes selected by BMI was also performed.
Methods
Biomarker Identifier
The biomarker identifier (BMI) [5,6] method combines
various statistical measures to discern the ability of fea-
tures to distinguish between two data groups of interest.
It considers three measures for evaluating features. First,
it checks whether distribution of a feature is significantly
different between data groups. If the distribution of a
feature changes substantially, the feature might be
relevant to the underlying difference between data
groups. Second, the ratio of o verall variance relative to
variance in control group is used to measure the relia-
bility of a feature. For example, if the overall varianc e is
greater than that of control group, it means that the fea-
ture displays more noisy behavior in experiment group
making it less useful unless it also demonstrates a signif-
icant change between data group. On the other hand, an
overall variance smaller than that of control group
impl ies that the feature shows more consistent behavior
in the experiment group, making it a more useful fea-
ture provided that there exists a significant difference
between the contrasted data groups. For these reasons,
BMI penalizes or credits a score of a feature by the ratio
of overall variance relative to variance in control group.
Lastly, BMI considers the discriminative power of each
individual feature by incorporating the tru e positive rate
from logistic regression using the feature. In mathemati-
cal terms, let us assume a data set D consisting of two
groups ‘control (ctr)’ and ‘ experiment (exp)’ .BMI
assigns a score for a feature x defined as follows:
BMI(x)=λ · TP
2
|
diff
|
CV
ctr
CV
,
where
diff
=
, if ≥ 1
−
1
,otherwise
.
Here, l is a scaling factor and TP
2
is the product of
the t rue positive (TP) rates determined for each groups
using logistic regression of the form ‘outcome ~ feature’.
CV
ctr
and CV denote the coefficient of variance for the
feature x in the ‘ control’ group and in both groups,
respectively. Also, Δ =
¯
x
/
¯
x
ct
r
,where
¯
x
ctr
,and
¯
x
denote
the mean value of x in ‘ control’ and in both groups,
respectively. For biological data such as microarray, the
sign of Δ
diff
for a particular gene can be interpreted as
over-expression or under-expression in ‘experiment’
compared to ‘ control’ ; positive as over-expression and
negative as under-expression.
BMI has shown promising results on vari ous data sets
such as mass spectrometry data of metabolites [5], liver
disease [7] and microarray data from various types of
cancer [6]. In this study, it is used to identify potential
biomarkers for lung cancer from microarray data.
Other feature selection methods
For comparison with BMI, we used 6 different popular
feature selection methods: information gain (IG),
Relief-F (RF), t-test (T) and its two var iants (moder-
ated t-test (MT ) and window t-test (WT)), and chi-
squaredtest(CS).
Lee et al. Journal of Clinical Bioinformatics 2011, 1:11
/>Page 2 of 8
Information gain
Information gain (relative entropy, or Kullback-Leibler
divergence), in probability theory and information the-
ory, is a measure of the difference between two prob-
ability distributions. It evaluates a feature x by
measuring the amount of information gained with
respect to the clas s (or group) variable y, defined as fol-
lows:
I
(
x
)
= H
(
P
(
y
))
− H
(
P
(
y|x
)).
Specifically, it measures the difference between the
marginal distribution of observable y assuming that it is
independent of feature x (P(y)) and the conditional dis-
tribution of y assu ming that it is dependent of x (P(y|
x)). If x is not differentially expressed, y will be indepen-
dent of x,thusx will have small infor mation gain value,
and vice versa.
Relief-F
Relief-F [8] is an instance-based feature selection
method which evaluates a feature by how well its value
distinguishes samples that are from different groups but
are similar to each other. For each feature x, Relief-F
selects a random sample and k of its nearest neighbors
from the same class and each of different classes. Then
x is scored as the sum of weighted differences in differ-
ent classes and the same class. If x is differentially
expressed, it will show greater dif ferences for samples
from different classes, thus it will receive higher score
(or vice versa).
t-test and variants
The Student’s t-test [9] is traditionally used to compare
two normally distributed samples or populations. It pre-
fers features with a maximal difference of mean value
between groups and a minimal variability within each
group, but it can fail when there are small number of
samples or the estimated variances are not equal
between groups (heteroscedasticity): scenarios which are
common for practical data. To cope with such pro-
blems, Welch proposed a variant of t-test taking hetero-
scedasticity into account [10]. Various statistical tests
for differential expression are bas ed on the traditio nal
Student and Welch tests. Smyth [11] applied a hierarch-
ical Bayesian approach (moderated t-test) to the Student
and Welch tests and integrated more a priori informa-
tion to yield more robust estimates. B erger et al. [12]
suggested a window t-test that uses multiple genes
which share a similar expression level to compute the
variance to be incorporat ed in the t-test. In this work,
we chose Welch’s t-test, moderated t-test and window t-
test for comparison.
chi-squared test
Chi-squared test is another popular statistical test of the
divergence betwe en the observed and expected distribu-
tion of a feature. In feature selection, it tests whether
the distribution of a feature differs between groups. The
chi-square score uses t he summation of squared differ-
ences between observed and expected values divided by
expected values.
Experimental data
Spira et al. reported gene expression data from large air-
way epithelial cells by microarray analysis [13]. This data
set covers a set of 129 Affy metrix HG-U133A microar-
rays comparing 60 smokers with lung cancer and 69
smokers without lung cancer. This experiment was
designed to determine if g ene expression in histologi-
cally normal large-airway epithelial cells obtained via
bronchoscopy from smokers with suspect ed lung cancer
could be used as a lung cancer biomarker. In this data
set, 7 genes were confirmed to be differentially
expressed between cancerous samples and non-cancer-
ous samples by quan titative PCR [13]. The Robust Mul-
tichip Average (RMA) algorithm [14] was used for
background adjustment, normalization, and probe-level
summarization of the microarray samples (please refer
to supplementary methods of [13] f or detailed informa-
tion). The data set can be accessed from gene expres-
sion omnibus (GEO, />under accession number of GSE4115. This data set was
chosen since it consisted of a significant number of
replicates and some of the genes in the data set were
confirmed by quantitative PCR, which provides a good
basis for preliminary validation.
To contrast performance among feature selection
methods, we also used the dataset published through
MicroArray Quality Control project phase II (MAQC-
II). Amo ng 9 non-control data sets from MAQC-II, the
data set with the most balanced number of positive/
negative samples (breast cancer data with estrogen
receptor status as class) was chosen. The data set con-
sists of training (130 samples) and validation (100 sam-
ples) sets. The processed data was obtained through
GEO under accession number GSE20194.
Results and Discussion
Comparison with other feature selection methods
Feature selection methods can be evaluated in various
ways. One popular way is to observe the classification
performance using the features selected by the method.
If a feature selection method is able to choose truly sig-
nificant features, the classifier trained using those fea-
tures should show good p erformance with a small
number of features. I f important features are already
known, on the other hand, we can evaluate feature
selection methods by how they rank those known fea-
tures. Since important features have not been reported
for the MAQC-II data set, it can be approached only via
thefirstevaluationstrategy,buttheairwaydatasetis
Lee et al. Journal of Clinical Bioinformatics 2011, 1:11
/>Page 3 of 8
amenable to both modes of evaluation since some of
genes have been experimentally confirmed to be differ-
entially expressed.
Since a separate validation set is available within the
MAQC-II data, we used the training set for feature selec-
tion and validation set for classification. That is, feature
selection methods are first applied t o training set to
obtain feature subsets. Then, for each feature selection
method/classification algorithm pairing, classification
performances are evaluated on the validation set through
10-fold cross-validation with varying number of features
(from 1 to 60). AUC values (area under the curve; a pop-
ular measure for model comparison in machine learning
research interpreted as the probability that, given a ran-
domly picked positive example and negative example, the
classifier will assign a h igher score to the positive exam-
ple than to the negative one) have been used herein to
measure classification p erformance. Larger AUC values
imply more precise classification. For implementation,
we used Weka [15], a popular machine learning library
wri tten in Java, and the default setting was used for each
classification algorithm. Table 1 shows the maximum
AUC value ac hieved by each co mbination of feature
selection methods and classification algorithms for the
MAQC-II data set. We can see that the classifiers in
combination with BMI show performance levels compar-
able to others with relatively small number of features.
Also, the features selected by BMI show stable perfor-
mance regardless the classification algorithm.
For the airway data set, we applied a similar ten-fold
cross-validation approach as with the MAQC-II data to
compare classification performance of different feature
selection methods. Here, the data was divided into 10-
folds, whereby 9 folds are used for both selecting features
and training classifiers, and the reserved fold was used to
calculate AUC value of trained classifiers. For each combi-
nation of feature selection methods and classification algo-
rithms, this process was repeated 10 times with a different
reserved fold, while varying number of features (from 1 to
60) and the AUC values were averaged over the ten dis-
tinct reserved-fold cases. The parameter setting for each
classification algorithm was the same as in MAQC-II data
set. Table 2 shows the maximum AUC value achieved by
each combination of feature selection methods and classi-
fication algorithms. As in MAQC-II data set, the classifiers
in combination with BMI show comparable performance
with others with relatively small number of features. And
the features selected by BMI show stable performance
regardless the classification algorithm.
Next,fortheairwaydataset,weinvestigatedhowthe
genes confirmed in the literature (DUOX1, BACH2,
DCLRE1C, RAB1A, TPD52, FOS, and IL8) are ranked by
BMI compared to other feature selection methods. If
these genes are generally ranked highly, a feature
Table 1 Comparison of classification performances on MAQC-II data set
Classification Algorithms
Feature Selection Methods Support Vector Machine k-Nearest Neighbor Naive Bayes Random Forest
Information Gain 0.9031 (6) 0.9380 (25) 0.9008 (40) 0.9206 (50)
Chi-squared test 0.8821 (1) 0.9164 (50) 0.9151 (4) 0.9441 (60)
Relief-F 0.8821 (1) 0.9052 (15) 0.8995 (50) 0.9306 (60)
t-test 0.9067 (15) 0.9100 (20) 0.9042 (8) 0.9304 (40)
Window t-test 0.8903 (5) 0.9216 (5) 0.9012 (2) 0.9199 (10)
Moderated t-test 0.8903 (6) 0.9084 (5) 0.8987 (1) 0.9309 (50)
BMI 0.9077 (4) 0.9298 (15) 0.9164 (4) 0.9250 (9)
Each value represents the maximum AUC value (by 10-fold cross-validation) achieved by the corresponding feature selection method and classification algorithm.
The number of features used to achieve the maximum is shown inside parenthesis.
Table 2 Comparison of classification performances on airway data set
Classification Algorithms
Feature Selection Methods Support Vector Machine k-Nearest Neighbor Naive Bayes Random Forest
Information Gain 0.6853 (40) 0.8006 (4) 0.8297 (50) 0.8620 (60)
Chi-squared test 0.7052 (20) 0.8029 (60) 0.7997 (3) 0.8309 (50)
Relief-F 0.6633 (25) 0.7825 (9) 0.8329 (25) 0.8685 (60)
t-test 0.6902 (8) 0.7822 (4) 0.8402 (4) 0.8121 (8)
Window t-test 0.6856 (20) 0.7817 (30) 0.8367 (20) 0.8093 (40)
Moderated t-test 0.6878 (6) 0.7875 (5) 0.8329 (5) 0.8115 (20)
BMI 0.7572 (9) 0.8005 (5) 0.8299 (5) 0.8212 (10)
Each value represents the maximum AUC value (via 10-fold cross-validation) achieved by the corresponding feature selection method and classification
algorithm. The number of features used to achieve the maximum is shown inside parenthesis.
Lee et al. Journal of Clinical Bioinformatics 2011, 1:11
/>Page 4 of 8
selection method could be said to corroborate the given
data. As before, we divided the data into 10 folds and
used only 9 folds in feature selection, repeating the fea-
ture selection for each distinct reserved fold. For each of
these ten fold cases, we recorded gene ranks as deter-
mined by each method and calculated the median value
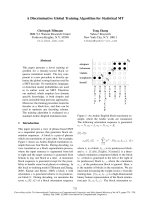
for each gene. Figure 1 shows median ranks of validated
genes by different feature selection methods, demonstrat-
ing that BMI ranks all of the confirmed genes within the
top 4000 ranked genes, and the overall BMI ranking of
confirmed genes is generally superior to other methods.
From these results, it can be said that BMI shows
competitive performance in identifying useful features
for classification and shows high consistency with actual
differential expression.
Comparison with biomarkers from literature
For the airway data set, we further compared the genes
selected by BMI and the biomarkers from original literature
[13]. In original literature, 80 features were selected to
distingu ish cancerous samples from normal samples. For
BMI, we chose 10 f eatures that were used to achieve t he best
classification performance in Table 2. The selected 10 fea-
tures a re shown in Table 3. Then we trained various popular
classification algorithms using these two sets of features:
naïve Bayes, support vector machine (SVM), neural n etwork,
k-nearest neighbor, and r andom forest. We used the i mple-
mentation in Weka software [15] with default settings.
Table 4 shows the detailed classification performanc es
obtained from 20 independent runs o f 10-fold cross-
validation. Classifiers trained using features selected by
BMI generally showed better performance for most clas-
sification algorithms. This implies that the features
selected by BMI are more useful for constructing accu-
rate classifiers, which can provide a good basis for
further screening of biomarkers.
Pathway analysis of selected biomarkers
Although a set of genes is useful for training classifier,
theconstituentgenesmaybeuselessasbiomarkersif
Figure 1 The median ranks of validated genes in airway data set by various feature selection methods.
Table 3 Top 10 genes selected by BMI
Probe ID Symbol Regulation Name
201694_s _at EGR1 Up early growth response 1
202056_at KPNA1 Up karyopherin alpha 1 (importin alpha 5)
203265_s_at MAP2K4 Up mitogen-activated protein kinase kinase 4
207283_at RPL23AP13 Down ribosomal protein L23a pseudogene 13
211612_s_at IL13RA1 Up interleukin 13 receptor, alpha 1
214261_s_at ADH6 Up alcohol dehydrogenase 6 (class V)
216609_at TXN Down Full length insert cDNA clone YI46D09
219233_s_at GSDMB Down gasdermin B
222339_x_at - Down -
34206 at ARAP1 Down ArfGAP with RhoGAP domain, ankyrin repeat and PH domain 1
Lee et al. Journal of Clinical Bioinformatics 2011, 1:11
/>Page 5 of 8
their biological roles are not related to the target disease
or process. Thus we analyzed the pathways associated
with 80 highly-ranked genes to investigate their biologi-
cal roles. For pathway analysis, we investigated asso-
ciated terms in KEGG pathways [16], NCI-Nature
pathway interaction databas e [17], and PANTHER (pro-
tein analysi s through evolutionary relationships) classifi-
cation system [18] using the EGAN program [19].
Tables 5 and 6 summarize the genes and their asso-
ciated pathways with significant p-values (< 0.05). We
can observe that there are some genes (EGR1, FOS,
DUSP10, and MAP2K4) associated with mitogen-acti-
vated protein kinase (MAPK) pathways, which is a well-
known target in the oncology drug discovery [20]. Also,
three genes (APC, MSH2, and ATF3) showed significant
association with a term f rom the NCI-Nature Pathway
Inter action Database, ‘Direct p53 effectors.’ This implies
that those genes are related with protein ‘p53’ which is
known as a tumor s uppressor protein [21]. We note
that incidence of the general KEGG annotation ‘path-
ways in ca ncer’ showed a good association (p-value of
0.0019) with our set of 80 genes. One also finds other
pathways related with known oncogenes such as c-Met
[22] and epidermal growth factor receptor (EGFR or
ErbB-1) [23] within our list. From these, it can be said
that genes highly ranked by BMI are generally relevant
to cancer development or diagnosis, thus BMI appears
to be useful for identifying potential biomarkers for lung
cancer.
Conclusions
In this work, a filter-based feature selection method,
biomarker identifier (BMI), has been applied to find
potential biomarkers for lung cancer from microarray
Table 4 Classification performances with selected biomarkers by BMI and original literature
Biomarkers by BMI Biomarkers from original literature
Classifier Specificity Sensitivity Accuracy Specificity Sensitivity Accuracy
Naïve Bayes 0.7938++ 0.7006++ 0.7489++ 0.7117 0.6644 0.6872
SVM 0.8134++ 0.7056++ 0.7615++ 0.6622 0.6593 0.6607
Neural Network 0.7242++ 0.6422 0.6848 0.6956 0.7459++ 0.7217++
k-Nearest Neighbor 0.8325++ 0.6144 0.7275++ 0.6378 0.6964++ 0.6682
Random Forest 0.7139++ 0.7328++ 0.7230++ 0.6872 0.6680 0.6773
++ and + denotes superior performance as determined at of 1% and 5% significance levels respectively.
Table 5 KEGG pathways and PANTHER classifications associated with top 80 genes selected by BMI
KEGG pathway name p-value Associated genes
Colorectal cancer 1.3809E-4 FOS, MSH2, APC
Pathways in cancer 0.0019 FOS, MSH2, APC, TCEB2
Metabolic pathways 0.0021 ADH6, SAT1, EXT2, TGDS, BTD, PRPS1, AGPS
Biotin metabolism 0.0032 BTD
MAPK signaling pathway 0.0094 DUSP10, MAP2K4, FOS
Cytokine-cytokine receptor interaction 0.0098 CXCR4, ACVR2A, IL13RA1
Toll-like receptor signaling pathway 0.0117 FOS, MAP2K4
Tight junction 0.0196 PPP2R2 D, INADL
Mismatch repair 0.0361 MSH2
Glycosaminoglycan biosynthesis - heparan sulfate 0.0408 EXT2
Pentose phosphate pathway 0.0423 PRPS1
Endocytosis 0.0428 ARAP1, CXCR4
PANTHER classification p-value Associated genes
Oxidative stress response 8.6417E-5 TXN, MAP2K4, DUSP10
O-antigen biosynthesis 0.0064 TGDS
T cell activation 0.0083 FOS, B2M
Interleukin signaling pathway 0.0108 IL13RA1, FOS
Apoptosis signaling pathway 0.0133 ATF3, FOS
FGF signaling pathway 0.0135 MAP2K4, PPP2R2D
Axon guidance mediated by Slit/Robo 0.0253 CXCR4
Hypoxia response via HIF activation 0.0408 TXN
Insulin/IGF pathway-mitogen activated protein kinase kinase/MAP kinase cascade 0.0484 FOS
Lee et al. Journal of Clinical Bioinformatics 2011, 1:11
/>Page 6 of 8
data. BMI measures the potential value of each gene as
a biomarker candidate by combining various statistical
measures to assess its ability to distinguish between two
data groups of interest. We evaluated BMI performance
on two public microarray data sets: one from the Micro-
Array Qu ality Control project and the other from smo-
kers with and without lung cancer. BMI was compared
with other popular filter-based feature selection methods
on both data set and showed competitive performance
in selecting useful features for various classification algo-
rithms. Since of the latter data set includes information
regardingspecificgeneswhosetissuedifferentiation
relevance has been vali dated by quantitative RT-PCR,
we also compared how these genes were ranked by dif-
ferent feature selec tion algorithm. The validated genes
generally were assigned higher ranks by BMI than by
other methods, implying that BMI should be effective in
identifying biomarkers that sho w differential expression
in cancerous samples. We also compared BMI with the
approach in the o riginal analysis conducted on the l ung
cancer microarray data [13] by contrasting the classifica-
tion performance using selected genes from each
Table 6 NCI-Nature pathway interactions associated with top 80 genes selected by BMI
NCI-Nature Pathway Interaction p-value Associated genes
ATF-2 transcription factor network 6.8276E-5 ATF3, FOS, DUSP10
Downstream signaling in naïve CD8+ T cells 1.8173E-4 B2 M, EGR1, FOS
Signaling events mediated by Hepatocyte Growth Factor Receptor (c-Met) 2.6255E-4 EGR1, MAP2K4, APC
Ephrin B reverse signaling 8.6116E-4 CXCR4, MAP2K4
ErbB1 downstream signaling 8.7013E-4 MAP2K4, FOS, EGR1
Regulation of p38-alpha and p38-beta 0.0011 DUSP10, MAP2K4
Direct p53 effectors 0.0013 APC, MSH2, ATF3
Trk receptor signaling mediated by the MAPK pathway 0.0014 EGR1, FOS
RhoA signaling pathway 0.0021 FOS, MAP2K4
IL6-mediated signaling events 0.0023 MAP2K4, FOS
Presenilin action in Notch and Wnt signaling 0.0024 FOS, APC
Calcineurin-regulated NFAT-dependent transcription in lymphocytes 0.0025 EGR1, FOS
Regulation of Androgen receptor activity 0.0027 EGR1, MAP2K4
Fc-epsilon receptor I signaling in mast cells 0.0041 FOS, MAP2K4
IL12-mediated signaling events 0.0045 B2 M, FOS
HIF-1-alpha transcription factor network 0.0052 FOS, CXCR4
CDC42 signaling events 0.0058 APC, MAP2K4
Regulation of nuclear SMAD2/3 signaling 0.0075 FOS, ATF3
Glucocorticoid receptor regulatory network 0.0077 FOS, EGR1
Sumoylation by RanBP2 regulates transcriptional repression 0.0174 RANBP2
JNK signaling in the CD4+ TCR pathway 0.0206 MAP2K4
Ras signaling in the CD4+ TCR pathway 0.0222 FOS
Hypoxic and oxygen homeostasis regulation of HIF-1-alpha 0.0284 TCEB2
Cellular roles of Anthrax toxin 0.0346 MAP2K4
VEGFR3 signaling in lymphatic endothelium 0.0361 MAP2K4
S1P2 pathway 0.0377 FOS
PDGFR-alpha signaling pathway 0.0377 FOS
ALK1 signaling events 0.0392 ACVR2A
Signaling events mediated by PRL 0.0392 EGR1
TRAIL signaling pathway 0.0438 MAP2K4
Regulation of CDC42 activity 0.0453 APC
S1P3 pathway 0.0453 CXCR4
CD40/CD40L signaling 0.0469 MAP2K4
Canonical Wnt signaling pathway 0.0469 APC
p38 MAPK signaling pathway 0.0469 TXN
Calcium signaling in the CD4+ TCR pathway 0.0484 FOS
Nongenotropic Androgen signaling 0.0484 FOS
Nephrin/Neph1 signaling in the kidney podocyte 0.0499 MAP2K4
IL12 signaling mediated by STAT4 0.0499 FOS
Lee et al. Journal of Clinical Bioinformatics 2011, 1:11
/>Page 7 of 8
method. Given models trained for various classification
algorithms, classifiers based on genes selected by BMI
showed better performance than those from original
study. Finally, in evaluating whether the genes selected
by BMI have known biological function related to (lung)
cancer, we analyzed their pathway disposition and found
that many genes were associated with known cancer-
related pathways. Thus we can conclude that BMI is a
suitable technique for phenotypic classification of micro-
array data and may provide a reasonable mechanism for
identifying viable diagnostic biomarker candidates.
Based on the results in this study, we are pursuing a fol-
low-up study using BMI to identify biomarkers suitable
for the lung cancer analysis with experimental data on
clinically derived tissues.
Acknowledgements
This publication was made possible by grant number P20 RR016475 from
the National Center for Research Resources (NCRR), a component of the
National Institutes of Health (NIH). We also would like to thank Drs. Michael
Netzer and Christian Baumgartner from University of Health Sciences,
Medical Informatics and Technology (UMIT), Austria in providing source
code for BMI implementation.
Authors’ contributions
IL participated in the design of the study, performed the statistical analysis
and drafted the manuscript. GL and MV conceived of the study, and
participated in its design and coordination. All authors read and approved
the final manuscript.
Competing interests
The authors declare that they have no competing interests.
Received: 8 October 2010 Accepted: 21 March 2011
Published: 21 March 2011
References
1. Jemal A, Siegel R, Ward E, Hao Y, Xu J, Murray T, Thun MJ: Cancer statistics.
CA Cancer J Clin 2008, 58:71-96.
2. Herbst RS, Heymach JV, Lippman SM: Lung cancer. New England Journal of
Medicine 2008, 359:1367-1380.
3. Granville CA, Dennis PA: An overview of lung cancer genomics and
proteomics. American Journal of Respiratory Cell and Molecular Biology 2005,
32:169-176.
4. Saeys Y, Inza I, Larrañaga P: A review of feature selection techniques in
bioinformatics. Bioinformatics 2007, 23:2507-2517.
5. Baumgartner C, Baumgartner D: Biomarker discovery, disease
classification, and similarity query processing on high-throughput MS/
MS data of inborn errors of metabolism. Journal of Biomolecular Screening
2006, 11:90-99.
6. Visvanathan M, Netzer M, Seger M, Adagarla BS, Baumgartner C,
Sittampalam S, Lushington GH: Oncogenes and pathway identification
using filter-based approaches between various carcinoma types in lung.
International Journal of Computational Biology and Drug Design 2009,
2:236-251.
7. Netzer M, Millonig G, Osl M, Pfeifer B, Praun S, Villinger J, Vogel W,
Baumgartner C: A new ensemble-based algorithm for identifying breath
gas marker candidates in liver disease using ion molecule reaction mass
spectrometry. Bioinformatics 2009, 25(7):941-947.
8. Kononenko I: Estimating attributes: analysis and extensions of RELIEF. In
ECML-94: Proceedings of the European conference on machine learning on
Machine Learning. Edited by: Bergadano F, De Raedt L. Springer Berlin/
Heidelberg; 1994:171-182.
9. Student: The probable error of a mean. Biometrika 1908, 6:1-25.
10. Welch BL: The significance of the difference between two means when
the population variances are unequal. Biometrika 1938, 29:350-362.
11. Smyth GK: Linear models and empirical Bayes methods for assessing
differential expression in microarray experiments. Statistical Applications
in Genetics and Molecular Biology 2004, 3:3.
12. Berger F, De Hertogh B, Pierre M, Gaigneaux A, Depiereux E: The “Window
t-test": a simple and powerful approach to detect differentially
expressed genes in microarray datasets. Central European Journal of
Biology 2008, 3:327-344.
13. Spira A, Beane JE, Shah V, Steiling K, Liu G, Schembri F, Gilman S,
Dumas YM, Calner P, Sebastiani P, Sridhar S, Beamis J, Lamb C, Anderson T,
Gerry N, Keane J, Lenburg ME, Brody JS: Airway epithelial gene expression
in the diagnostic evaluation of smokers with suspect lung cancer. Nature
Medicine 2007, 13:361-366.
14. Irizarry RA, Bolstad BM, Collin F, Cope LM, Hobbs B, Speed TP: Summaries
of Affymetrix GeneChip probe level data. Nucleic Acids Research 2003,
31:
e15.
15. Hall M, Frank E, Holmes G, Pfahringer B, Reutemann P, Witten IH: The
WEKA Data Mining Software: An Update. Explorations 2009, 11:10-18.
16. Kanehisa M, Goto S, Furumichi M, Tanabe M, Hirakawa M: KEGG for
representation and analysis of molecular networks involving diseases
and drugs. Nucleic Acids Research 2010, 38:D355-D360.
17. Schaefer CF, Anthony K, Krupa S, Bucho J, Day M, Hannay T, Buetow KH:
PID: the pathway interaction database. Nucleic Acids Research 2009, 37:
D674-D679.
18. Thomas PD, Campbell MJ, Kejariwal A, Mi H, Karlak B, Daverman R,
Diemer K, Muruganujan A, Narechania A: PANTHER: a library of protein
families and subfamilies indexed by function. Genome Research 2003,
13:2129-2141.
19. Paquette J, Tokuyasu T: EGAN: exploratory gene association networks.
Bioinformatics 2010, 26:285-286.
20. Sebolt-Leopold JS: Advances in the development of cancer therapeutics
directed against the RAS-mitogen-activated protein kinase pathway.
Clinical Cancer Research 2008, 14:3651-3656.
21. Hollstein M, Sidransky D, Vogelstein B, Harris CC: p53 mutations in human
cancers. Science 1991, 253:49-53.
22. Sattler M, Salgia R: c-Met and hepatocyte growth factor: Potential as
novel targets in cancer therapy. Current Oncology Reports 2007, 9:102-108.
23. Zhang H, Berezov A, Wang Q, Zhang G, Drebin J, Murali R, Greene MI: ErbB
receptors: from oncogenes to targeted cancer therapies. The Journal of
Clinical Investigation 2007, 117:2051-2058.
doi:10.1186/2043-9113-1-11
Cite this article as: Lee et al.: A filter-based feature selection approach
for identifying potential biomarkers for lung cancer. Journal of Clinical
Bioinformatics 2011 1:11.
Submit your next manuscript to BioMed Central
and take full advantage of:
• Convenient online submission
• Thorough peer review
• No space constraints or color figure charges
• Immediate publication on acceptance
• Inclusion in PubMed, CAS, Scopus and Google Scholar
• Research which is freely available for redistribution
Submit your manuscript at
www.biomedcentral.com/submit
Lee et al. Journal of Clinical Bioinformatics 2011, 1:11
/>Page 8 of 8