Báo cáo y học: " Dynamic gene network reconstruction from gene expression data in mice after influenza A (H1N1) infection." ppsx
Bạn đang xem bản rút gọn của tài liệu. Xem và tải ngay bản đầy đủ của tài liệu tại đây (705.47 KB, 13 trang )
METH O D O LOG Y Open Access
Dynamic gene network reconstruction from gene
expression data in mice after influenza A (H1N1)
infection
Konstantina Dimitrakopoulou
1
, Charalampos Tsimpouris
2
, George Papadopoulos
2
, Claudia Pommerenke
3
,
Esther Wilk
3
, Kyriakos N Sgarbas
2
, Klaus Schughart
3,4
and Anastasios Bezerianos
1*
Abstract
Background: The immune response to viral infection is a temporal process, represented by a dynamic and
complex network of gene and protein interactions. Here, we present a reverse engineering strategy aimed at
capturing the temporal evolution of the underlying Gene Regulatory Networks (GRN). The proposed approach will
be an enabling step towards comprehending the dynamic behavior of gene regulation circuitry and mapping the
network structure transitions in response to pathogen stimuli.
Results: We applied the Time Varying Dynamic Bayesian Network (TV-DBN) method for reconstructing the gene
regulatory interactions based on time series gene expression data for the mouse C57BL/6J inbred strain after
infection with influenza A H1N1 (PR8) virus. Initially, 3500 differentially expressed genes were clustered with the use
of k-means algorithm. Next, the successive in time GRNs were built over the expression profiles of cluster centroids.
Finally, the identified GRNs were examined with several topological metrics and available protein-protein and
protein-DNA interaction data, transcription factor and KEGG pathway data.
Conclusions: Our results elucidate the potential of TV-DBN approach in providing valuable insights into the
temporal rewiring of the lung transcriptome in response to H1N1 virus.
Keywords: Gene Regulatory Network, Time Varying Dynamic Bayesian Network, Immune System, Influenza A
Background
It is now well established that the study of biological com-
plexity has shifted from gene level to interaction networks
and this shift from components to associated interactions
has gained increasing interest in network biology. Gene
Regulatory Networks (GRNs) depict the functioning circui-
try in organisms at the gene level and represent an
abstract mapping of the more complicated biochemical
network which includes other components such as pro-
teins, metabolites, etc. Understanding GRNs can provide
new ideas for treating complex diseases and offer novel
candidate drug targets. A commonly accepted top-down
approach is to reverse engineer GRNs from experimental
data generated by microarray technology [1-5].
Early computational approaches for inferring GRNs
from gene expression data employed classical methods.
Boolean network modeling considers the gene expression
to be in a binary state (either switched on or off), and dis-
play via a Boolean function the impact of other genes on a
specific target gene [6]. Nevertheless, t he intermediate
levels of gene expression are neglected, thus resulting in
information loss. Moving forward, Bayesian networks (BN)
utilize probabi lity calcul us and graph theory and model
GRNs as directed acyclic graphs where the nodes repre-
sent genes and the edges between nodes represent regula-
tory interactions, based on the conditional dependencies
extracted from the data. Despite their ability to deal with
noisy input, they ignore the temporal dynamic aspects that
characterize GRN modeling [7]. To cope with that, the
Dynamic Bayesian Networks (DBN) evolved feedback
loops to incorporate the temporal aspects of regulatory
networks; however the computational cost for estimating
* Correspondence:
1
School of Medicine, University of Patras, Patras 26500, Greece
Full list of author information is available at the end of the article
Dimitrakopoulou et al. Journal of Clinical Bioinformatics 2011, 1:27
/>JOURNAL OF
CLINICAL BIOINFORMATICS
© 2011 Dimitrakopoulou et al; licensee BioMed Central Ltd. Thi s is an Open Access article distribut ed under the terms of the Creative
Commons Attribution License (http ://creativecommons.org/lic enses/by/2.0), which permi ts unrestricted use, distribution, and
reproduction in any medium, provided the original work is properly cited.
the conditional dependencies remains high when the num-
ber of genes is large [8,9]. Also, linear additive regulation
models managed to identify certain linear relations in reg-
ulatory systems but failed to att ribute the nonlinear
dynamics features [10].
Recently, several techniques have been developed for
the mathematical modeling of the dynamics of gene-gene
interactions from time series expression data, such as dif-
ferential equation based models [11-14], state space mod-
els [15,16], vector autoregressive (VAR) models [17,18]
and information theoretic models [19]. However, the
resulting network structures are static, with time-invar-
iant topology among the defined set of nodes. Therefore,
these network structures can be c haracterized ‘dynamic’
only in the sense that they model dynamical systems. It
still remains a challenging task to model in a quantitative
manner the dynamic character of biological networks,
which in turn appear, based on the latest studies, not to
be static networks with invariant topology but are rather
context-dependent and systematica lly rewired over time.
These time or context dependent functional circuitries
are referred as time varying biological networks [20-26].
Our study focuses on depicting th e temporal dynamics
of the lung transcriptome after perturbation of the biologi-
cal system by an infection with influenza A virus. Intensive
research has already been performed in analyzing the viral
virulence factors and genetic host factors contributing to
disease developmen t and outcome [27-31]. The innate
immune response system is the first line of defense against
pathogens and more fast acting in comparison to adaptive
immune response. However, little knowledge exists about
the influence of specific genes or gene interactions that
contribute to the susceptibility or resistance to influenza
infections. Our effort was to provide the directed time
evolving network structures underlying the innate immune
regulatory mechanism, with tem poral resolution up to
every single time point based on the time series measure-
ments of the nodal state. Our goal was to provide evidence
that the immune respons e mechanism un dergoes signifi-
cant ‘tuning’ during the first 5 days after pathogen invasion
and present these shifts through serial snapshots, each one
depicting the evolutionary steps of gene interplay. In our
approach we applied the Time Varying Dynamic Bayesian
Networks (TV-DBNs) on a time series microarray dataset
obtained from the lungs of C57BL/6J mice infected with a
mouse-adapted influenza A (H1N1) virus. It has already
been shown, that time varying network approaches
like TV-DBNs [26] have provided valuable insights in
depicting the transitional changes in yeast cell cycle or stu-
dies like Song et al. [32] that successfully exhibited the
stages of developmental cycle of D. melanogaster.The
TV-DBNs offer t he ability to overcome limitations of
other approaches like the structure learning algorithms for
Dynamic Bayesian networks [7], t hat depict dynamic
systems with fixed node dependencies or other approaches
like [33], where a st atic netw ork is constructed as a start
point and then time dependencies are detected.
One important aspect of our research was to bring
together clustering and inferring networks from time
series data. From the computational point of view, the
number of estimated relationships in the network is signif-
icantly reduced by defi ning relationships on clust er level
[34-36], thus network inference becomes more feasible.
Also, recent studies have characterized biological networks
as modular, with modules defined as groups of genes, pro-
teins or other molecules participating in common subcel-
lular processes [37,38]. Based on that concept, clusters of
co-regulated genes can also be considered as abstractions
of modules, since the underlying idea is that co-regulated
genes are usually functionally associated. In our approach,
we aim at defi ning relationships between clusters , rath er
than gene-to-gene relationships, which in turn can be
regarded as special cases of clusters (i.e. with each gene
defining its own cluster).
Summarizing, the present reverse engineering approach
consists of four steps: (1) data selection, (2) clustering for
obtaining centroids, (3) parameter tuning and generation
of Time Varying Dynamic Bayesian Networks based on
the time series experimental expression profiles of cluster
centroids and (4) evaluation of the resulting networks
with respect to topological measures as well as with avail-
able biological knowledge.
Methods
Data
C57BL/6J mice were infected with a mouse-adapted
influenza A virus (PR8), RNA was prepared from whole
lungs and processed for hybridization on Agilent 4 × 44
k arrays. Three replicates, fro m three i ndividually
infected mice, were taken for each time point after infec-
tion(1,2,3,4,5days)andfromthreemock-infected
mice (day 0) (Pommerenke C et al.: Global transcriptome
analysis in influenza-infected mouse lungs reveals the
kinetics of innate immune responses, infiltrating T cells,
and formation of tertiary lymphoid tissues, submitted).
All experiments in mice were approved by an external
committee and according to the natio nal guidelines of
the animal welfare law in Germany (’Tierschutzgesetz in
der Fassung der Bekanntmachung vom 18. Mai 2006
(BGBl.IS.1206,1313),daszuletztdurchArtikel20des
Gesetzes vom 9 . Dezember 2010 (BGBl. I S. 1934) geän-
dert worden ist.’ ). The protocol used in these experi-
ments has been reviewed by an ethics committee and
approved by the ‘Niedersächsiches Landesamt für Ver-
braucherschutz und Lebensmittelsicherheit, Oldenburg,
Germany’ , according to t he German animal welfare law
(Permit Number: 33.9.42502-04-051/09). Preprocessing
steps of the raw data comprised background correction
Dimitrakopoulou et al. Journal of Clinical Bioinformatics 2011, 1:27
/>Page 2 of 13
[39], quantile normalization, probe summarization, and
log2 transformation using the R environment and addi-
tional packages from Bioconductor [40].
Subsequently, we used the GEDI toolbox [41] in order
to identify the differentially expressed gene probes and
after applying t-test with p-value < 0.05 (FDR adjusted),
3500 genes were mai ntained. We examined our gene list
with the use of Database for Annotation, Visualization,
and Integrated Discovery (DAVID) functional annotation
tool [42] for over-represented biological process Gene
Ontology terms (results shown in Table 1).
Clustering
Clustering and gene network inference methods are
usually developed independently. However, it is widely
accepted that deep relationships exist between the two
and their implementation in a unified manner overcomes
the limitations posed by each method. A challenging task
in gene network reconstruction is tha t the number of
genes is so large; hence network modeling based on a
limited amount of data becomes too complex. The gen-
eral opinion is that the amount of data required for GRN
modeling increases approximately logarithmically with
the number of genes [43]. However, it is difficult to spe-
cify the experimental data requirements more precisely
since many more factors influence the network inference
performance. Also, the quality of an infer red model
depends on the quality of the given data; the number of
time points (in case of time series data), the observation
duration and the interval between subsequent measure-
ments might lead to less informative data and thus ham-
per a reliable GRN reconstructio n. In order to overcome
the limitations posed by the large number of genes, some
types of dimension ality reduction of the network are
necessary. Based on the fact that genes with similar
expression profiles are considered to be co-regulated,
reconstructing networks at cluster l evel is a realistic and
statistically advantageous approach, since the dimensions
of the cluster-based networks become significantly lower.
From a system theoretic perspective, c oarse graining
of expression profiles means removing redundant infor-
mation. Therefore, one reasonable approach is to group
genes into clusters by means of a clustering technique
and then use the cluster centroids or cluster representa-
tives as input for subsequent modeling [34]. Nevertheless,
it should be noted that clustering results are often char-
acterized as ambiguous, since they depend on the cluster-
ing method, the selecti on of dist ance m etric and
initialization parameters. In our study, we chose to clus-
ter the temporal profiles with the use of k-means algo-
rithm due to its simplicity and fast speed in processing
large datasets. The clustering process was repeated more
than 100 times using random initialization, with Eucli-
dean metric as distance measure. We implemented t he
Euclidean distance as a similarity measure, in order to
detect similar e xpression trends (positive linear correla-
tion) i.e. simultaneous up or down regulated expression
levels. From the biological perspective, it is considered
more important to identify the relative up/down regula-
tion of expression profiles than the amplitude absolute
expression changes [44]. Furthermore, the optimal num-
ber of clusters was appointed both by means of the Dunn
index [45] as well as by GO enrichment analysis. There-
fore, the obtained cluster centroids can be rightfully
employed as input in the TV-DBN algorithm.
In particular, we applied k-means clustering algorithm
at the data with the cluster number ranging between 10
and 80. We selected this range, so that the resulting
cluster number is both indicative enough of the size of
our dataset as well not so l arge, avoiding so over-fitting
that leads to poor predictive power. We employed Dunn
index, a performance measure used for comparing dif-
ferent clustering results, in order to check the range of
cluster number that gives dense and well separated clus-
ters. This index is defined as the ratio between the mini-
mal inter-cluster distance to maximal intra-cluster
distance. As intra-cluster distance the sum of all dis-
tances to their respective centroid was calculated, while
the inter-cluster distance was defined as the distance
between centroids. According to the internal criterion of
the index, clusters with high intra-cluster similarity and
low inter-cluster similarity are more desirable. The max-
imal Dunn index score values were observed between
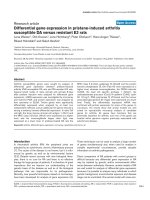
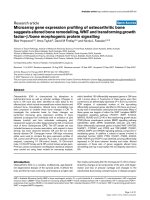
19-36 clusters as can be seen in Figure 1. However, the
final number of cluster s was estimated after examining
the clusters, assessed from the best clustering result in
terms of maximal Dunn index scores, with regard to
Gene Ontology biological process terms, so that the
obtained clusters are biologically sensible and function-
ally coherent. In detail, we analyzed our clusters, with
Table 1 GO enrichment analysis
GO Biological Process Term Percentage
(%)
P-Value
GO:0002376:immune system process 7.5 7.45E-31
GO:0050896:response to stimulus 15.2 1.83E-11
GO:0009987:cellular process 48 1.22E-06
GO:0051704:multi-organism process 2.7 1.54E-06
GO:0016265:death 3.2 0.001708142
GO:0040011:locomotion 2.3 0.005231518
GO:0008152:metabolic process 35.4 0.036706589
GO:0016043:cellular component
organization
10 0.037186976
GO:0032502:developmental process 14.2 0.061325344
Biological Process GO enrichment analysis of the 3500 genes included in our
dataset. The analysis was implemented with DAVID Bioinformatics Resources
functional annotation tool. 1429 out of the 3500 genes are not yet
characterized with regard to biological process GO terms.
Dimitrakopoulou et al. Journal of Clinical Bioinformatics 2011, 1:27
/>Page 3 of 13
the use of DAVID functional annotation too l at level 3,
for enriched GO terms, the percentage of genes related
to that term and the corresponding EASE score, which
is a modified Fisher Exact p-value and concluded that
35 clusters was the optimal number (the gene members
of every cluster are displayed in additional file 1). We
chose to check clusters at level-3 in order to avoid the
impact of the broadest terms or the most specific ones
on the enrichment a nalysis. It is worth mentioning that
the majority of our genes (1429 genes) are not yet fully
characteri zed by GO terms, thus our clusters leave
space for further exploration. Therefore, we character-
ized our clusters based on the rest genes, fully described
in terms of GO terms (additional file 2). We found that
13 clusters are characterized by terms associated to
immune response, whereas the rest are mainly involved
in metabolic process and system development.
Time Varying Dynamic Bayesian Network Modeling
A Time Varying Dynamic Bayesian Network (TV-DBN)
is a model of stochastic temporal processes based on
Bayesian networks [26]. It represents relations between
the state of a variable at one time point and the states
of a set of variables at previous time points.
Given a set of time series in the form of
X
t
:= (X
t
1
, , X
t
p
)
T
∈ R
p
where t isatimeinthetimeseries,X
t
is a v ector of the
values of p variables at time t, a TV-DBN models relations
as:
X
t
= A
t
· X
t−1
where A
t
Î R
p × p
is a matrix of coefficients that relate
the values at t-1 to t hose of time t. The non-zero ele-
ments of A
t
form the edge set of the network for time t.
In our experiments, each cluster was a variable of the
model and its centroid gave the time series values. Thus,
the resulting networks relate the expression levels of all
clusters at previous time point to the expression levels of
each cluster at each time point. In order to calculate the
network structures, it is assumed that they are sparse and
vary smoothly across time; therefo re successive networks
are likely to share common edges. The problem of esti-
mating the networks is decompo sed into smaller, atomic
optimizations, one for each node i (i = 1 p) at each time
point t* (t* = 1 T):
ˆ
A
t
∗
i.
= arg min
A
t
∗
i.
∈R
1×n
1
T
T
t=1
w
t∗
(t)(x
t
i
− A
t
∗
i.
x
t-1
)
2
+ λ A
t
∗
i.
1
where l is a parameter for the ℓ
1
-regularization term,
which controls the number of non-zero entries in the
estimated
ˆ
A
t∗
i·
, and hence the sparsity of the networks;
w
t∗
(t )
is the weighting of an observation from time t
Figure 1 Dunn Index results. Boxplot with Dunn Index results for k-means clustering. The x-axis represents the cluster number, while the y-axis
represents the Dunn’s cluster validity index scores. The experiment was repeated 100 times and the maximal Dunn Index score values were
observed in the range of 19-36 cluster size.
Dimitrakopoulou et al. Journal of Clinical Bioinformatics 2011, 1:27
/>Page 4 of 13
when estimating the network at time t*, and is defined
as:
w
t∗
(t )=
K
h
(t − t∗)
T
t=1
K
h
(t − t∗)
where:
K
h
(t ) = exp(−
t
2
h
)
is a Gaussian RBF kernel function and h is the kernel
bandwidth. The above optimization is transformed
further by scaling the covariates and response variables
by
w
t∗
(t )
i.e.
˜
x
t
i
←
w
t∗
(t ) x
t
i
and
˜
x
t−1
←
w
t∗
(t ) x
t−1
The optimization is then solved using the shooting
algorithm [46], which iterat ively updates one entry of A
i
while holding all other entries fixed. The kernel band-
width h affects the contribution of temporally distant
observations. A high value results in all observations con-
tributing equally to each time point, while a small value
narrows the effect to only the imme diately previous time
point. For our e xperiments, we selected h so that the
weighting of observations 2 days away from each time
point is higher than exp(-1).
K
h
(2) = exp(−
2
2
h
) > exp(−1)
The ℓ
1
-regularization term l affects the sparsity of the
resulting networks and controls the tradeoff between
the data fitting and the model complexity. In ord er to
set the appropriate value to l, we employed the Baye-
sian Information Criterion (BIC) [32] and the largest
BIC score value was detected when l was set to 0.1. An
implementation of the estimation algorithm was created
in Python programming language, using the NumPy and
Scipy libraries.
Results and Disc ussion
The current study propo ses a systems biology approach
to analyze the dynamic behavior of the lung transcrip-
tome to H1N1 infection from stimulus-response data
from perturbation experiments. This system can be
regarded as a specific stimulus-induced perturbed biolo-
gical system. In particular, we present an implementation
of Time Varying Dynamic Bayesian Networks on time
series gene expression data of murine C57BL/6J inbred
strain after infection with H1N1 (PR8) virus. Our reverse
engineering approach combines clustering techniques
and network inference methods, in order to map the
dynamicgeneregulatorykinshipsoccurringatvarious
time points after infection, thus displaying the response
of the l ung transcriptome after an environmental stimu-
lus. However, the low time resolution of data imposed
significant constraints in analysis and modeling. There-
fore, we permuted our analysis by defining the regulatory
effects on cluster level in order to achieve some kind of
dimensionality reduction. The resulting five TV-DBNs,
each one representing the GRN at a specific time point
(day p.i.), were evaluated with topological metrics as well
as with available intera ctome data. Also, we checked
whether known gene-to-gene relationships could be
retrieved from our cluster based approach.
Topological analysis of Regulatory Networks
The first goal in our analysis was to explore the topologi-
cal characteristics of the five TV-DBNs. Thus, we con-
ducted local t opology analysis in order to identify hub or
bottleneck clusters/nodes that could serve as the key regu-
lators at every time point. For this purpose we used
Hubba server [47] and calculated several network topology
metr ics such as degree (D), bottleneck (BN), edge perco-
lated component (EPC), Maximum Neighborhood Com-
ponent (MNC) and Density of Maximum Neighborhood
Component (DMNC). Also, we used the Cytoscape plu-
gins [48] for network analysis and measured the indegree,
outdegree and betweenness centrality metrics. Indegree is
the count of the number of interactions directed to the
node, and outdegree is the number of interactions that the
node directs to other nodes. Betweenness centrality mea-
sures on how many shortest paths a node, between other
nodes, occurs. It has been shown that metrics like the
aforementioned improve the identification of essential
nodes in networks. For example, betweenness centrali ty
correlates closely with essentiality, exposing critical nodes
that usually belong to the group of scaffold proteins or
proteins involved in crosstalk between signaling pathways
(called bottlenecks) [49]. This metric has also been pro-
posed in the new paradigm of network pharmacology as a
good feature for investigating potential drug targets [50].
The results are displayed in Table 2 where we detected the
‘top scorer’ clusters for every metric and for each TV-DBN
separately. With regard to betweenness centrality, the
majority of the clusters are relat ed to immune response,
with the exception of clusters 20, 25, 33 which are related
with cell-cell adhesion, regulat ion of cellul ar process and
cellular macromolecule metabolic process. The scene is
repeated with regard to BN metric, where all top scorer
clusters are immune response related, with the cluster 20
as exception. Bottlenecks are network nodes with key con-
nector role in the network and have many ‘shortest paths’
going through them. The MNC metric displays similar
results with betweenness centrality, with cluster 0 detected
by MNC but not by betweenness centrality. Also, the EDC
Dimitrakopoulou et al. Journal of Clinical Bioinformatics 2011, 1:27
/>Page 5 of 13
metric has similar results with MNC and betweenness
centrality with few variations, especially in the ranking of
the top scorer clusters. Interesting results can also been
extracted from the out- an d in-degree scores. All top
scorer outdegree clusters can be considered as the key
‘regulators’ whereas the top indegree clusters as the signifi-
cantly ‘regulatee’ clusters. As seen, the majority of outde-
gree clusters are immune response related in terms of
KEGG pathways [51] (Ta ble 3), but one can observe that
at day 1 post infection (p.i.) cluster 3 (GO: cellular macro-
molecule metabolic process) appears as significant regula-
tor and then vanishes from the highest rank positions.
Also, clusters 17 and 18 lose their central role especially at
day 4 p.i. where clusters like 25 (GO: system development)
are recruited. With respect to indegree metric, the major-
ity of clusters displayed similar scores with the top 5 pre-
sented clusters, whereas the outdegree top 5 clusters had
significant score value differences with the rest clusters.
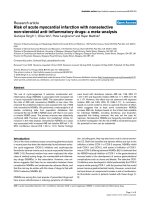
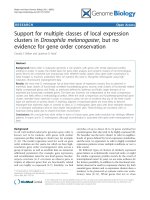
We also plot the histogram of indegree and outdegree
(averaged across time) for the time-varying networks in
Figure 2. The outdegrees seem to follow a scale free distri-
bution, which means that few clusters (regulators) regulate
a lot of clusters, whereas the indegree distribution is very
different from that of the outdegree and indicates that
most clusters are controlled by a few clusters. The average
indegree score per cluster cent roid node is 3.23, which is
indicative of the underlying model complexity. This value
could be regarded as high if gene-gene relationships were
considered, but the presented approach is based on cluster
centroid expression profiles, which in turn represent the
expression trend of sets of genes and therefore the inde-
gree term should be interpreted from a different perspec-
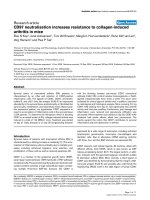
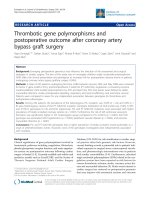
tive. In Figure 3, we display an indicative example of the
outdegree and indegree distribution of clusters with differ-
ent sized nodes at day 3 p.i. The directed interactions dis-
play the snapshot of the regulatory relationships among
the gene clusters at the specific time point. It is evident
that few clusters have high outdegree scores, while the
majority of clusters have similar scores with respect
to indegree metric (the highest scores are presented in
Table 2). These findings are well consistent, on gene level,
with the biological observations that most genes are con-
trolled only by a few regulators.
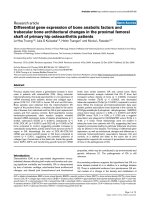
In Figure 4, two different statistics, network size and
average local clustering coefficient, of the reversed engi-
neered cluster-based regulatory networks are plotted as a
function of the five time phases. Network size, defined as
the number of edges, depicts the overall connectedness of
the network, while the average local clustering coefficient,
as defined by [52], measures the average connectedness of
the neighborhood local to each node. Both statistics have
been normalized to the range between 0[1] for comparison
reasons. It is apparent that the network size and the aver-
age local clustering coefficient display completely different
trajectories during the defense response against the virus.
On one hand, the n etwork size is continually increasing,
displaying peak value at day 4 p.i. and then slightly drops.
On th e other hand, the average local clustering coefficients
of the TV-DBNs drop sharply after day 1 p.i. and stay low
until the fifth day after infection. One possible explanation
is that the clusters of co-expressed genes have a more
fixed and specific role at the beginning of the battle against
the pathogen and therefore interact with fewer clusters;
however, the genes show an expanded functionality reper-
toire in the next cri tical days in order to ser ve the needs
for response against the virus. A further hypothesis is that
in interactome exist few key modules/clusters (hubs) that
initiate most of the other modules to be activated in the
beginning of response, and this feature is lost at the late
time phases, where the ‘ hub-ness’ identity is diffused in
more modules apart from the key ones. After all, the viral
load develops gradually during the first days of infection,
displaying a peak on day 2 p.i., which might be the critical
threshold for the onset of immune response.
Table 2 Top Scorer Clusters
Time Point (day p.i.)
Topological Metric 1(day p.i.) 2(day p.i.) 3(day p.i.) 4(day p.i.) 5(day p.i.)
Rank 1 2 34512345123451234512345
Hubba MNC 17182415 0 1718152425172515182417251524182524151718
Hubba EPC 17 18 24 15 20 17 24 15 18 25 17 25 15 24 18 17 25 15 24 18 25 15 24 18 17
Hubba DMNC 0 10 4 6 7 11 14 20 32 0 2 11 12 22 31 31 0 4 10 7 0 11 22 28 31
Hubba Degree 17182415 0 1718152425171525182417251518242524151817
Hubba BN 17 18 15 - - 17 15 - - - 18 17 15 24 - 17 18 15 24 - 18 24 15 17 20
Indegree 1011 7 9 221114 9 3217101132 8 9 101124233210111423 9
Outdegree 17182415 3 1718152425171525182417251524182515241817
Betweenness Centrality 17 18 15 24 33 17 18 15 20 25 17 18 29 15 25 17 25 18 23 15 18 17 25 15 23
Clusters wer e evaluated in every time point with several topological metrics as defined in Hubba analyzer. Also, the indegree, outdegree and betweenness
centrality scores were calculated with the use of Cytoscape plugins. We display the top 5 clusters (with descending rank order) at every time point with the
highest scores in every metric, with the exception of BN metric where only few clusters had score > 0.
Dimitrakopoulou et al. Journal of Clinical Bioinformatics 2011, 1:27
/>Page 6 of 13
Table 3 KEGG Pathway analysis
Outdegree/Betweenness Centrality
Cluster KEGG pathway Percentage P-value
3 no pathway
15 B cell receptor signaling pathway 11.5 8.00E-03
17 RIG-I-like receptor signaling pathway 21.1 6.30E-06
Cytosolic DNA-sensing pathway 15.8 5.30E-04
Toll-like receptor signaling pathway 10.5 6.70E-02
18 Natural killer cell mediated cytotoxicity 16.7 2.60E-03
Graft-versus-host disease 11.1 4.00E-02
Allograft rejection 11.1 4.00E-02
20 drug metabolism 10.8 1.30E-03
23 Jak-STAT signaling pathway 6.0 9.60E-03
Lysosome 4.8 2.80E-02
Cell adhesion molecules (CAMs) 4.8 5.30E-02
24 Cytokine-cytokine receptor interaction 22.7 4.50E-05
Chemokine signaling pathway 18.2 5.90E-04
NOD-like receptor signaling pathway 13.6 1.70E-03
Cytosolic DNA-sensing pathway 9.1 5.60E-02
Hematopoietic cell lineage 9.1 8.50E-02
Toll-like receptor signaling pathway 9.1 9.90E-02
29 Proteasome 6.3 1.00E-03
Apoptosis 4.8 5.40E-02
Toll-like receptor signaling pathway 4.8 6.80E-02
33 Aldosterone-regulated sodium reabsorption 3.4 7.40E-03
Indegree
Cluster KEGG pathway Percentage P-value
7 DNA replication 9.7 4.60E-09
Mismatch repair 5.6 9.40E-05
8 Apoptosis 3.2 1.40E-02
p53 signaling pathway 2.4 6.00E-02
9 Chemokine signaling pathway 8.9 8.80E-03
Jak-STAT signaling pathway 6.7 5.20E-02
10 Antigen processing and presentation 8.7 2.40E-05
Allograft rejection 7.2 7.20E-04
Endocytosis 8.7 1.00E-03
Viral myocarditis 5.8 5.90E-03
11 Complement and coagulation cascades 8.2 3.10E-05
Cytokine-cytokine receptor interaction 9.6 1.70E-03
14 Natural killer cell mediated cytotoxicity 13.5 5.00E-08
T cell receptor signaling pathway 8.5 8.70E-04
Primary immunodeficiency 5.4 5.70E-03
Cell adhesion molecules (CAMs) 8.1 2.80E-03
Leukocyte transendothelial migration 6.8 6.80E-03
Cytokine-cytokine receptor interaction 8.1 1.90E-02
Cell adhesion molecules (CAMs) 3.8 1.70E-02
Cytokine-cytokine receptor interaction 8.1 1.90E-02
Cell adhesion molecules (CAMs) 3.8 1.70E-02
22 DNA replication 3.4 2.30E-03
Cytokine-cytokine receptor interaction 5.2 3.80E-02
23 Jak-STAT signaling pathway 6.0 9.60E-03
Cell adhesion molecules (CAMs) 4.8 5.80E-02
Dimitrakopoulou et al. Journal of Clinical Bioinformatics 2011, 1:27
/>Page 7 of 13
Interactome analysis with Protein-Protein and Protein-
DNA Interaction data
An additional aspect in our analysis was to explore the
cluster interactome with respect to other types of data
such as protein-protein interactions (PPIs) and protein-
DNA interactions and display the ability of TV-DBN
approach in monitoring the dynamic presence or absence
of these interactions over the time course. For this pur-
pose, we downloaded the mouse datasets from InnateDB
database [53]. We selected InnateDB because it is a
highly curated database that in tegrates PPI and protein-
DNAdatafromvariousdatabasessuchasDIP,MINT,
IntAct, BioGRID and BIND and provides a thorough
curation system process for genes/proteins related to
innate immune system. In our dataset of a total of 3500
genes, 492 such interaction groups (consisting of more
than two genes/proteins) with 381 unique Entrez gene
ids were detected (additio nal file 3). A small fraction (72)
of these interaction groups was identified within the
members of the clusters, while the rest was shared
between clusters. It is apparent in Figure 5 that the traced
PPIs and protein-DNA interactions increased abruptly
after day 1 p.i. with the peak value at day 4 p.i., probably
due to critical viral load development and delayed
immune response. This observation is highly correlated
with the increase in the network size of t he derived TV-
DBNs during time evolution, since the interactivity
between nodes becomes stronger. It is worth mentioning
that the majority of interactions (ranging between 57-
69%) detected at each TV-DBN are involved in immune
response rela ted pathways like chemokine/cyt okines and
their receptors, interferon-regulation and interferon-
response, TLR signaling pathway, RIG-I-like receptor sig-
naling pathway and others. Despite the limitation posed
by the small amount of available PPI and protein-DNA
data in our dataset, it is evident that immune response
mechanism undergoes significant restructuring the first
days after viral invasion and the TV-DBN succeeded in
Table 3 KEGG Pathway analysis (Continued)
24 Cytokine-cytokine receptor interaction 22.7 5.40E-05
Chemokine signaling pathway 18.2 5.90E-04
NOD-like receptor signaling pathway 13.6 1.70E-03
32 Cytokine-cytokine receptor interaction 19.6 2.00E-09
NOD-like receptor signaling pathway 8.9 5.30E-05
Toll-like receptor signaling pathway 8.9 1.30E-04
All top scorer clusters, with regard to indegree, outdegree and betweenness centrality metrics, were checked for enriche d KEGG pathways.
Figure 2 Degree Distribution. Indegree and outdegree distribution averaged over 5 time points. The x-axis represents the indegree/outdegree
score, while the y-axis depicts the total number of clusters.
Dimitrakopoulou et al. Journal of Clinical Bioinformatics 2011, 1:27
/>Page 8 of 13
identifying such immune related interactions between
diff erent cl uster centroid nodes. In Table 4, we list many
known PPI and protein-DNA interactions and the precise
time point of their occurrence. These observ atio ns eluci-
date the ability of TV-DBNs to provide further hypoth-
eses about the time snapshots that protein-protein and
protein-DNA interactions take place.
Furthermore, we accumulated transcription factor
(TF) data from the TFCat database [54], a highly
curated catalogue containing proven a s well as candi-
date TFs. In our dataset 104 TFs were identified; 26 of
them being TF candidates (data shown in additional
file 4). We found that 26% of those TFs are located in
hub clusters, e.g. 17, 18, 29 and 33 with high rank in
the outdegree metric and contain also three TFs
related to immune response such as Irf7 in cluster 17,
Irf1 in cluster 29 and Bmi1 in cluster 33. A representa-
tive example is cluster 17 that includes in addi tion to
Irf7 many other interferon-induced genes like Ifit1,
Ifit2, Ifit3, Ifi44 and interacts bidirectional (in all time
points) with cluster 9, which encompasses a great pro-
portion of interferon-induced genes like Ifi205, Tgtp,
Igtp, Irgm, Ifih1, Isg20. This observation is consistent
with the established role of Irf7 as an important pro-
tective host response during infection. Irf7 induces the
a- and b- interferons, which, in turn, regulate the
expression of the interferon-induced genes [55].
Another example is cluster 32 which includes Atf3 and
regulates, in all time shifts except for day 1, cluster 18
which contains Ifng. Other studies have shown that
Atf3 is recruited to transactivate the Ifng pr omoter
during early Th1 differentiation [56].
Pathway gene-gene interaction dynamics
Our networks explicitly depict the cluster inter-relation-
ships at every time serial snapshot. The underlying con-
cept of our method is to reconstruct networks that
represent the regulatory effect of a co-expressed gene
set A (regulator) over another set B of co-expressed
genes (regulatees)ataspecifictimepoint.Ongene
level, we expect to find the regulators of a gene, belong-
ing to cluster B, in the gene pool of cluster A. Thus,
moving forward in our analysis we checked whether
TV-DBN approach may recover known gene-to-gene
Figure 3 Network Graph Structures. Network graph structures of the resulting TV-DBNs. Two indicative network s with different sized nodes
from time point 3 are displayed, in terms of (a) outdegree score and (b) indegree score. Each node represents the time (t) of the respective
network and the corresponding cluster number.
Dimitrakopoulou et al. Journal of Clinical Bioinformatics 2011, 1:27
/>Page 9 of 13
interactions from the derived cluster relationships and
we reveal the dynamics of these interactions by display-
ing the exact time points of their occurrence. One
example is the RIG-I-like receptor signaling pathway. A
foreign RNA is recogni zed by a family of cytosolic RNA
helicases termed RIG-I-like receptors (RLRs). The RLR
proteins include Rig-I, Mda5, and Lgp2, which recognize
viral nucleic acids and recruit specific intracellular adap-
tor proteins to initiate signaling pathways that lead to
the synthesis o f type I interferon and other inflamma-
tory cytokines, which are important for eliminating
viruses [57]. We first, examined if its members were
included in clusters that interact in the derived networks
(at all time points). Subsequently, we investig ated if the
direction of these edges reflects the ‘regulator-regulatee’
roles on the gene level. In particular, 25 genes (out of
the 70 included in the pathway) are included in our
dataset and TV-DBN managed successfully to recover
all known interactions that are represented in the
KEGG database. For example, the TV-DBN algorithm
captured the interactions between Ddx58 (cluster 10)
Figure 4 Netw ork Size/Local Clustering Coefficient.Plotoftwo
network statistics (network size, clustering coefficient) as functions
of time line. It is obvious that network size evolves in a very
different way from the local clustering coefficient.
Figure 5 Size of recovered interactions. This histogram shows
the size of known PPI and protein-DNA interactions recovered per
time point. It is apparent that there is an increase in the traced
interactions the first 4 days p.i.
Table 4 Timeline of PPI/Protein-DNA interactions
A B C D E PPI/Protein-DNA interaction
●● Relb Cxcl13
●●●●● Nfkb2 Cxcl13
●●●●● Nfkbiz Il6
●●● Bcl3 Cyld
●●●●● Stat1 Gm9706
●●● Prkcz Junb
●●●●● Cxcl10 Cxcr3
●●●●● Stat1 Cxcl10
●●●●● Stat2 Cxcl10
●●●●● Irf9 Cxcl10
●● Plcg2 Spnb2
●●● Tlr2 Tlr6
● Ncor1 Cxcl10
●●● ● Stat4 Ifng
●●● ● Tbx21 Ifng
●●● ● Bid Gzmb
●●●●● Irf1 Gbp2
●● Irf1 Il27
●●● ● Gpnmb Pla2g4a
●● Sfpi1 Il1b
●● Tbp Ifng
●●●●● Ccl7 Ccr2
●● Sfpi1 Cxcl9
● Cxcl9 Cxcr3
●●● ● Stat1 Cxcl9
●●●●● Lcp2 Vav1
●●●●● Ptpn6 Vav1
●●● ● Ccl4 Ccr5
●● Ncor1 Ccl4
●● Irf1 Il15
●●●●● Gzmb Serpinb9
●●● ● Dok2 Tek
●●● Rad21 Ifng
●● Ccl2 Ccrl2
●●●●● Etv6 Lcn2
●●●● Ripk Zbp1
●●●●● Irf7 Myd88
●●●●● Irf7 Ifnb1
●●●●● Stat1 Irf7
●●● ● Gadd45g Loc100046823
●●● ● Irf8 Cxcl9
●●●● Irf8 Gm9706
●●●●● Ccl2 Ccr2
●● Junb Il6
●●● ● Atf3 Il6
●● Runx3 Ifng
●● Ncor1 Ccl2
Dimitrakopoulou et al. Journal of Clinical Bioinformatics 2011, 1
:27
http://ww
w.jclinbioinformatics.com/content/1/1/27
Page 10 of 13
and Isg15 (cluster 17), between Ddx58 (cluster 10) and
Trim25 (cluster 32), between Irf7 (cluster 17) and Ifna2
(cluster 21), Ifna4 (cluster 34), Ifnab (cluster 19), Ifna12
(cluster 21), Ifnb1 (cluster 32) and between Mapk8
(cluster 27) and Mapk9 (cluster 12) with Tnf (cluster
10). Nevertheless, one should bear in mind that the time
spacing between gene expression measurements, as has
been recorded in our present data set, is fairly large in
comparison to the real time at which these interactions
occur. Therefore, the current cluster-based networks
provideonlyaverycoarserepresentationoftheregula-
tory effects which could be refined by higher time
sampling.
Another important example is the Toll-like receptor
signaling pathway. Toll-like receptors (TLRs) are
responsible for detecting microbial pathogens and initi-
ating innate immune responses. Upon recognition of the
pathogens, TLRs sti mulate the rapid activation of innate
immunity and induce the production of proinflamma-
tory cytokines and upregulation of costimulatory mole-
cules [58]. In particular, 39 out of the 100 genes of this
pathway are part of our differentially expressed dataset.
The resulting TV-DBNs showed that the majority of the
known interactions, occurring between the 39 members,
are identified in the first three days after viral invasion
and they fade out in the next days. For example, the
interactions among Tlr1 (cluster 15), Tlr2 (cluster 8)
and Tlr6 (cluster 14), between Tlr7 (cluster 11) and
Myd88 (cluster29)aswellasbetweenPik 3r3 (cluster
33) and Akt3 (cluster 8) are observed until day 3 p.i.,
whereas interactions between Ifnb1 (cluster 32) and
Ifnar2 (cluster 12) and among Stat1 (cluster 9), Cxcl10
(cluster 17) and Cxcl9 (cluster 18) are observed until
day 5 p.i.
Finally, we zoomed into the dynamics of NOD-like
receptor signaling pathway, where 18 out of the 58
members are included in our dataset. Recently, it was
shown that Nlrp3, member of the NOD-like receptor
family, is activated after influenza virus infection. Nlrp3
forms a complex, called inflammasome, with apoptosis
associated speck-like protein containing a caspase
recruitment domain (ASC) and caspase-1 [59]. Activa-
tion of casp ase-1 through Nlrp3 and ASC is necessary
for converting pro-Il1b, pro-Il18 and pro-Il33 into
mature cytokines. Il1b and Il18 are potent pro-inflam-
mato ry cytokines, and Il33 promotes immune responses
mediated by Th2 cells. Our TV-DBNs identified interac-
tions between Mapk3 (cluster 26), Ccl5 (cluster 32) and
Tnf (cluster 10) as well as between Mapk8 (cluster 27),
Mapk9 (cluster 12) with Il6 (cluster 24) in the first two
days, while the interaction between Casp1 (cluster 14)
and Il1b (cluster 32) was traced in days 4 and 5 p.i. It is
worth mentioning that the amount of the recovered
known gene-gene relationships of our cluster-based
approach can offer to biologists novel hypotheses, about
the involvement of other genes whose functional role is
still unknown, yet belong to the same clusters where the
gene-gene interactions were detected.
Conclusions
Using the TV-DBN method on large scale expression
data after an external perturbation of a biological sys-
tem, such as an infection of the lung with a virus, our
proposed approach contributed towards obtaining a dee-
per understanding of the dynamic changes at the mole-
cular level. We succeeded in detecting sev eral gene-gene
interactions known to be important in early host
response.
In the near future, more refined network structures
will be provided and hidden aspects of the innat e
immune system will be revealed upon availability of
experimental data of more dense time series gene
exp ressions. Thus, the dynamically reconstructed GRNs
will be available for monitoring H1N1 disease develop-
ment and outcome.
Additional material
Additional file 1: Gene members of 35 clusters. List of gene members
for the 35 clusters (with Entrez gene IDs and short description per gene).
Additional file 2: Biological Process GO enrichment analysis of the
35 clusters. We examined the derived 35 clusters with respect to
biological process GO terms with the use of DAVID Bioinformatics
Resources functional annotation tool.
Additional file 3: PPI/Protein-DNA Interaction data. We downloaded
InnateDB protein-protein interaction (PPI) and protein-DNA interaction
data and isolated all interaction groups with members included in our
dataset.
Additional file 4: Transcription factors. We downloaded all known and
candidate Transcription Factors (TFs) from TFCat database. This table
displays all TFs included in our dataset and the cluster in which they are
located.
Acknowledgements
This research has been co-financed by the European Union (European Social
Fund-ESF) and Greek national funds through the Operational Program
“Education and Lifelong Learning” of the National Strategic Reference
Framework (NSRF) - Research Funding Program: Heracleitus II. Investing in
knowledge society through the European Social Fund. KS is supported by
Table4TimelineofPPI/Protein-DNA interactions
(Continued)
● Gzmb Hopx
●●●● Irf7 Ifna4
●●●● Ncor1 Cxcl9
●●●● Il1rl1 Myd88
Each line in the table correspond s to one PPI or protein-DNA interaction. The
bullets indicate the exact day (A: day 1 p.i., B: day 2 p.i., C: day 3 p.i., D: day 4
p.i., E: day 5 p.i.) that the corresponding interaction is present in the resulting
network.
Dimitrakopoulou et al. Journal of Clinical Bioinformatics 2011, 1:27
/>Page 11 of 13
intra-mural grants from the Helmholtz-Association (Program Infection and
Immunity) and a research grant FluResearchNet (No. 01KI07137) from the
German Ministry of Education and Research. The joint collaboration was
supported by a grant for the SYSGENET network to KS which was provided
through the COST framework, an intergovernmental framework for European
Cooperation in Science and Technology />Author details
1
School of Medicine, University of Patras, Patras 26500, Greece.
2
Department
of Electrical and Computer Engineering, University of Patras, Patras 26500,
Greece.
3
Department of Infection Genetics, Helmholtz Centre for Infection
Research, Inhoffenstr. 7, D-38124 Braunschweig, Germany.
4
University of
Veterinary Medicine Hannover, Buenteweg 2, D-30559 Hannover, Germany.
Authors’ contributions
KD conceived of the study, implemented the algorithms, did the
interpretation of the results and drafted the manuscript. CT and GP
implemented the algorithms and drafted the manuscript. CP contributed to
the analysis of the raw data and interpretation of the results. EW contributed
to the interpretation of the results. KNS designed the flowchart of the
computational aspects of the study and co-ordinated the implementati on of
the algorithms. KS contributed to the writing of the manuscript and
interpretation of results. AB conceived of the study, participated in its design
and co-ordination. All authors read and approved the final manuscript.
Competing interests
The authors declare that they have no competing interests.
Received: 19 July 2011 Accepted: 21 October 2011
Published: 21 October 2011
References
1. Gardner TS, Faith JJ: Reverse-engineering transcription control networks.
Physics of Life Reviews 2005, 2:65-88.
2. Bansal M, Belcastro V, Ambesi-Impiombato A, di Bernardo D: How to infer
gene networks from expression profiles. Mol Syst Biol 2007, 3:78.
3. Markowetz F, Spang R: Inferring cellular networks-a review. BMC
Bioinformatics 2007, 8(Suppl 6):S5.
4. Hecker M, Lambeck S, Toepfer S, van Someren E, Guthke R: Gene
regulatory network inference: Data integration in dynamic models-A
review. Bio Systems 2008, 96:86-103.
5. Lee WP, Tzou WS: Computational methods for discovering gene
networks from expression data. Brief Bioinform 2009, 10:408-423.
6. Shmulevich I, Dougherty E, Zhang W: From boolean to probabilistic
boolean networks as models of genetic regulatory networks. Proc IEEE
2002, 90:1778-1792.
7. Friedman N, Linial M, Nachman I, Pe’er D: Using Bayesian networks to
analyze expression data. J Comp Biol 2000, 7:601-620.
8. Perrin BE, Ralaivola L, Mazurie A, Bottani S, Mallet J, d’Alché-Buc F: Gene
networks inference using dynamic bayesian networks. Bioinformatics
2003, 19:ii138-48.
9. Yu J, Smith V, Wang P, Hartemink A, Jarvis E: Advances to Bayesian
network inference for generating causal networks from observational
biological data. Bioinformatics 2004, 20:3594-603.
10. D’haeseleer P, Wen X, Fuhrman S, Somogyi R: Linear modeling of mRNA
expression levels during CNS development and injury. Proc Pacific Symp
Biocomputing 1999, 41-52.
11. Chen KC, Calzone L, Csikasz-Nagy A, Cross FR, Novak B, Tyson JJ:
Integrative analysis of cell cycle control in budding yeast. Mol Biol Cell
2004, 15:3841-3862.
12. Karlebach G, Shamir R: Modelling and analysis of gene regulatory
networks. Nature Reviews Molecular Cell Biology 2008, 9:770-780.
13. Bansal M, Della Gatta G, di Bernardo D: Inference of gene regulatory
networks and compound mode of action from time course gene
expression profiles. Bioinformatics 2006, 22:815-22.
14. Greenfield A, Madar A, Ostrer H, Bonneau R: DREAM4: Combining genetic
and dynamic information to identify biological networks and dynamical
models. PLoS One 2010, 5
:e13397.
15.
Hirose O, Yoshida R, Imoto S, Yamaguchi R, Higuchi T, Charnock-Jones DS,
Print C, Miyano S: Statistical inference of transcriptional module-based
gene networks from time course gene expression profiles by using state
space models. Bioinformatics 2008, 24:932-42.
16. Rangel C, Angus J, Ghahramani Z, Lioumi M, Sotheran E, Gaiba A, Wild DL,
Falciani F: Modeling T-cell activation using gene expression profiling and
state-space models. Bioinformatics 2004, 20:1361-72.
17. Opgen-Rhein R, Strimmer K: From correlation to causation networks: a
simple approximate learning algorithm and its application to high-
dimensional plant gene expression data. BMC Syst Biol 2007, 1:37.
18. Shimamura T, Imoto S, Yamaguchi R, Fujita A, Nagasaki M, Miyano S:
Recursive regularization for inferring gene networks from time-course
gene expression profiles. BMC Syst Biol 2009, 3:41.
19. Zoppoli P, Morganella S, Ceccarelli M: TimeDelay-ARACNE: Reverse
engineering of gene networks from time-course data by an information
theoretic approach. BMC Bioinformatics 2010, 11:154.
20. Talih M, Hengartner N: Structural learning with time-varying components:
Tracking the crosssection of financial time series. J Royal Stat Soc 2005,
B67:321-341.
21. Hanneke S, Xing EP: Discrete temporal models of social networks. In
Workshop on Statistical Network Analysis 2006, ICML06.
22. Guo F, Hanneke S, Fu W, Xing EP: Recovering temporally rewiring
networks: A model-based approach. The 24th International Conference of
Machine Learning, 2007, New York, Association for Computing Machinery .
23. Xuan X, Murphy K: Modeling changing dependency structure in
multivariate time series. In Proceedings of the 24th International Conference
on Machine Learning Corvallis, OR, USA; 2007, 1055-1062.
24. Robinson J, Hartemink A: Non-stationary dynamic bayesian networks.
2008, 1369-1376, NIPS ‘08: Neural Information Processing Systems.
25. Ahmed A, Xing EP: Recovering time-varying networks of dependencies in
social and biological studies. PNAS 2009, 106:11878-11883.
26. Song L, Kolar M, Xing E: Time-varying dynamic Bayesian networks.
Advances in Neural Information Processing Systems 22 (NIPS 2009) .
27. Tumpey TM, Garcia-Sastre A, Taubenberger JK, Palese P, Swayne DE, Pantin-
Jackwood MJ, Schultz-Cherry S, Solorzano A, Van Rooijen N, Katz JM,
Basler CF: Pathogenicity of Influenza viruses with genes from the 1918
pandemic virus: functional roles of alveolar macrophages and
neutrophils in limiting virus replication and mortality in mice. J Virol
2005, 79:14933-14944.
28. Kash JC, Tumpey TM, Proll SC, Carter V, Perwitasari O, Thomas MJ, Basler CF,
Palese P, Taubenberger JK, Garcia-Sastre A, Swayne DE, Katze MG: Genomic
analysis of increased host immune and cell death responses induced by
1918 Influenza virus. Nature 2006, 443:578-581.
29. Vidal SM, Malo D, Marquis JF, Gros P: Forward genetic dissection of
immunity to infection in the mouse. Annu Rev Immunol 2008, 26:81-132.
30. Srivastava B, Blazejewska P, Hessmann M, Bruder D, Geffers R, Mauel S,
Gruber
AD, Schughart K: Host genetic background strongly influences the
response to influenza a virus infections. PLoS One 2009, 4:e4857.
31. Alberts R, Srivastava B, Wu H, Viegas N, Geffers R, Klawonn F, Novoselova N,
do Valle TZ, Panthier JJ, Schughart K: Gene expression changes in the
host response between resistant and susceptible inbred mouse strains
after influenza A infection. Microbes Infect 2010, 12:309-18.
32. Song L, Kolar M, Xing E: KELLER: estimating time-varying interactions
between genes. Bioinformatics 2009, 25:i128-i136.
33. Luscombe N, Babu M, Yu H, Snyder M, Teichmann S, Gerstein M: Genomic
analysis of regulatory network dynamics reveals large topological
changes. Nature 2004, 431:308-312.
34. Guthke R, Möller U, Hoffmann M, Thies F, Töpfer S: Dynamic Network
Reconstruction from Gene Expression Data Applied to Immune
Response during Bacterial Infection. Bioinformatics 2005, 21:1626-1634.
35. Inoue LY, Neira M, Nelson C, Gleave M, Etzioni R: Cluster-based network
model for time-course gene expression data. Biostatistics 2007, 8:507-525.
36. Shiraishi Y, Kimura S, Okada M: Inferring cluster-based networks from
differently stimulated multiple time-course gene expression data.
Bioinformatics 2010, 26:1073-1081.
37. Barabasi AL, Oltvai ZN: Network biology: understanding the cell’s
functional organization. Nature Reviews Genetics 2004, 5:101-113.
38. Petti AA, Church GM: A network of transcriptionally coordinated
functional modules in Saccharomyces cerevisiae. Genome Research 2005,
15:1298-1306.
39. Ritchie ME, Silver J, Oshlack A, Holmes M, Diyagama D, Holloway A,
Smyth GK: A comparison of background correction methods for two-
colour microarrays. Bioinformatics 2007, 23:2700-2707.
Dimitrakopoulou et al. Journal of Clinical Bioinformatics 2011, 1:27
/>Page 12 of 13
40. Gentleman RC, Carey VJ, Bates DM, Bolstad B, Dettling M, Dudoit S, Ellis B,
Gautier L, Ge Y, Gentry J, Hornik K, Hothorn T, Huber W, Iacus S, Irizarry R,
Leisch F, Li C, Maechler M, Rossini AJ, Sawitzki G, Smith C, Smyth G,
Tierney L, Yang JY, Zhang J: Bioconductor: open software development
for computational biology and bioinformatics. Genome Biol 2004, 5:R80.
41. Fujita A, Sato JR, Ferreira CE, Sogayar MC: GEDI: a user-friendly toolbox for
analysis of large-scale gene expression data. BMC Bioinformatics 2007,
8:457.
42. Huang DW, Sherman BT, Lempicki RA: Systematic and integrative analysis
of large gene lists using DAVID Bioinformatics Resources. Nature Protoc
2009, 4:44-57.
43. Filkov V: Identifying gene regulatory networks from gene expression
data. In Handbook of Computational Molecular Biology. Edited by: Aluru.
CRC Press, Chapman 2005:27.1-27.29.
44. Chen G, Jaradat SA, Banerjee N, Tanaka TS, Ko MSH, Zhang MQ: Evaluation
and comparison of clustering algorithms in analyzing ES cell gene
expression data. Statistica Sinica 2002, 12:241-262.
45. Dunn J: Well separated clusters and optimal fuzzy partitions. J Cybernetics
1974, 4:95-104.
46. Fu WJ: Penalized regression: the Bridge versus the Lasso. Journal of
Computational and Graphical Statistics 1998, 7:397-416.
47. Lin CY, Chin CH, Wu HH, Chen SH, Ho CW, Ko MT: Hubba: hub objects
analyzer–a framework of interactome hubs identification for network
biology. Nucleic Acids Res 2008, 36:W438-W443.
48. Shannon P, Markiel A, Ozier O, Baliga NS, Wang JT, Ramage D, Amin N,
Schwikowski B, Ideker T: Cytoscape: a software environment for
integrated models of biomolecular interaction networks. Genome Res
2003, 13:2498-504.
49. Yu H, Kim PM, Sprecher E, Trifonov V, Gerstein M: The importance of
bottlenecks in protein networks: correlation with gene essentiality and
expression dynamics. PloS Computational Biology 2007, 3:e59.
50. Hopkins AL: Network pharmacology: the next paradigm in drug
discovery. Nat Chem Biol 2008, 4:682-690.
51. Kanehisa M, Goto S: KEGG: Kyoto Encyclopedia of Genes and Genomes.
Nucleic Acids Res 2000, 28:27-30.
52. Watts DJ, Strogatz SH: Collective dynamics of ‘small-world’ networks.
Nature 1998, 393:440-442.
53. Lynn DJ, Winsor GL, Chan C, Richard N, Laird MR, Barsky A, Gardy JL,
Roche FM, Chan TH, Shah N, Lo R, Naseer M, Que J, Yau M, Acab M,
Tulpan D, Whiteside MD, Chikatamarla A, Mah B, Munzner T, Hokamp K,
Hancock RE, Brinkman FS: InnateDB: facilitating systems-level analyses of
the mammalian innate immune response. Mol Syst Biol 2008, 4:218.
54. Fulton DL, Sundararajan S, Badis G, Hughes TR, Wasserman WW, Roach JC,
Sladek R: TFCat: the curated catalog of mouse and human transcription
factors. Genome biology 2009, 10:R29.
55. Honda K, Yanai H, Negishi H, Asagiri M, Sato M, Mizutani T, Shimada N,
Ohba Y, Takaoka A, Yoshida N, Taniguchi T: IRF-7 is the master regulator
of type-I interferon-dependent immune responses. Nature 2005,
434:772-777.
56. Filén S, Ylikoski E, Tripathi S, West A, Björkman M, Nyström J, Ahlfors H,
Coffey E, Rao KV, Rasool O, Lahesmaa R: Activating transcription factor 3 is
a positive regulator of human IFNG gene expression. J Immunol 2010,
184:4990-9.
57. Yoneyama M, Fujita T: RNA recognition and signal transduction by RIG-I-
like receptors. Immunol Rev 2009, 227:54-65.
58. Kaisho T, Akira S: Toll-like receptors as adjuvant receptors. Biochim Biophys
Acta 2002, 1589:1-13.
59. Shaw MH, Reimer T, Kim YG, Nuñez G: NOD-like receptors (NLRs): bona
fide intracellular microbial sensors. Curr Opin Immunol 2008, 20:377-82.
doi:10.1186/2043-9113-1-27
Cite this article as: Dimitrakopoulou et al.: Dynamic gene network
reconstruction from gene expression data in mice after influenza A
(H1N1) infection. Journal of Clinical Bioinformatics 2011 1:27.
Submit your next manuscript to BioMed Central
and take full advantage of:
• Convenient online submission
• Thorough peer review
• No space constraints or color figure charges
• Immediate publication on acceptance
• Inclusion in PubMed, CAS, Scopus and Google Scholar
• Research which is freely available for redistribution
Submit your manuscript at
www.biomedcentral.com/submit
Dimitrakopoulou et al. Journal of Clinical Bioinformatics 2011, 1:27
/>Page 13 of 13