Báo cáo y học: "Acute nerve stretch and the compound motor action potential" potx
Bạn đang xem bản rút gọn của tài liệu. Xem và tải ngay bản đầy đủ của tài liệu tại đây (2.07 MB, 12 trang )
RESEARCH ARTICLE Open Access
Acute nerve stretch and the compound motor
action potential
Mark M Stecker
*
, Kelly Baylor, Jacob Wolfe and Matthew Stevenson
Abstract
In this paper, the acute changes in the compound motor action potential (CMAP) during mechanical stretch were
studied in hamster sciatic nerve and compared to the changes that occur during compression.
In response to stretch, the nerve physically broke when a mean force of 331 gm (3.3 N) was applied while the
CMAP disappeared at an average stretch force of 73 gm (0.73 N). There were 5 primary measures of the CMAP
used to describe the changes during the experiment: the normalized peak to peak amplitude, the normalized area
under the curve (AUC), the normalized duration, the normalized velocity and the normalized velocity corrected for
the additional path length the impulses travel when the nerve is stretched. Each of these measures was shown to
contain information not available in the others.
During stretch, the earliest change is a reduction in conduction velocity followed at higher stretch forces by
declines in the amplitude of the CMAP. This is associated with the appearance of spontaneous EMG activity. With
stretch forces < 40 gm (0.40 N), there is evidence of increased excitability since the corrected velocities increase
above baseline values. In addition, there is a remarkable increase in the peak to peak amplitude of the CMAP after
recovery from stretch < 40 gm, often to 20% above baseline.
Multiple means of predicting when a change in the CMAP suggests a significant stretch are discussed and it is
clear that a multifactorial approach using both velocity and amplitude parameters is important. In the case of pure
compression, it is only the amplitude of the CMAP that is critical in predicting which changes in the CMAP are
associated with significant compression.
Background
In a previous paper [1], the response of the compound
motor action potential (CMAP) produced by peripheral
nerve stimulation was studied during a pure compres-
sion injury of the nerve. Although, this is one mechan-
ismbywhichanervemightbeinjuredduringsurgery,
nerves can also be in jured as a co nseque nce of stretch.
In order to use the CMAP as a means of warning a sur-
geon that a nerve is undergoing significant stretch dur-
ing a surgical procedure a number of criteria must be
met. First, those characteristics of the CMAP that can
be measured in real time must be identified and their
changes during stretch must be understood. Second,
optimal means of classifying whether there is impending
injury to the nerve based upon these parameters must
be found. Finally, the sensitivity and specificity of these
changes in predicting injury must be determined. These
are the primary goals of this paper.
It is well known that stretching a periphe ral nerve can
cause injury. Many studies have demonstrated that
stretch can damage the myelin [2-4]as well as the cytos-
keleton [5,6]. The neurophysiology of stretch injury has
also been investigated but primaril y in regar d to the sub-
acute injury caused b y limb lengthening [7-10] rather
than the acute injury that may occur during a surgical
procedure. In particular, the electrophysiologic character-
istics of these subacute injuries may be quite different
from acute injuries especially since it has been shown
that longitudinal stretching of the nerve for prolonged
periods is associated with a greater chanc e of injury at
the same stretching force [11] than a brief period of
stretch. Electrophysiologic studies of stretch have show n
both reductions in conduction velocity and decreased
CMAP amplitudes but have not evaluated the criteria
that could be used to determine which electrophysiologic
* Correspondence:
Department of Neuroscience, Marshall University School of Medicine,
Huntington, WV 25701 USA
Stecker et al. Journal of Brachial Plexus and Peripheral Nerve Injury 2011, 6:4
/>JOURNAL OF BRACHIAL PLEXUS AND
PERIPHERAL NERVE INJURY
© 2011 Stecker et al; licensee BioMed Central Ltd. This is an Open Access article distributed unde r the terms of the Creativ e Commons
Attribution License ( which permits unrestricted use, distribut ion, and reproduction in
any medium, provided the original work is properly cited.
changes provide the first indication of acute stretch
related injury.
The specific goal of this paper is to study the changes
in the CMAP during acute nerve stretch and compare
them to the changes seen during acute compression. In
particular, conduction velocities, CMAP amplitudes,
CMAP duration, and the area under the curve for the
CMAP will all be studied as well as the presence of
spontaneous electromyographic (EMG) activity.
Methods
Use of animals
Under protocol #401 approved by the Marshall Univer-
sity IACUC, 21 sciatic nerves f rom 13 normal male
golden Syrian hamsters were analyzes. The data were
compared with data obtained in a previous study [1]
from 16 sciatic nerves from 10 normal male golden Syr-
ian hamsters were subjected to pure compression. Of
the 21 nerves in this study, 5 nerves were taken from
animals sedated with pentobarbital (75 mg/kg ip) and 16
from animals sedated with isoflurane (2-3.5% titrated to
maintain sedation). All hamsters were purchased from
BioBreeders (Watertown, MA).
Recording the CMAP
Recordings of the CMAP were made from the stain less
steel subdermal needle electrodes (Model E2-48, Astro-
Med, Inc. , West Warwick,) placed in the muscles of the
hind paw. The sciatic nerve was stimulated proximally
at the s pine using similar subdermal needle electrodes
placed in tripolar fashion along the nerve with approxi-
mately 2 mm separation between the electrodes. Stimu-
lation was accomplished with a Grass S88 stimulator
connected to a Grass PSIU6 constant current isolation
unit. The intensity of the stimulus was increased in the
range of 2-15 mA until further increases in the stimulus
intensity produced no apparent increase in the ampli-
tude of the CMAP a t the beginning of the experiment.
This stimulus intensity was used throughout the remain-
der of the experiment. The duration of each stimulus
was chosen as 0.01 msec in order to minimize stimulus
artifact.
The signal from the recording electrodes was ampli-
fied by Grass Model 12 amplifiers (Astro-Med, Inc.,
West Warwick, RI) with t he high frequency filter set at
3kHzandthelowfrequencyfiltersetat0.3Hzanda
gain of 500. Continuous recordings of spontaneous mus-
cle activity were amplified and directed to a loudspeaker
so that spontane ous electromyographic activity could be
documented as they occur in synchrony with the
recorded CMAP data. The signal was digitized using a
NI-USB-6259 16 bit, 1.25 MHz data acquisition module
(National Instruments , Austin, TX) with a sampling rate
of 30,000 Hz/channel. Stimulation was performed at a
rate of 5/sec and the average of 20 traces was computed
prior to saving the response. Thus, CMAP’ swere
recorded every 4 seconds.
Each hamster’s rectal temperature was monitored con-
tinuously and controlled using a warming lamp. The
mean temperature for all nerves was 31 °C with a stan-
dard deviation of 2 .3°C. In addition, continuous record-
ings were made of the output of a Shimpo DFS-1 force
gauge (Shimpo Instruments, Itasca, IL) with a measure-
ment accuracy of 0.1 g. The actual force exerted on the
nerve is properly measured in Newtons with the conver-
sion being the weight measured by the force gauge
divided by 102. For the sake of simplicity, the weight in
grams will often be used instead of the force in Newtons
in the remainder of this paper. The in-house software
controlling each experiment also allowed the experimen-
ter to make annotations that were synchronous with the
CMAP recordings and enabled both manual and auto-
matic marking of the CMAP’s.
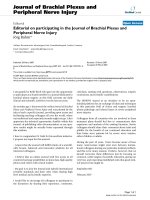
After dissection of the sciatic nerve, standard 1.3 mm
wide vascular loops were wrapped around the nerve as
shown in Figure 1 and then around the force gauge as
the nerve was lifted out of the incision site. It should be
notedthatthepartofthenervesubjecttostretchwas
exposed to atmospheric oxygen throughout the experi-
ment. Measurements were made of the height of the
nerveabovetheincision(hinFigure1)andthelength
of the open incision (L in Figure 1). It is important to
be aware that this is not a model that involves pure
stretch.Sincethenerveispulledawayfromthebody,
there is a component of both stretch and compression.
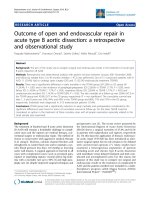
It is also important to be aware that this stretching pro-
duces an elongation of the nerve which was estimated
as
2
L
2
2
+ h
2
−
L
(Figure 2).
Figure 1 Schematic diagram of the nerve stretch experiment.
Stecker et al. Journal of Brachial Plexus and Peripheral Nerve Injury 2011, 6:4
/>Page 2 of 12
Before recording data, the stimulus intensity was
adjusted to obtain a su pramaximal stimulus and the
recording and stimulating electrodes were adjusted to
obtain a high amplitude (> 500 μV) response.
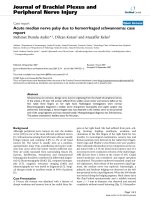
Each experiment occurred in t he stages noted in
Table 1. Figure 3 shows a typical CMAP along with the
typical points that are marked
Statistical analysis
The term latency always refers to the time delay
between the stimulus and the onset of the CMAP
(marker 1 in Figure 3) and the term amplitude refer s to
the maximum peak to peak amplitude. Computation of
conduction velocities assumed a synaptic delay of 0.5
msec [12]. All latencies were corrected to the values
corresponding to 37°C according to the relation derived
from an analysis of baseline latencies [1]:
Latency
co
rr
ected
=Latency∗ e
−.032∗(37−T
)
(1)
where T is the rectal temperature at the time of the
latency measurement and the corrected latency is that
expected at 37°C. In addition, a “ corrected” velocity is
also com puted using instead of the linear distance from
the point o f stimulation to the point of recording that
distance plus the amount the nerve is lengthened by the
stretch.
The duration of the CMAP is measured as the dif fer-
ence between the time of the first and last noticeable
deflectionoftheCMAP(thetimedifferencebetween
points 1 and 4 in Figure 3). Another characteristic of
the CMAP is the area under the curve (AUC) Since the
CMAP generally has components above and below base-
line, the area under the curve is computed using Simp-
son’s rule applied to the absolute value of the CMAP
AUC =
t
max
t
m
a
x
V(t )
d
t
(2)
where t
start
is the shortest time after stimulation at
which reliable data is availabl e and t
stop
is the latest
time (> point 4 in Figure 3) for which a CMAP is pre-
sent. Because the CMAP shape and amplitude depend
Figure 2 Computation of the degree of elongation of the
nerve during stretch.
Table 1 Stages of nerve stretch experiment and comparison with the nerve compression experiment
Stretch Compression
Stage Description Maximum Force (gm) Duration Stage Description Maximum Force (gm) Duration
1 Baseline 0 1 Baseline 0
2 First Stretch 10 3 min*
Mean 3.01
3 First Recovery 0 3 min
4 Second
Stretch
20 3 min*
Mean 2.87
2 First
Compression
20 3 min*
Mean 3.5
5 Second
Recovery
0 3 min 3 First
Recovery
0 3 min
6 Third
Stretch
40 3 min*
Mean 1.78
4 Second Compression 80 3 min*
Mean 1.78
7 Third Recovery 0 3 min 5 Second
Recovery
0 3 min
8 Fourth
Compression
Until 0 Amplitude 3 min*
Mean 4.41
6 Third
Compression
Until 0 Amplitude 3 min*
Mean 1.91
9 Fourth
Recovery
0 3 min 7 Third
Recovery
0 3 min
This table also shows sequence of force application during an experiment. It should be noted that in stretch stages 2 4 and 6 if the CMAP amplitude fell to half
of its baseline, then the stretch was immediately released. In stage 8, when the CMAP amplitude reached zero, the stretch was immediately released. Note that
leg 8 is longer than the other legs because of the extended time it took to gently create the higher stretch forces.
*Planned duration. The number below this is the actual mean duration of the given stage.
Stecker et al. Journal of Brachial Plexus and Peripheral Nerve Injury 2011, 6:4
/>Page 3 of 12
on the exact placement of the recording electrodes, the
actual value of the measured parameters is divided by
the mean value of that parameter in the baseline state
(Stage 1) to arrive at “normalized” parameter values.
A number of statistical techniques are important in
analyzing the data from this experiment. A Spearman
rank correlation analysis (Statistica, Tulsa OK) is used
to determine h ow independent the 5 CMAP measure-
ments described above are. High rank correlation coeffi-
cients between two m easurements would suggest that
they contain similar information and are redundant
descriptors of the data. In addition, a repeated measures
ANOVA using the 5 measurements (MEASURE) as a
repeated measure and the stage (STAGE) as an indepen-
dent variabl e will be used to determi ne whether there is
a statistica lly significant difference between the different
measures in different stages. This analysis is not based
upon the raw data set because this data set has many
measurements for each condition and may thus produce
a false statistical significance because of the large num-
ber of data points. Instead, prior to the ANOVA analy-
sis, a reduced file is create d that has the mean val ue of
each normalized measure in each leg for each nerve.
This is the file that is subjected to statistical analysis. A
similar (STAGE × MEASURE × ANESTHESIA)
repeated measures ANOVA is used to determine
whether anesthesia has any effect on the measures and
whether that effect i s dependent on the degree o f
stretch.
From the neurophysiologic monitoring standpoint, it
was important to determine the time at which the first
statistically significant changes in one of the above dis-
cussed CMAP parameters occurred during the experi-
ment. A simple method to determine this time involved
performing a repeated measures ANOVA in the
normalized variable under study starting with the first
two stages of the experiment and then adding successive
stages to the ANOVA until a statistically significant
effect is noted. The reduced size file is used for this
analysis.
Finally, it was important to investigate the neurophy-
siologic parameters that distinguished nerves subjected
to different stretching forces. This was done by carry-
ing out linear discriminant analyses (Statistica, Tulsa
OK)withthedependentvariablebeingthestageand
the independent variables being all or a subset of the
normalized measurements. When more than one inde-
pendent variable was used a linear stepwise analysis
was carried out with an F to enter of 3 and an F to
remove of 1. Accuracy of the classification was
recorded as were the classification functions. Multiple
such analyses w ere carried out to compare the baseline
CMAP data from that in each stage where there was
nerve compression. This was carried out separately for
each of these stages since the criteria for detection
were likely to be different. These same analyses were
carried out on the data obtained in a previous set of
experiments on the changes in the CMAP during pure
nerve compression [1].
Results
Nerve Breakage
For 16 nerves, information was available on the force at
which the nerve breaks into two different segments.
This occurs at a mean force of 331 gm with a standard
deviation of 55 gm. In 14 nerves, the nerve broke at the
distal incision, in one case the nerve broke at the proxi-
mal incision site and in 1 case, the nerve broke at the
location of the vascular loops.
Force Required to Abolish the CMAP
It should be noted that the CMAP reached zero ampli-
tude at a mean of 73 gm force with a range of 41-120
gm and a standard deviation of 18 gm. This is roughly
22% of the force required to break the nerve.
Changes in CMAP during Nerve Stretch
Independent Variables
There are a large number of potentially interesting vari-
ables describing the CMAP. Because of this, it was
important to know which variables contained unique
information. To achieve this, a Spearman rank correla-
tion analysis (Table 2) is performed with all of the nor-
malized measured variables both when the entire data
set and when the data set contained only the first 7 seg-
ments of the experiment. When the total data set was
used, there was significant statistical correlation between
all of the normalized outcome variables at the p < 0.001
level. The strongest correlations were between the area
Figure 3 Typical CMAP along with the points marked on that
CMAP. Note the definitions of the duration and amplitude.
Stecker et al. Journal of Brachial Plexus and Peripheral Nerve Injury 2011, 6:4
/>Page 4 of 12
under the curve (AUC) and the normalized amplitude
(R = 0.82) and adjusted normalized velocity and normal-
ized velocity (R = .58). The lowest correlation was
between the duration ratios and the amplitude and
between the amplitude measures and the velocity vari-
ables. Overall correlations are lower but still significant
when only the data from the first 7 experiment phases
are used. Although this analysis indicates that the nor-
malized outcome variables are strongly co rrelated, the
Spearman rank correlation coefficients all being less
tha n 0.82 suggests that each of the variables contains at
least some unique information.
The statistical difference between the 5 outcome mea-
sures during the stretch experiment can also be esti-
mated using a repeated measures ANOVA with stage as
the independent factor and the normalized outcome
variables as 5 repeated measures. There was a significant
main effect of STAGE (F(6,140) = 4.1 p < .001) and out-
come variable (MEASURE) (F(4,560) = 8.7 p < .001) as
well as a significant interaction term (F(24,560) = 1.75;
p < .02). This again suggests that the 5 outcome mea-
sures have different dependence on the experimental
stage.
General Trends
The overall results of the experiments are summarized
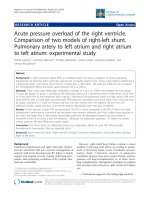
in Figures 4, 5 and 6. Figure 4 shows the changes in the
CMAP peak to p eak amplitude and AUC during each
stage of the experiment. In this figure it is evident that
the AUC drops about 5% at 10 gm stretch, 10% at 20
gm stretch and 20% at 40 gm stretch while recovering
to baseline after 10 and 20 gm stretch but not after
stretchwith40gmorgreater.Withstretchforcesless
than 40 gm, the peak to peak amplitudes show signifi-
cant rebound with higher amplitudes during the recov-
ery periods than baseline although each compression
does produce a relative decrease in amplitude from its
pre-compress ion baseline. Figure 5 shows that there are
significant reductions in the normalized raw velocity
even at the 10 gm and 20 gm stretch conditions but
even with the maximal compression, as long as response
is recordable, the conduction velocity is always greater
than 70% of baseline. Of course, since the nerve length-
ens with stretch, the length of nerve traversed by the
nerve impulses increases. Correcting for this, the actual
speed of nerve conduction may be increased above base-
line for stretch forces less than 40 gm. However, at the
40 gm or more stretch even the corrected velocities
decline. Figure 6 shows that the duration of the CMAP
increases slightly at the lowest stretch tension and then
declines at 40 gm and above.
Individual Variability
The above summary results belie the complexity of the
results from individual nerves. Figure 7a shows the
changes in CMAP’ s during a typical experiment while
Figure 7b shows the actual CMAP waveforms during
this experiment. Figures 7c and 7d show the dependence
of the normalized peak to peak amplitude and the
Table 2 Correlations between measured variables
Normalized
Amplitude
Normalized
AUC
Normalized
Velocity
Normalized
Corrected
Velocity
Normalized
Duration
Normalized
Amplitude
.82 (.63) .14 (.03) .06 ( 06) .21 (.11)
Normalized
AUC
.82 (.63) .20 (.15) .13 (.07) .24 (.19)
Normalized
Velocity
.14 (.03) .20 (.15) .62 (.56) .31 (.20)
Normalized
Corrected
Velocity
.06 ( 06) .13 (.07) .62 (.56) .35 (.27)
Normalized Duration .21 (.11) .24(.19) .31 (.22) .35(.27)
The entries in the table are Spearman rank correlation coefficients. All are significant at p < .001 using all of the stages. Using data only from stages 1-7 gives the
data in parentheses.
Figure 4 Changes in the normalized peak to peak amplitude
(AMP) and the normalized area under the curve (AUC) during
the stretch experiments.
Stecker et al. Journal of Brachial Plexus and Peripheral Nerve Injury 2011, 6:4
/>Page 5 of 12
normalized AUC in two other nerves experiments. It is
clear that the amplitude of the CMAP changes can exhi-
bit many different patterns for stretch at < 40 gm but,
for stretching forces above 40 gm, the CMAP reliably
declines precipitously. The changes in velocit y are more
consistent from nerve to nerve than those of the CMAP
amplitude or AUC, but the effects of stretch on CMAP
duration also show significant variability.
In order to find the first stage for which statistically
significant changes in one of the parameters describing
theCMAPoccurs,asequenceofone-wayANOVA’ s
was carried out using each different parameter as the
dependent variable and STAGE as the independent vari-
able. Although the value of STAGE began at 2 for each
ANOVA,thelargestvalueofSTAGErangedfrom3to
9. In particular, the reduced data file in which only 1
data point is available for each stage is used in order to
avoid the false statistical elevations that might occur as
the result of mult iple measurements in the same stage.
Table 3 indicates that the velocity measures are much
more sensitive to changes at low stretch forces than the
amplitude or d uration measures. In addition, the AUC
ratio is more sensitive than peak to peak amplitude
ratios at low stretch forces and the duration alone does
not show statistically significant changes until the high-
est levels of stretch force.
Anesthesia Effects
One important question is whether the variability seen
in individual stretch experiments is related to the
anesthesia used. In order to see if this were true, a
MEASURE×STAGE×ANESTHESIA5×9×2
repeated measures ANOVA was performed. There were
significant main effects of STAGE (F(8,154) = 17, p <
.001), ANESTHESIA (F(1.154) = 4.8, p = .03) and MEA-
SURE (F(4,616) = 27, p < .001). There was a significant
effect of anesthesia on MEASURE (p < .001) but no sig-
nificant triple interaction of M EASURExSTAGExA-
NESTHESIA. In fact, the velocities and durations are
similar with both anesthesia types but the peak to peak
amplitude and AUC were significantly lower with pento-
barbital anesthesia. The sequential ANOVA analysis
described above was repeated on only the group of
nerves from which data was collected under isoflurane
anesthesia and statistically significant changes were not
found at earlier points in the experiment.
Predictability
Clinically, it is important to know what changes in the
CMAP predict injury to the nerve and to know the sen-
sitivity and specificity of these predictio ns. In order to
answer these questions, multiple linear discriminant
analyses were used with all or specific subsets of the
four outcome variables that would be available in real
time (normalized peak to peak amplitude, normalized
AUC, normalized velocity, and normalized duration) to
classify CMAPs as either from baseline or from one of
the compression stages (2, 4, 6 or 8). A s seen in Table
4, discriminating between baseline and any of the com-
pression states can be done with 85-95% accuracy. The
specificity and sensitivity of the classifier for stage 8 ver-
sus stage 1 is 100% and 84% respectively. When a low
stretch force is applied, the normalized velocity is the
primary contributor to the classification function and
better as a univariable predictor than any of the ampli-
tude related varia bles. With the larger stretch forces (>
40 gm), the normalized peak to peak amplitude or AUC
are better univariable classifiers than the velocity. The
duration used alone cannot provide as good a classifica-
tion as the other outcome variables.
Using multiple different criteria to classify the CMAP
is important in clinical neurophysiology. Figure 8 is a
graphical representation of the perc entage of the traces
in each stage that have normal velocities and amplitudes
Figure 5 Changes in the normalized nerve conduction velocity
during various phases of the nerve stretch experiment.
Figure 6 Changes in the normalized CMAP duration during the
stretch experiments.
Stecker et al. Journal of Brachial Plexus and Peripheral Nerve Injury 2011, 6:4
/>Page 6 of 12
using the univariable classifiers developed by the linear
discriminant analysis (normalized velocity abnormal if <
0.95 and normalized peak to peak amplitude < 0.57).
This figure shows that the probability that both velocity
and amplitude are normal (V+A+) is very low for
stretch > 40 gm. The number where both are abnormal
(V-A-) becomes high only when during the terminal
stretch stage.
For comparison, the same analysis is carried out with
the compression data from the previous paper [1].
These results are summarized in Table 5. This table
demonstrates that, for nerve compression, amplitude is
a better predictor of compressio n induced changes than
velocity even at low compre ssive forces, although the
predictability increases with higher compression forces.
Spontaneous EMG Activity
Clinically, the presence of spontaneous EMG activity is
one of the factors used in d etermining when there is a
significant injury to a nerve. In order to understand how
the presence of spontaneous EMG activity depends on
the stretching force, the CMAP and anesthesia, a factor-
ial ANOVA is performed with EMG activity as the
dependent variable and ANESTHESIA and STAGE as
independent factors. In this analysis there were signifi-
cant main effects of STAGE (F(8,171) = 6.4, p < .001)
Figure 7 Illustration of the differences in the responses of various nerves to stretch and the typical CMAP waveforms recorded.
Table 3 First experiment phase in which a significant
change is noted in the given variable
Variable First Stage
Significant
Significance at First
Significant Stage
Significance
at Stage 9
Normalized
Amplitude
6 .05 < .001
Normalized
AUC
6 .01 < .001
Normalized
Velocity
2 .001 < .001
Normalized
Corrected
Velocity
2 .001 < .001
Normalized
Duration
8 .002 < .001
Stecker et al. Journal of Brachial Plexus and Peripheral Nerve Injury 2011, 6:4
/>Page 7 of 12
but not ANESTHESIA (F(1,171) = 3.2, p < .08) and
there was no significant interaction (F(8,171) = .82, p <
.58). This is consistent with th e observations of Figure 9
that t he presence of EMG activity mainly occurred
during stretch a t the higher force levels and during
recovery after a severe stretch injury. As in the previous
paper [1], EMG activity was more likely when the
CMAP amplitude wa s significantly reduced from
Table 4 Various linear models to predict stretch injury from the outcome variables
Comparison
Stages
Normalized
Peak-Peak
Amplitude
Normalized
AUC
Normalized
Velocity
Normalized
Duration
Best
Classification
Classifier For Compression Stage
1-2 Yes Yes Yes Yes 87%
(96,77)
VEL-0.33DUR < 0.62
Yes Yes No No 63%
(81,46)
AUC < 0.94
Yes No No No 63%
(77,50)
AMP < 0.94
No Yes No No 64%
(95,75)
AUC < 0.95
No No Yes No 85%
(82,46)
VEL < 0.96
No No No Yes 63%
(76,49)
DUR > 1.02
1-4 Yes Yes Yes Yes 84%
(96,71)
-0.25AMP+VEL
+0.45AUC-0.75DUR < 0.35
Yes Yes No No 67%
(85,49)
-0.65AMP+AUC < 0.26
Yes No No No 67%
(98,32)
AMP > 1.2
No Yes No No 65%
(97,70)
AUC < .90
No No Yes No 84%
(92,37)
VEL < .95
No No No Yes 72%
(88,54)
DUR > 1.04
1-6 Yes Yes Yes Yes 93%
(100,81)
-0.074AMP+VEL+
0.24AUC+0.23DUR < 0.97
Yes Yes No No 79%
(97,48)
-0.33AMP+AUC < 0.52
Yes No No No 63%
(100,0)
——
No Yes No No 65%
(100,82)
AUC < .74
No No Yes No 93%
(98,31)
VEL < .85
No No No Yes 70%
(99,17)
DUR < .86
1-8 Yes Yes Yes Yes 96%
(100,84)
0.48AMP+VEL+
0.74AUC-0.98*DUR < 0.68
Yes Yes No No 96%
(100,93)
0.66AMP+AUC < 0.95
Yes No No No 96%
(100,93)
AMP < .30
No Yes No No 95%
(100,61)
AUC < .59
No No Yes No 89%
(99.8,92)
VEL < .75
No No No Yes 81%
(100,32)
DUR < .82
VEL is the normalized velocity, AMP is the normalized peak to peak amplitude, DUR is the normalized duration and AUC is the normalized area under the curve.
Under best classification the top number is the total number of correctly classified cases. The two numbers in parentheses below this are the specificity and
sensitivity.
Stecker et al. Journal of Brachial Plexus and Peripheral Nerve Injury 2011, 6:4
/>Page 8 of 12
baseline. In particular, the value of the normalized peak
to peak amplitude was 0.14 when EMG activity was
heard and 0.80 when no EMG activity was heard (t =
17.5 df = 8624 p < .001). Similarly EMG activity was sig-
nificantly associated with reduced normalized velocities
(0.85 when spontaneous EMG present and 0.92 when
such activity was not present p < .001) a nd reduced
duration ratios (0.93 when EMG present and 1.0 when
EMG absent p < .001).
Does the Effect of Low Stretch Levels Predict the Response
to High Stretch Levels?
Since this experiment involves multiple sequential
stretches of a nerve, it is useful to ask whether the
response to a low level of stretch predicts the response
to a higher level of stretch. As a partial answer to this
question, multiple Spearman rank correlation analyses
were performed between the value of the outcome vari-
ables in one stage and other stages. Because of the large
number of comparisons involved, a Bonferroni
Figure 8 Fraction of traces in each stage fitting the amplitude
and voltage criteria or both. V+ means normalized velocity >
0.95, V-means normalized velocity < = 0.95, A+ indicates peak to
peak amplitude > 0.57, A-means peak to peak amplitude < .57.
Table 5 Various linear models to predict compression injury from the outcome variables
Comparison
Stages
Normalized
Peak-Peak
Amplitude
Normalized
AUC
Normalized
Velocity
Duration Best
Classification
Classifier
1-2 Yes Yes Yes Yes 63%
(58,66)
0.17AMP+VEL
-0.12AUC
-0.18DUR < .86
Yes No No No 54%
(29,75)
AMP < 1.05
No Yes No No 49%
(5,87)
AUC < .88
No No Yes No 49%
(39,72)
VEL < 1.0
No No No Yes 62%
(34,57)
DUR > .98
1-4 Yes Yes Yes Yes 86%
(92,77)
0.61AMP+VEL
+0.55AUC < 1.81
Yes No No No 86%
(99,65)
AMP < .69
No Yes No No 81%
(96,57)
AUC < .74
No No Yes No 76%
(98,36)
VEL < .93
No No No Yes 52%
(34,67)
DUR > 1.29
1-6 Yes Yes Yes Yes 97%
(99.7,91)
AUC-0.12DUR < 0.48
Yes No No No 95%
(99,89)
AMP < .57
No Yes No No 96%
(95,75)
AUC < .58
No No Yes No 85%
(100,62)
VEL < .89
No No No Yes 82%
(95,55)
DUR < .58
Under best classification the top number is the total number of correctly classified cases. The two numbers in parentheses below this are the specificity and
sensitivity.
Stecker et al. Journal of Brachial Plexus and Peripheral Nerve Injury 2011, 6:4
/>Page 9 of 12
correction was made and significance tested at the . 001
level. The results are shown in Table 6. There was a
strong positive correlation (R = 0.8 p < .001) between
the minimum velocity in stage 2 and the minimum velo-
city in stage 4 but not stage 6. Similarly, there was a
positive correlation (R = .85, p < .001) between the
minimum AUC in stage 2 and stage 4 although a similar
relation was not seen for the peak to peak amplitudes.
Therewasalsoapositivecorrelationbetweenthedura-
tion in stages 2 and 4
Discussion
From a clinical standpoint, it is critical to understand
how different types and severity of nerve injury affect
the CMAP so that the CMAP can be used to predict
when there is significant injury to a nerve. Many criteria
have been used to interpret intra-operative neurophysio-
logic studies [13] and these depend on the specifics of
the surgical procedure, the structures at risk and the
specific testing modality [14-18]. Despite this, the most
commonly used criteria for deciding when there is a
significant change in somatosensory evoked potentials is
either a 10% reduction in velocity (or 10% increase in
latency) or a 50% reduction in amplitude. For transcra-
nial motor evoked potential s the criteria are often taken
as complete disappearance of the potential rather than a
50% decrease in amplitude.
One difficulty with clinical studies to assess the best
warning criteria is that it is often impossible to know
the exact timing and magnitude of the forces applied to
a monitored nerve during a surgical procedure. The
other difficulty is that the clinical outcome of the surgi-
cal procedure is not known until the procedure is over.
Thus, if the surgeon is provided a warning based upon
the one set of criteria and corrective action is taken, it
is impossible to decide whether the criteria used to pro-
vide the war ning yielded a fal se positive warning or
accurately identified a true impending injury to the
nerve that was corrected. Hence, experimental studies
on animals can provide useful complementary informa-
tion. In studies of stretch related to limb lengthening,
Jou [19] suggests that a 50% change in a somatosensory
evoked potential amplitude is associated with a clinical
deficit due to stretching of the peripheral nerve. Wall
[9] found that stretching a nerve to a strain of 6% longi-
tudinally in rabbit tibial nerve produced a 70% reduction
in the nerve action potential and at 12% strain conduc-
tion was blocked and never recovered fully. In the cur-
rent study, strain was not longitudinal(infactitwas
primarily perpendicular to t he axis of the nerve) as in
other studies but had a magnitude up to 35%. The result
of Wall were confirmed by studies of Brown [8] on the
CMAP showing that 15% strain p roduced a 99% reduc-
tion in amplitude and Li [10] showing severe conduction
block in nerve action potential at strains of 20%. The
current study did not include outcome measures but the
study of Fowler [11] in rat sciatic nerve indicated that
those nerves could tolerate 50 gm of stretch for 2 min-
utes befor e permanent injury ensued. The hamster scia-
tic nerve is much smaller than the rat and is likely more
susceptible to injury. This provides evidence that the
highest stretch levels used in this study would likely
have been associated with a clinical deficit in a survival
study.
In terms of interpretation criteria, for stretch forces <
40 gm, the main effect is an increase in latency and
decrease in the standard velocity measure during nerve
stretch, with velocity changes as low as 5% being signifi-
cant At stretch forces > 40 gm, the changes in ampli-
tude and area under the curve are more significant and
better able to classify the changes in the CMAP than
the velocity. This is different from the case of a purely
compressive injury where the amplitude of the CMAP is
always the best variable for classifying signals as be ing
from baseline or one of the compression stages even at
Figure 9 Changes in spontaneous electromyographic (EMG)
activity during the experiment.
Table 6 Significant correlations in outcome variables
(minimum normalized amplitude, minimum AUC,
minimum normalized velocity, minimum duration) in
different stages
Stage 2 Stage 4 Stage 6 Stage 8
Stage 2 – (VEL,VEL) N.S. N.S.
(AUC,AUC)
(DUR,DUR)
Stage 4 – N.S. N.S.
Stage 6 – (VEL, VEL)
(VEL, DUR)
Stage 8 –
Statistical significance level set at .001 because of multiple testing.
Stecker et al. Journal of Brachial Plexus and Peripheral Nerve Injury 2011, 6:4
/>Page 10 of 12
low compression force. This is the expected result since
in the pure localized compression model, conduction
abnormalities develop in a segment of the nerve that is
small in comparison to the distance between the stimu-
lating and recording electrodes. Thus, even if there were
a severe reduction in conduction velocity in this small
length, the overall conduction velocity would change lit-
tle. In this particular model, at low stretch forces, the
degree of compression at the point where the vascular
loop transfers force to the nerve is too small to cause
conduction block and so the amplitude do es not
decrease significantly. However at high stretch forces,
there is significant compression at the point where the
vascular loops tran sfer force to the nerve and the ampli-
tude declines. For the low stretch forces, the increase in
conduction velocity is unlikely to be relat ed to a change
in the passive properties of the axon since the diameter
of the axon must decline as its length increases in order
to maintain a constant volume and axons with smaller
diameters have reduced conduction velocities. It also
cannot be related to a change in the distribution of con-
ducting axons since the conduction velocity is computed
from the onset latency and so reflects the velocity of
only the most rapidly conducting axons. Also, because
of the very short stimulus durations used, only the lar-
gest and most rapidly conducting axons are tested in
this paradigm. The most probable explanation is that
stretch affects some of the properties of ion channels
and hence excitability of the axonal membrane [20-23].
This might also be a likely explanation for the fact that
the CMAP amplitude often becomes larger after mild
degr ees of compression than at baseline especiall y if the
small degree of stretch depolarizes the membrane
slightly and increases excitability. An analogous phe-
nomenon is seen after a n axon is exposed to low doses
of 4-aminopyridine which at low doses blocks potassium
channels and increases excitability but at high doses
reduces excitability [24,25]. Howev er, in order to verify
this hypothesis, additional experiments studying the
membrane properties of the stretched axons would be
needed.
Returning to the clinical question regarding CMAP
based decision criteria, it is clear that is important to
look at many different characteristics of the CMAP. Even
5% reductions in the conduction velocity can signa l that
a nerve has been subjected to a significant stretch.
Although changes o f this magnitude in only the velocity
are associated with good recovery after the stretch is
released, they still would provide a valuable early warning
to a surgeon. The peak to peak amplitude is more vari-
able during the ne rve stretch experiments but both velo-
city and amplitude are abnormal when t here is a high
level of stretch. However, a high level of sensitivity of the
CMAP for predicting high stretch levels cannot be
achieved unless as demonstrated in Figure 9, an abnorm-
ality in either velocity or amplitude is considered signifi-
cant. The presence of both increases specificity.
It is important t o be cautious in generalizing this
information to human recordings for at least 2 reasons.
First, in most clinical situations, the nerve is not
exposed to atmospheric oxygen as in this experiment
and so is much more sensitive to the effects of change
in blood flow [26] than the nerves in this experiment.
Second, the composition of and the amount of connec-
tive tissue are different in human and hamster nerves
[27]. Despite these limitation, there are some possible
clinical implications that may be helpful for intra -opera-
tive neurophysiologic monitoring. First, spontaneous
EMG activity may not be the first sign of injury to a
nerve and its presence or absence may be strongly influ-
enced by anesthesia. Second, the type of chan ge to be
expected in the CMAP depends on the mechanism of
injury. Early changes in the velocity occur with stretch
while with compression over small areas, the first
changes are in amplitude. However, when there is signif-
icant injury, there is a decline in amplitude no matter
what the mechanism.
Authors’ contributions
MS participated in study design, data collection, data analysis, and writing of
the paper. KB and MS participated in data collection, data analysis and in
writing of the paper. JW participated in the data analysis and the data
collection. All authors have read and approved the final version of the
manuscript.
Competing interests
The authors declare that they have no competing interests.
Received: 25 July 2010 Accepted: 24 August 2011
Published: 24 August 2011
References
1. Stecker MM, Baylor K, Chan YM: Acute nerve compression and the
compound muscle action potential. J Brachial Plex Peripher Nerve Inj 2008,
3:1.
2. Abe I, Tsujino A, Hara Y, Ichimura H, Ochiai N: Paranodal demyelination by
gradual nerve stretch can be repaired by elongation of internodes. Acta
Neuropathol 2002, 104(5):505-512.
3. Haftek J: Stretch injury of peripheral nerve. Acute effects of stretching on
rabbit nerve. J Bone Joint Surg Br 1970, 52(2):354-365.
4. Maxwell WL, Kosanlavit R, McCreath BJ, Reid O, Graham DI: Freeze-fracture
and cytochemical evidence for structural and functional alteration in the
axolemma and myelin sheath of adult guinea pig optic nerve fibers
after stretch injury. J Neurotrauma 1999, 16(4):273-284.
5. Jafari SS, Nielson M, Graham DI, Maxwell WL: Axonal cytoskeletal changes
after nondisruptive axonal injury. II. Intermediate sized axons. J
Neurotrauma 1998, 15(11):955-966.
6. Maxwell WL, Graham DI: Loss of axonal microtubules and neurofilaments
after stretch-injury to guinea pig optic nerve fibers. J Neurotrauma 1997,
14(9):603-614.
7. Ikeda K, Tomita K, Tanaka S: Experimental study of peripheral nerve injury
during gradual limb elongation. Hand Surg 2000, 5(1):41-47.
8. Brown R, Pedowitz R, Rydevik B, Woo S, Hargens A, Massie J, Kwan M,
Garfin SR: Effects of acute graded strain on efferent conduction
properties in the rabbit tibial nerve. Clin Orthop Relat Res 1993, 288-294,
(296)(296).
Stecker et al. Journal of Brachial Plexus and Peripheral Nerve Injury 2011, 6:4
/>Page 11 of 12
9. Wall EJ, Massie JB, Kwan MK, Rydevik BL, Myers RR, Garfin SR: Experimental
stretch neuropathy. Changes in nerve conduction under tension. J Bone
Joint Surg Br 1992, 74(1):126-129.
10. Li J, Shi R: Stretch-induced nerve conduction deficits in guinea pig ex
vivo nerve. J Biomech 2007, 40(3):569-578.
11. Fowler SS, Leonetti JP, Banich JC, Lee JM, Wurster R, Young MR: Duration
of neuronal stretch correlates with functional loss. Otolaryngol Head Neck
Surg 2001, 124(6):641-644.
12. Katz B, Miledi R: The effect of temperature on the synaptic delay at the
neuromuscular junction. J Physiol 1965, 181(3):656-670.
13. Moller AR: Intra-Opeative Neurophysiologic Monitoring Totowa, NJ: Humana
Press; 2005.
14. Stecker MM, Cheung AT, Patterson T, Savino JS, Weiss SJ, Richards RM,
Bavaria JE, Gardner TJ: Detection of stroke during cardiac operations with
somatosensory evoked responses. J Thorac Cardiovasc Surg 1996,
112(4):962-972.
15. Neuloh G, Schramm J: Are there false-negative results of motor evoked
potential monitoring in brain surgery? Cen Eur Neurosurg 2009,
70(4):171-175.
16. Krammer MJ, Wolf S, Schul DB, Gerstner W, Lumenta CB: Significance of
intraoperative motor function monitoring using transcranial electrical
motor evoked potentials (MEP) in patients with spinal and cranial
lesions near the motor pathways. Br J Neurosurg 2009, 23(1):48-55.
17. Keyhani K, Miller CC, Estrera AL, Wegryn T, Sheinbaum R, Safi HJ: Analysis
of motor and somatosensory evoked potentials during thoracic and
thoracoabdominal aortic aneurysm repair. J Vasc Surg 2009, 49(1):36-41.
18. More RC, Nuwer MR, Dawson EG: Cortical evoked potential monitoring
during spinal surgery: sensitivity, specificity, reliability, and criteria for
alarm. J Spinal Disord 1988, 1(1):75-80.
19. Jou IM, Lai KA, Shen CL, Yamano Y: Changes in conduction, blood flow,
histology, and neurological status following acute nerve-stretch injury
induced by femoral lengthening. J Orthop Res 2000, 18(1):149-155.
20. Sachs F: Stretch-activated ion channels: what are they? Physiology
(Bethesda) 2010, 25(1):50-56.
21. Quasthoff S: A mechanosensitive K+ channel with fast-gating kinetics on
human axons blocked by gadolinium ions. Neurosci Lett 1994, 169(1-
2):39-42.
22. Lin YW, Cheng CM, Leduc PR, Chen CC: Understanding sensory nerve
mechanotransduction through localized elastomeric matrix control. PLoS
One 2009, 4(1)
:e4293.
23. Lundbaek JA, Birn P, Hansen AJ, Sogaard R, Nielsen C, Girshman J,
Bruno MJ, Tape SE, Egebjerg J, Greathouse DV, Mattice GL, Koeppe RE,
Andersen OS: Regulation of sodium channel function by bilayer
elasticity: the importance of hydrophobic coupling. Effects of Micelle-
forming amphiphiles and cholesterol. J Gen Physiol 2004, 123(5):599-621.
24. Baylor K, Stecker MM: Peripheral nerve at extreme low temperatures 2:
pharmacologic modulation of temperature effects. Cryobiology 2009,
59(1):12-18.
25. Shi R, Blight AR: Differential effects of low and high concentrations of 4-
aminopyridine on axonal conduction in normal and injured spinal cord.
Neuroscience 1997, 77(2):553-562.
26. Lundborg G, Rydevik B: Effects of stretching the tibial nerve of the rabbit:
A preliminary stud of the intraneural ciruculation and the barrier
function of the perineurium. J Bone and Joint Surgery 1973, 55-
B(2):390-401.
27. Liu CT, Benda CE, Lewey FH: Tensile strength of human nerves; an
experimental physical and histologic study. Arch Neurol Psych 1948,
59(3):322-336.
doi:10.1186/1749-7221-6-4
Cite this article as: Stecker et al.: Acute nerve stretch and the
compound motor action potential. Journal of Brachial Plexus and
Peripheral Nerve Injury 2011 6:4.
Submit your next manuscript to BioMed Central
and take full advantage of:
• Convenient online submission
• Thorough peer review
• No space constraints or color figure charges
• Immediate publication on acceptance
• Inclusion in PubMed, CAS, Scopus and Google Scholar
• Research which is freely available for redistribution
Submit your manuscript at
www.biomedcentral.com/submit
Stecker et al. Journal of Brachial Plexus and Peripheral Nerve Injury 2011, 6:4
/>Page 12 of 12