báo cáo khoa học: "Prognostic significance of STAT3 and phosphorylated STAT3 in human soft tissue tumors - a clinicopathological analysis" ppt
Bạn đang xem bản rút gọn của tài liệu. Xem và tải ngay bản đầy đủ của tài liệu tại đây (2.62 MB, 9 trang )
RESEARCH Open Access
Prognostic significance of STAT3 and
phosphorylated STAT3 in human soft tissue
tumors - a clinicopathological analysis
Diana David
1
, Lakshmy M Rajappan
2
, Krishna Balachandran
3
, Jissa V Thulaseedharan
1
, Asha S Nair
1*
and
Radhakrishna M Pillai
1
Abstract
Background: Signal transducer and activator of transcription 3 (STAT3) is a key signaling molecule and a central
cytoplasmic transcription factor, implicated in the regulation of growth. Its aberrant activation has been
demonstrated to correlate with many types of human malignancy. However, whether constitutive STAT3 signaling
plays a key role in the survival and growth of soft-tissue tumors is still unclear and hence needs to be elucidated
further. In our study we examined the expression levels of STAT3 and pSTAT3 in different grades of soft tissue
tumors and correlated with its clinicopathological characteristics.
Methods: Expression levels of STAT3 and pSTAT3 in soft tissue tumors were studied using Immunohistochemistry,
Western blotting and Reverse transcriptase- PCR and correlated with its clinicopathological characteristics using Chi
squared or Fisher’s exact test and by logistic regression analysis. Statisti cal analysis was done using Intercooled
Stata software (Intercooled Stata 8.2 version).
Results: Of the 82 soft tissue tumor samples, fifty four (65.8%) showed immunoreactivity for STAT3 and twenty
eight (34.1%) for pSTAT3. Expression of STAT3 and pSTAT3 was significantly associated with tumor grade (P <
0.001; P < 0.001), tumor location (P = 0.025; P = 0.027), plane of tumor (P = 0.011; P = 0.006), and tumor necrosis
(P = 0.001; P = 0.002). Western blotting and RT-PCR analysis showed increased expression of STAT3 and p-STAT3 as
grade of malignancy increased.
Conclusion: These findings suggest that constitutive activation of STAT3 is an important factor related to
carcinogenesis of human soft tissue tumors and is significantly associated with its clinicopathological parameters
which may possibly have potential diagnostic implications.
Keywords: STAT3 pSTAT3, Soft tissue tumors
Background
STATs comprise a family of seven proteins (STAT 1, 2,
3, 4, 5a, 5b, and 6) unique in their ability both to trans-
duce extracellular signals and regulate transcription
directly [1]. STAT3 normally resides in the cytoplasm
and is often constitutively activated in many human
cancer cells and tumor tissues and has been shown to
induce expression of genes involved in cell prolifera tion
and survival [2,3]. Constitutively activated STAT3
correlates with a more malignant tumor phenotype,
resistance to chemotherapy and is also associated with
decreased survival in some cancers [4,5]. Recently,
STAT3 has been implicated as a promising target for
therapeutic intervention in cancer [6].
Soft tissue tumors com prise of a group of relatively
rare, anatomically and histologically diverse neoplasms
derived from tissues of mesodermal and ectodermal
layer. Clinically, soft tissue tumors range from totally
benign to highly malignant neoplasms. Many are of an
intermediate nature, which typically implies aggressive
local behavior with a low to moderate propensity to
metastasize. The incidence of soft tissue tu mors is low
* Correspondence:
1
Integrated Cancer Research, Rajiv Gandhi Centre for Biotechnology, Kerala,
India
Full list of author information is available at the end of the article
David et al. Journal of Experimental & Clinical Cancer Research 2011, 30:56
/>© 2011 David et al; licensee BioMed Central Ltd. This is an Open Access article distributed under the terms of the Creative Commons
Attribution License ( which permits unrestricted use, distribution, and reprod uction in
any medium, provide d the original work is properly cited.
accounting for 1% of adult malignancies and 15% of
pediatric malignancies [7]. Mortality, on the other hand,
is high; the average five-year survival rate is only 60%.
Most soft tissue tumors arises de novo, but a small
number originates in injured tissue s uch as scars or
radiation-exposed areas [8]. Sarcomas possess specific
molecular characteristics and frequently present distinct
diagnostic problems, and even many of the bett er-char-
acterized tumors still lack reliable prognostic markers.
New specific molecul ar genetic markers are expected to
become increasingly useful in t he clinical evaluation of
such tumors [9].
Considering the important role of STAT3 and
pSTAT3 in various cancers, our study aimed to analyze
the expression levels of S TAT3 and pSTAT3 in soft t is-
sue tumors by Immunohistochemistry, Western blotting
and RT-PCR. In addition we compared STAT3 and
pSTAT3 expression with clinicopathologic parameters
of soft tissue tumors.
Methods
Patients and specimens
Primary surgical specimens were obtained from 82
patients (51 males and 31 females) who were clinically
diagnosed for soft tissue tumors, from Department of
General Surgery, Govt. Medical College Hospital, Thiru-
vananthapuram, India between 2007 and 2008 following
approval from the Human Ethics Committee. Of the 82
cases, 48 were malignant, 25 benign, and 9 were of
intermediate grade. Tumor stages were classified accord-
ing to the revised GTNM (grade-tumor-node-metasta-
sis) classification of WHO (2002).
Histopathologic examination of soft tissue tumors
The present study correlated the gross pathological fea-
tures of soft tissue tum ors like tumor size, location,
depth, circumscription, encapsulation and p resence of
necrosis with clinical parameters. Histopathological
parameters were studied using 5 μm t hick paraffin sec-
tions stained with HematoxylinandEosinandthe
tumors were broadly classified into benign, intermediate
and malignant.
Immunohistochemistry and evaluation
Resected specimens were fixed with 10% paraformalde-
hyde and embedded in paraffin blocks. Five-micro-
meter sections of 82 representative soft tissue tumor
blocks were used for immunohistochemical analysis.
Sections were deparaffinized in xylene and rehydrated
in graded alcohols and water. Endogenous peroxidase
activity was b locked via treatment with 2.5% hydrogen
peroxide for 20 minutes. A ntigen retrieval was per-
formed by placing the slides in boiling citric acid buf-
fer (10 mM sodium citrate and 10 mM citric acid) for
15 minutes. Sections were treated with protein-block-
ing solution for 30 minute s and primary antibodies
such as STAT3 and pSTAT3 (Santa Cruz Biotechnol-
ogy, Inc, CA) were applied at a 1:100 and 1:50 dilution
and incubated ove rnight at 4°C. After several rinse s in
phosphate-buffered saline, the sections were incubated
in biotinylated secondary antibody for 30 minutes. The
bound antibodies were detected by a strep tavidin-bio-
tin method, with a Vecta Elite A BC staining kit (Vec-
tor Laboratories). The slides were rinsed in phosphate-
buffered saline, exposed to diaminobenzidine, and
counterstained with Mayer’ s hematoxylin. For the
tumor tissues, nuclear STAT3 and pSTAT3 (Tyr 705)
staining were recorded as the numbers of STAT3 and
pSTAT3-positive nuclei, divided by the total number
of nuclei of at least 10 fields, and then expressed as a
percentage. Cytoplasmic positivity of STAT3 and
pSTAT3 were measured depending on the intensity of
immunoreactivity (independently scored by D.D, AN,
and LMR) a nd scored as mild (+), moderate (++), and
intense (+++).
Immunoblot analysis
Protein extracts were prepared by homogenizing fresh
tissue in lysis buffer comprising 10% NP40, 5 M NaCl, 1
M HEPES, 0.1 M DTT, 0.1 M EGTA, 0.1 M EDTA,
protease inhibitors (Sigma) and differential centrifuga-
tion (14000 rpm for 10 minutes). The protein concen-
trations were determined using Bradford’s assay and 60
μg of proteins were resolved by 10% SDS-PAGE, and
the separated proteins were elec trotransferred onto
nitrocellulose membrane (Amersham Pharmacia Bio-
tech). After preblocking these membranes with 5%
skimmed milk, they were treated with antibodies against
STAT3 (1:200, Santa Cruz Biotechnology), pSTAT3
(Tyr 705) (1:200, Santa Cruz Biotechnology), and b-
actin (1:5000, Sigma) as primary antibodies and incu-
bated overnight at 4ºC. Horseradish peroxidase-conju-
gated antirabbit (1:5000, Santa Cruz Biotechnology) and
antimouse (1:5000, Santa Cru z Biotechnology) antibo-
dies were used as secondary antibodies and incubated
for 1 h at room temperature. Immunoreactive bands
were developed with an ECL system (Amersham Phar-
macia Biotech, Uppsala, Sweden).
Reverse Transcription - PCR
Total RNA was isolated from fresh tissues using TRIzol
(Invitrogen) reagent. 10μg of total RNA was converted to
cDNA using M -MLV Reverse Transcriptase (Promega)
in a 25μl react ion. The relative expression of STAT3 was
analyzed using semi-quantitative reverse transcription-
PCR with glyceraldehyde-3-phosphate dehydrogenase
(GAPDH) as an internal control. T he primers used were
STAT3 (sense), 5’-GGAGGAGTTGCAGCAAAAAG-3’;
David et al. Journal of Experimental & Clinical Cancer Research 2011, 30:56
/>Page 2 of 9
STAT3 (antisense) 5’ -TGTGTTTGTGCCCAGAATGT-
3’ ; GAPDH (sense), 5’ -TTGGTATCGTGGAAG-
GACTCA-3’ ; GAPDH (antisense), 5’ -TGTCATCA-
TATTTGGCAGGTT-3’ .The RT-PCR reaction mixture
contained 5μl of 10× reaction b uffer, 5μlofcDNAtem-
plate, 0.5 μL each of forward and reverse primers, and 0.5
μL of Dr Taq DNA polymerase (Biogene) in a final
volume of 50 μL. The reaction was done at 94°C for 4
min (Initial den aturation), 94°C for 30 s (Denaturation),
60°C for 40 s (Annealing), 72°C for 1 min and 30 s
(Extension), and 72°C for 7 min (Final extension) for 35
cycles. Analysis of amplified products was done on 2%
agarose gel and visualized using Fluor-S™ MultiImager
(Bio-Rad). The PCR products were quantified by densito-
metric analysis, using Bio-Rad Quantity One software.
The mRNA levels o f STAT3 were normalized to human
GAPDH mRNA levels. A 100-bp ladder was used as a
size standard.
Statistical analysis
Statistical analysis was performed using Intercooled
Stata software (Intercooled Stata 8.2 version). The clini-
copathological characteristics of the patients were com-
pared between tumor grade, and expression of STAT3
and pSTAT3, using Chi squared or Fisher’ s exact test.
The limit of statistic al significance was set at P < 0.05.
The effect of clinicopathologic characteristics on STAT3
and pSTAT3 expression were estimated with Odds
Ratio (OR) and their 95% Confidence Interval (CI)
derived from logistic regression analysis. Sensitivity and
specificity of STAT3 and pSTAT3 expression were
determined by taking the histopathological grade of
tumor as the Gold standard.
Results
Clinicopathological characteristics of soft tissue tumors
The patients included in this study were aged from 1 to
80 years (Mean 42, SD = 19.8). Both age and sex of the
patients showed significant association with tumor grade
(P = 0.012; P = 0.04). Tumor size and tumor location
also showed significant association with grade of the
tumor (P = 0.004; P = 0.009). While most of the benign
tumors occurred in the extremities (68%), the lower
extremities (45.8%) followed by the retroperitoneum
(27.1%) were the favored sites for malignant tumors.
Tumors of intermediate grade were more common in
the trunk (55.6%). Most of the soft tissue tumors in the
present study were located in the subcutaneous plane
(52.4%) followed by the muscular plane (28%).
Among the 82 tumors studied, 38 were well-circum-
scribed and showed significant association with tumor
grad e (P < 0.001). Necrosis was studied in all the tumors
and significant association was observed with the grade of
the tumor (P < 0.001). Tables 1 list the clinicopathological
characteristics of the soft tissue tumors selected for the
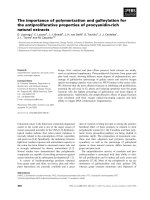
study. Pathologic features of the representative benign,
intermediate and malignant soft tissue tumors were given
in Figure 1.
Immunohistochemistry for STAT3 and pSTAT3
Overexpression of STAT3 and p-STAT3 correlates with
tumor grade
Immunohistochemical staining revealed both cytoplas-
mic a nd nuclear localization of STAT3 and pSTAT3 in
benign, i ntermediate, and malignant soft tissue tumors
[Figure2].Twoof25benigntumorsexpressedmild
cytoplasmic positivity for STAT3 whereas 6 intermediate
tumors exhibited both mild and moderate cytoplasmic
positivity for STAT3. Thirty seven of the 46 malignant
tumors showed intense STAT3 expressio n in the cyto-
plasm whereas the remaining 9 tissues showed moderate
and mild cytoplasmic positivity. pSTAT3 expression was
not observed in benign tumors. Both mild and moderate
cytoplasmic expression of pSTAT3 was observed in
intermediate tumors and only malignant tumors exhib-
ited intense cytoplasmic expression for pSTAT3.
The percentages of p ositive nuclear expression of
STAT3 and pSTAT3 in benign, intermediate, and malig-
nant soft tissue tumors were also analyzed. The inter-
mediate tumors expressed 52% nuclear expression for
STAT3 while this was 85% in malignant tumors.
Nuclear expression of pS TAT3 in intermediate and
malignant tumors was 47% and 60% respectively.
Nuclear expression of STAT3 and pSTAT3 were not
observed in benign soft tissue tumors. Tables 2 lists and
summarize the percentages of expressed STAT3 and
pSTAT3 in all tumor groups.
Immunoblot analysis of STAT3 and pSTAT3 in soft tissue
tumors
STAT3 and p-STAT3 are constitutively expressed in soft
tissue tumors
The expression levels of STAT3 and pSTAT3 were ana-
lyzed by i mmuno blotti ng in r ep resenta tive soft tissue t umor
samples [Figure 3]. STAT3 was found to be overexpressed
in malignant tumors, when compared with intermediate
and benign soft tissue tumors. The malignant tumor sam-
ples showed high level expression of pSTAT3 when com-
pared with intermediate and benign soft tissue tumors. The
data also revealed that STAT3 and pSTAT3 band intensi-
ties c orrelated t o immunohistochemistry results.
Expression of STAT3 at the mRNA level in soft tissue
tumors
STAT3 gene expression correlates with tumor grade in soft
tissue tumors
Reverse transcription -PCR was done to analyze the
mRNA level expr essi on of STAT3 in representative soft
David et al. Journal of Experimental & Clinical Cancer Research 2011, 30:56
/>Page 3 of 9
tissue tumor samples [Figure 4]. A high level expression
of STAT3 mRNA was observed in tumor samples.
Among the tumor samples, STAT3 mRNA was found
to be overexpressed in malignant and intermediate
tumors when compared with benign soft tissue tumors
[Figure 5]. Together these results indicate that fluctua-
tions observed in STAT3 mRNA expression correlated
with its protein level expression.
Statistical analysis
Expression of STAT3 and pSTAT3 showed statistically
signi ficant association with histopathological parameters
as evidenced by Chi squared and Fisher’s exact test [See
Additional file 1 Table S1]. STAT3 and pSTAT3 expres-
sions were significantly associated with grade of the
tumor (P < 0.001). Malignant tumors were 107.3 times
more likely to express STAT3 (OR = 107.3, 95% CI:
Table 1 Clinicopathologic characteristics of soft tissue tumors
Characteristics Grade of tumor
Benign Intermediate Malignant Total P- value
Number of patients 25(100) 9(100) 48(100) 82(100)
Sex
Male 16(64) 2(22.2) 33(68.7) 51(62.2) 0.04
Female 9(36) 7(77.8) 15(31.3) 31(37.8)
Age
< 20 6(24) 0(0) 7(14.6) 13(15.8) 0.012
20-39 7(28) 6(66.7) 8(16.7) 21(25.6)
40-59 9(36) 0(0) 21(43.7) 30(36.6)
> = 60 3(12) 3(33.3) 12(25) 18(21.9)
Tumor size
< = 5 cm 16(64) 2(22.2) 13(27.1) 31(37.8) 0.004
>5 & < = 10 cm 7(28) 3(33.3) 12(25) 22(26.8)
>10 & < = 15 cm 0(0) 4(44.4) 11(22.9) 15(18.3)
>15 & < = 20 cm 2(8) 0(0) 7(14.6) 9(11)
>20 cm 0(0) 0(0) 5(10.4) 5(6.1)
Tumor location
Upper limb 8(32) 0(0) 5(10.4) 13(15.8) 0.009
Lower limb 9(36) 4(44.4) 22(45.8) 35(42.7)
Thorax 6(24) 5(55.6) 7(14.6) 18(21.9)
Head & neck 1(4) 0(0) 1(2.1) 2(2.4)
Retroperitoneum 1(4) 0(0) 13(27.1) 14(17.1)
Plane of tumor
Subcutis 21(84) 6(66.7) 16(33.3) 43(52.4) < 0.001
Muscular plane 3(12) 3(33.3) 17(35.4) 23(28.0)
Body cavity 1(4) 0(0) 15(31.2) 16(19.5)
Circumscription
No 5(20) 7(77.8) 32(66.7) 44(53.7) < 0.001
Yes 20(80) 2(22.2) 16(33.3) 38(46.3)
Capsulation
No 20(80) 9(100) 44(91.7) 73(89.0) 0.232
Yes 5(20) 0(0) 4(8.3) 9(11)
Necrosis
No 25(100) 7(77.8) 29(60.4) 61(74.4) < 0.001
Yes 0(0) 2(22.2) 19(39.6) 21(25.6)
David et al. Journal of Experimental & Clinical Cancer Research 2011, 30:56
/>Page 4 of 9
20.24-569), and 7.5 times more likely to express
pSTAT3 (OR = 7.5, 95% CI: 2.28-24.5) when benign or
intermediate tumor is the reference [Table 3]. The sen-
sitivity and the specificity of STAT3 were 95.8% and
76.5% and pSTAT3 were 50% and 88.2%, respectively,
with histopathological grade. In addition, Table 4 repre-
sents t he association between clinicopathologic chara c-
teristics and expression of STAT3 in malignant soft
tissue tumors.
Clinicopathological significance of STAT3 expression in soft
tissue tumors
In our study, the expression of STAT3 in soft tissue
tumors showed significant association with tumor size
(OR = 19.38, 95% CI: 2.25-166.5, P = 0.003), tumor
location (OR = 9.6, 95% CI:1.48-62.15, P = 0.025), plane
of the tumor (OR = 8.05, 95% CI:1.62-39.8, P = 0.011),
tumor c ircumscription (P = 0.005) and tumor necrosis
(OR = 18.13, 9 5% CI: 2.28-143.6, P = 0.001). However,
no significant association was observed between STAT3
expression with age group (P = 0.34) and tumor capsu-
lation (P = 0.21).
Clinicopathological significance of pSTAT3 expression in
soft tissue tumors
Expression of pSTAT3 in soft tissue tumors also exhib-
ited significant association with tumor location ( OR =
16, 95% CI: 1.6-159.3, P = 0.027), plane of tumor (P =
0.006) and tumor necrosis (OR = 4.98, 95% CI: 1.7-14.3,
P = 0.002). However, pSTAT3 expression showed no
significant association with age of the patients (P =
0.321), tumor size (P = 0.141), tumor circumscription (P
= 0.991), and capsulation (P = 0.957).
Discussion
STAT3 is a major mediator of tumorigenesis, and has
been shown to be vital for tumor cell growth, prolifera-
tion, and apoptosis [10-12]. Constitutive activation o f
STAT3 has been documented in ovarian, breast, colon,
prostate, and several other types of cancer [5,13-16].
Although the contribution of STAT3 to epithelial can-
cers and hematologic malignancies has been described
in detail, little is known on the role of S TAT3
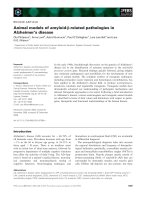
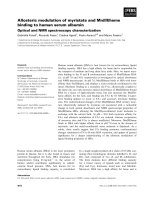
Figure 1 Pathologic features of benign, intermediate, and
malignant soft tissue tumors. Benign tumor (A) shows cystic
degeneration and nuclear palisading and (B) shows nests of
granular cells separated by fibrocollagenous tissue. The
intermediate grade tumors (C) shows solid, cellular lobules
consisting of plump endothelial cells lining tiny rounded vascular
spaces with inconspicuous and (D) shows proliferation of spindle
cells in inflammatory background. The malignant soft tissue tumors
(E) shows epithelioid cells arranged in nests, with a pseudoalveolar
pattern and (F) shows lobulated vascular neoplasm composed of
small blue round cells in sheets and rosettes. Image magnifications
are 400×.
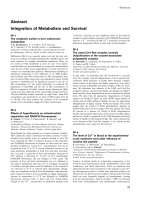
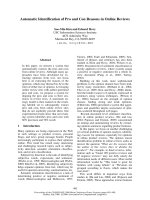
Figure 2 Expression of immunohistochemical markers, STAT3
(A, C, E) and p-STAT3 (B, D, F), in benign (A and B);
intermediate (C and D); malignant (E and F) soft tissue tumors.
The nuclei were counterstained with hematoxylin blue. Image
magnifications are 400×.
David et al. Journal of Experimental & Clinical Cancer Research 2011, 30:56
/>Page 5 of 9
dysregulation in sarcomas. The purpose of this study
was to investigate the expression levels of STAT3 and
pSTAT3 in various soft tissue tumors and to associate it
with its clinicopathological characteristics. Our data sug-
gests that STAT3 may be a key regulatory molecule in
the malignant potential of soft tissue tumors and can be
piloted as diagnostic marker in soft tissue tumors.
In the current study we observed a distinct pattern of
STAT3 and pSTAT3 expression in soft tissue tumors,
which differed significantly between benign, intermedi ate
and malignant tumors and showed significant associa tion
with various histopathological parameters. Age group is
not associated with STAT3 (P = 0.58) and pSTAT3 (P =
0.321) expressions. However, STAT3 and pSTAT3
expressions were significantly associated with grade o f
the tumor (P < 0.001). 46 out of the 48 malignant tumors
(95.8%) and 6 out of the 9 intermediate tumors (66.7%)
were STAT3 positive. Malignant tumors were 107.3
times more likely to express STAT3, when benign or
intermediate tumor is the reference (OR = 107.3, 95% CI:
20.24-569). 24 out of the 48 malignant tumors (50%) and
4 out of the 9 intermediate tumors (44.4%) were pSTAT3
positive. Malignant tumors were 7.5 times more likely to
express pSTAT3, when benign or intermediate tumor is
the reference (OR = 7.5, 95% CI: 2.28-24.5 ). This is in
agreement with the study by Chun et al [17], were it was
observed that STAT3 sig naling pathway is constitutively
activated in rhabdomyosarcoma and osteosarcoma cells.
It has been previously reported that STAT3 is o verex-
pressed in cutaneous angiosarc oma, pyogenic granuloma,
Ewing’s sarcoma, Kaposi’ s sarcoma and in primary effu-
sion lymphomas [18-20].
The other histopathological factors associated with
STAT3 and pSTAT3 expressions we re tumor location
(P = 0.025, P = 0. 027), plane of the tumor (P = 0.011, P
= 0.006) and tumor ne crosis (P = 0.001, P = 0.002). Out
of 35 tumors in the lower extremities, 27(74.1%) were
STAT3 positive and 15(42.9%) were pSTAT3 positive.
12 out of the 14 tu mors in the retroperitoneum (85.7%)
were STAT3 positive while pSTAT3 positives were 8
(57.1%). Tumors in the retroperitoneum were more
expressive of STAT3 (OR = 9.6, 95% CI: 1.48-62.15) and
pSTAT3 (OR = 16, 95% CI: 1.6-159.3) when upper
extremity is the reference. Tumor plane exhibited a
positive trend with expression of STAT3 and pSTAT3,
which were expressed in 51.16% and 18.6% of subcuitis,
followed by the muscular plane (78.3% and 47.8%)) and
body cavity (87.5% and 56.3%). Odds ratio for the mus-
cular plane is 4.14 (95% CI 1.3-13.2) and body cavity is
8.05(1.62-39.8) for STAT3 expression. Odds ratio for
muscular plane is 4.01(1.31-12.32) and body cavity is 5.6
(1.6-19.6) for pSTAT 3 when subcuitis as the reference.
Out of the 21 tumors, which showed necrosis, 20 were
found to be STAT3 positive (95.24%) and 1 3 were
found to be pSTAT3 positive (61.9%). Tumors with
necrosis were 18.13 times more likely to express STAT3
(OR = 18.13, 95% CI: 2.28-143.6) and 4.98 times more
likel y to express pSTAT3 (OR = 4.98, 95% CI: 1.7-14.3) ,
when non-necrotic tumors are the reference.
Table 2 Expression levels of STAT3 and pSTAT3 in benign, intermediate and malignant human soft tissue tumors.
STAT3 pSTAT3
Cytoplasm n (%) Nucleus n (%) Cytoplasm n (%) Nucleus n(%)
Mild (+) Moderate (++) Intense(+++) Mild (+) Moderate (++) Intense(+++)
Benign(n = 25) 2(8) 0(0) 0(0) 0(0) 0(0) 0(0) 0(0) 0(0)
Intermediate(n = 9) 2(8) 4(44.4) 0(0) 5(55) 3(33.3) 1(11.1) 0(0) 4(44)
Malignant(n = 48) 2(8) 7(14.6) 37(77.1) 42(87.5) 7(14.6) 12(25) 5(10.4) 24(50)
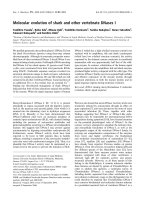
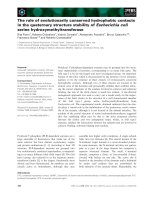
Figure 3 Representative Western blotting analysis of STAT3
and pSTAT3 in soft tissue tumor extracts. Increased expression
of STAT3 and pSTAT3 were observed in high and intermediate
grade soft tissue tumors compared to benign tumors. Lane 1:
malignant soft tissue tumor; lane 2: intermediate soft tissue tumor;
lane 3: benign soft tissue tumor. b-actin was used to verify equal
gel loading.
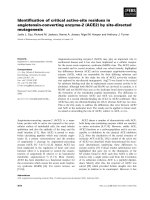
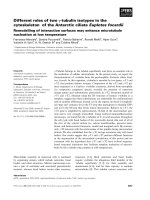
Figure 4 Representative ethidium bromide stained 2% agarose
gel showing semiquantitative Reverse Transcriptase
polymerase chain reaction (RT-PCR) analysis and quantification
of STAT3 (298 bp) mRNA expression at different stages of soft
tissue tumors v/s GAPDH (269 bp) (A and B). Lane 1: benign soft
tissue tumor; lane 2: intermediate soft tissue tumor; lane 3:
malignant soft tissue tumor. A 100-bp ladder was used as a size
standard.
David et al. Journal of Experimental & Clinical Cancer Research 2011, 30:56
/>Page 6 of 9
In addition, tumor size also exhibited significant asso-
ciation with STAT3 expression (P = 0.003). Tu mors
greater than 10 cm and less than or equal to 15 cm in
size were 19.38 times more likely to express STAT3
when tumors less than 5 cm is the reference (OR =
19.38, 95% CI: 2.25-166.5). We observed that tumors
greater than 15 cm in size were 4.57 times more likely
to express pSTAT3 when tumors less than 5 cm is the
reference (OR = 4.57, 95% CI: 1.18-17.68). Significant
association was observed between STAT3 expression
and tumor circumscription (P = 0.001). Out of the 44
poorly circumscribed tumors 35 were STAT3 positive
(79.55%). But pSTAT3 expression is not associated with
tumor circumscription (P = 0.991). STAT3 and pSTAT3
expressions were not determined to associate with
tumor capsulatio n (P = 0.21). However, whether STAT3
Figure 5 The mRNA levels of STAT3 were normalize d to
human GAPDH mRNA levels and was analyzed by Spearman’s
rank correlation coefficient which gives a value of Spearman’s
rho (r) = 1, and p-value < 0.001, indicating a significant
positive correlation. Bar graph shows mean value ± S.E. from three
independent experiments.
Table 3 Univariate logistic regression analysis: Significant association between expression of STAT3 and pSTAT3 and
clinicopathological characteristics of soft tissue tumors.
Clinicopathological characteristics STAT3 pSTAT3
OR 95% CI P-value OR 95% CI P-value
Grade of tumor
Benign or intermediate 1 1
Malignant 107.3 20.24-569 < 0.001 7.5 2.28-24.5 0.001
Tumor Size
<=5cm 1 1
>5 & < = 10 cm 2.42 0.78-7.45 0.123 1.96 0.58-6.57 0.276
>10 & < = 15 cm 19.38 2.25-166.5 0.007 1.71 0.43-6.71 0.439
>15 cm 2.7 0.58-13.16 0.2 4.57 1.18-17.68 0.028
Tumor Location
Upper limb 1 1
Lower limb 4 1.05-15.2 0.042 9 1.05-77.03 0.045
Thorax 1.6 0.37-6.8 0.525 3.4 0.34-34.99 0.299
Head & neck 1.6 0.08-31.7 0.758
Retroperitoneum 9.6 1.48-62.15 0.018 16 1.6-159.3 0.018
Plane of Tumor
Subcutis 1 1
Muscular plane 4.14 1.3-13.2 0.016 4.01 1.31-12.32 0.015
Body cavity 8.05 1.62-39.8 0.011 5.6 1.6-19.6 0.007
Circumscription
No 1 1
Yes 0.2 0.07-0.55 0.002 1.005 0.40-2.5 0.991
Necrosis
No 1 1
Yes 18.13 2.28-143.6 0.006 4.98 1.7-14.3 < 0.001
David et al. Journal of Experimental & Clinical Cancer Research 2011, 30:56
/>Page 7 of 9
and pSTAT3 expression correlate with metastasis and
recurrence needs to be evaluated.
The present study thus suggests that overexpression of
STAT3 at the protein and gene level may be considered
as a hallmark of sarcomas. Our data also indicates that
increased activation of STAT3 could be associated with
more aggressive biological behavior of soft tissue
tumors. Although constitutive activation of STAT pro-
teins is not the only contribut ing factor to transforma-
tion and cancer progression, its crucial role is still under
investigation in soft tissue tumors. The mechanisms
responsible for ab errant STAT activation in sarcomas
remain uncertain and need further exploration. More-
over, knowledge of the cross-interaction of STAT mole-
cules with other critical cellular proteins involved in
growth regulation and survival may better serve to
explain carcinogenesis in sarcomas.
Conclusions
The overexpression of STAT3 and pSTAT3 (Tyr705)
has been observed in human soft tissue tumor samples
and the expression level increases with tumor grade pro-
gression. Our data showed that constitutive activation of
STAT3 in human soft tissue tumors is significantly asso-
ciated with its clinicopathological parameters such as
tumor grade, plane of the tumor, tumor size and tumor
necrosis, which may possibly have potential diagnostic
and prognostic implications.
Additional material
Additional file 1: Table S1. Clinicopathologic characteristics and
expression of STAT3 and pSTAT3 in soft tissue tumors.
Author details
1
Integrated Cancer Research, Rajiv Gandhi Centre for Biotechnology, Kerala,
India.
2
District Public Health Laboratory, Alappuzha, Kerala, India.
3
Department of Pathology, Kottayam Medical College, Kottayam, Kerala,
India.
Authors’ contributions
AS and DD designed this study and carried out immnunohistochemistry
staining, western blotting and RT-PCR and drafted the manuscript. LM, and
KB, provided the clinical samples and collected clinical information and MR
participated in the coordination of the study and helped to draft the
manuscript. JV performed the statistical analysis. All authors read and
approved the final manuscript.
Competing interests
The authors declare that they have no competing interests.
Received: 22 February 2011 Accepted: 16 May 2011
Published: 16 May 2011
References
1. Kunnumakkara BA, Nair SA, Sung B, Pandey KM, Aggarwal BB: Boswellic
acid blocks signal transducers and activators of transcription 3 signaling,
proliferation, and survival of multiple myeloma via the protein tyrosine
phosphatase SHP-1. Mol Cancer Res 2009, 7(1):118-128.
2. Buettner R, Mora LB, Jove R: Activated STAT signaling in human tumors
provides novel molecular targets for therapeutic intervention. Clin Cancer
Res 2002, 8(4):945-954.
3. Bromberg JF, Darnell JE Jr: The role of STATs in transcriptional control
and their impact on cellular function. Oncogene 2000, 19(21):2468-2473.
4. Barre B, Vigneron A, Perkins N, Roninson IB, Gamelin E, Coqueret O: The
STAT3 oncogene as a predictive marker of drug resistance. Trends Mol
Med 2007, 13:4-11.
5. Duan Z, Foster R, Bell DA, Mahoney J, Wolak K, Vaidya A, Hampel C, Lee H,
Seiden MV: Signal transducers and activators of transcription 3 pathway
activation in drug-resistant ovarian cancer. Clin Cancer Res 2006,
12:5055-5063.
6. Turkson J, Jove R: STAT proteins: novel molecular targets for cancer drug
discovery. Oncogene 2000, 19:6613-6626.
7. Benjamin R, Pisters PWT, Helman LJ, Bramwell VHC, Rubin BP, O’Sullivan B:
Sarcomas of Soft Tissue. Clinical Oncology 2008, 4-56.
8. Christopher D, Fletcher M, Krishnan UK, Mertens F: International Agency
for Research on Cancer, World Health Organization. Pathology and
genetics of tumors of soft tissue and bone. Lyon, IARC Press 2002, 12-18.
Table 4 Clinicopathologic characteristics and expression
of STAT3 in malignant soft tissue tumors.
Clinicopathological
Characteristics
STAT3
Negative(%) Positive(%) P-value
Number of patients 2 (4.17) 46 (95.83)
Tumour Size
< = 5 cm 0(0.00) 13(100.00) 0.537
>5 & < = 10 cm 1(8.33) 11(91.67)
>10 & < = 15 cm 0(0.00) 11(100.00)
>15 & < = 20 cm 1(14.29) 6(85.71)
>20 cm 0(0.00) 5(100.00)
Tumor Location
Upper limb 0(0.00) 5(100.00) 1
Lower limb 1(4.55) 21(95.45)
Thorax 0(0.00) 7(100.00)
Head & neck 0(0.00) 1(100.00)
Retroperitoneum 1(7.69) 12(92.31)
Plane of Tumor
Subcutis 1(6.25) 15(93.75) 0.533
Muscular plane 0(0.00) 17(100.00)
Body cavity 1(6.67) 14(93.33)
Circumscription
No 1(3.13) 31(96.88) 1
Yes 1(6.25) 15(93.75)
Capsulation
No 2(4.55) 42(95.45) 1
Yes 0(0.00) 4(100.00)
Necrosis
No 1(3.45) 28(96.55) 1
Yes 1(5.26) 18(94.74)
David et al. Journal of Experimental & Clinical Cancer Research 2011, 30:56
/>Page 8 of 9
9. Ravi V, Wong MK: Strategies and methodologies for identifying molecular
targets in sarcomas and other tumors. Curr Treat Options Oncol 2005,
6(6):487-497.
10. Epling BPK, Zhong B, Bai F: Cooperative regulation of Mcl-l by Janus
kinase/stat and phosphatidylinositol 3-kinase contribute to granulocyte-
macrophage colony-stimulating factor-delayed apoptosis in human
neutrophils. J Immunol 2001, 166:7486-95.
11. Zushi S, Shinomura Y, Kiyohara T: STAT3 mediates the survival signal in
oncogenic ras- transfected intestinal epithelial cells. Int J Cancer 1998,
78:326-330.
12. Kiuchi N, Nakajma K, Ichiba M: STAT3 is required for the gp130-mediated
full activation of the c-myc gene. J Exp Med 1999, 189:63-73.
13. Sartor CI, Dziubinski ML, Yu CL, Jove R, Ethier SP: Role of epidermal growth
factor receptor and STAT-3 activation in autonomous proliferation of
SUM-102PT human breast cancer cells. Cancer Res 1997, 57:978-987.
14. Lin Q, Lai R, Chirieac LR: Constitutive activation of JAK3/STAT3 in colon
carcinoma tumors and cell lines: inhibition of JAK3/STAT3 signaling
induces apoptosis and cell cycle arrest of colon carcinoma cells. Am J
Pathol 2005, 167:969-980.
15. Mora LB, Buettner R, Seigne J: Constitutive activation of Stat3 in human
prostate tumors and cell lines: direct inhibition of Stat3 signaling
induces apoptosis of prostate cancer cells. Cancer Res 2002, 62:6659-6666.
16. Song L, Turkson J, Karras JG, Jove R, Haura EB: Activation of Stat3 by
receptor tyrosine kinases and cytokines regulates survival in human
non-small cell carcinoma cells. Oncogene 2003, 22:4150-4165.
17. Chen CL, Loy A, Cen L, Chan C, Hsieh FC, Cheng G, Wu B, Qualman SJ,
Kunisada K, Yamauchi-Takihara K, Lin J: Signal transducer and activator of
transcription 3 is involved in cell growth and survival of human
rhabdomyosarcoma and osteosarcoma cells. BMC Cancer 2007, 7:111.
18. Chen SY, Takeuchi S, Urabe K, Hayashida S, Kido M, Tomoeda H, Uchi H,
Dainichi T, Takahara M, Shibata S, Tu YT, Furue M, Moroi Y: Overexpression
of phosphorylated-ATF2 and STAT3 in cutaneous angiosarcoma and
pyogenic granuloma. J Cutan Pathol 2008, 35(8):722-730.
19. Lai R, Navid F, Rodriguez GC, Liu T, Fuller C, Ganti R, Dien J, Dalton J,
Billups C, Khoury J: STAT3 is activated in a subset of the Ewing sarcoma
family of tumours. J Pathol 2006, 208:624-632.
20. Punjabi AS, Patrick A, Carroll LC: Persistent activation of STAT3 by latent
kaposi’s sarcoma-associated Herpesvirus infection of endothelial cells. J
Virol 2007, 81(5):2449-2458.
doi:10.1186/1756-9966-30-56
Cite this article as: David et al.: Prognostic significa nce of STAT3 and
phosphorylated STAT3 in human soft tissue tumors - a
clinicopathological analysis. Journal of Experimental & Clinical Cancer
Research 2011 30:56.
Submit your next manuscript to BioMed Central
and take full advantage of:
• Convenient online submission
• Thorough peer review
• No space constraints or color figure charges
• Immediate publication on acceptance
• Inclusion in PubMed, CAS, Scopus and Google Scholar
• Research which is freely available for redistribution
Submit your manuscript at
www.biomedcentral.com/submit
David et al. Journal of Experimental & Clinical Cancer Research 2011, 30:56
/>Page 9 of 9