báo cáo khoa học: "Factors influencing success in quality-improvement collaboratives: development and psychometric testing of an instrument" pdf
Bạn đang xem bản rút gọn của tài liệu. Xem và tải ngay bản đầy đủ của tài liệu tại đây (323.38 KB, 9 trang )
METH O D O LOG Y Open Access
Factors influencing success in quality-improvement
collaboratives: development and psychometric
testingofaninstrument
Loes MT Schouten
1*
, Richard PTM Grol
2
, Marlies EJL Hulscher
2
Abstract
Background: To increase the effectiveness of quality-improvement collaboratives (QICs), it is impo rtant to explore
factors that potentially influence their outcomes. For this purpose, we have developed and tested the
psychometric properties of an instrument that aims to identify the features that may enhance the quality and
impact of collaborative quality-improvement approaches. The instrument can be used as a measurement
instrument to retrospectively collect information about perceived determinants of success. In addition, it can be
prospectively applied as a checklist to guide initiators, facilitators, and participants of QICs, with information about
how to perform or participate in a collaborative with theoretically optimal chances of success. Such information
can be used to improve collaboratives.
Methods: We developed an instrument with content validity based on literature and the opinions of QIC experts.
We collected data from 144 healthcare professionals in 44 multidisciplinary improvement teams participating in
two QICs and used exploratory factor analysis to assess the const ruct validity. We used Cronbach’s alpha to
ascertain the internal consistency.
Results: The 50-item instrument we developed reflected expert-opinion-based determinants of success in a QIC.
We deleted nine items after item reduction. On the basis of the factor analysis results, one item was dropped,
which resulted in a 40-item questionnaire. Exploratory factor analysis showed that a three-factor model provided
the best fit. The components were labeled ‘sufficient expert team support’, ‘effective multidisciplinary teamwork’,
and ‘helpful collaborative processes’. Internal consistency reliability was excellent (alphas between .85 and .89).
Conclusions: This newly developed instrument seems a promising tool for providing healthcare workers and
policy makers with useful information about determinants of success in QICs. The psychometric properties of the
instrument are satisfactory and warrant application either as an objective measure or as a checklist.
Introduction
Approaches to collaborative quality improvement cur-
rently form one of the most popular methods for organis-
ing improvement in hospitals and ambulatory practices.
A quality-improvement collaborative (QIC) is an approach
emphasising collaborative learning, support, and exchange
of insights among different healthcare organisations. It
brings together multidisciplinary teams from different
organisations and agencies that share a commitment to
making small, rapid tests of change that can be expanded
to produce breakthrough resultsinaspecificclinicalor
operational area [1]. Although the underlying basic con-
cept of QIC programmes appears intuitively appropriate,
QICs have not been linked to a published evidence base of
effectiveness [2]. A recent systematic review of QICs
showed moderately positive results and varying success in
achieving collaborative goals [3]. Insight into the mechan-
isms res ponsible for the results and variation in a QIC is
scarce [4].
While unequivocal evidence of the effectiveness of the
method may be lacking, QIC approaches have been
initiated worldwide, and they represent substantial
investments of time, effort, and funding in th e healthcare
delivery system [5]. Given the popularity of collab orative
* Correspondence:
1
Dutch Institute for Healthcare Improvement, Utrecht, The Netherlands
Full list of author information is available at the end of the article
Schouten et al. Implementation Science 2010, 5:84
/>Implementation
Science
© 2010 Schouten et al; licensee BioMed Central Ltd. This is an Open Access article distributed unde r the terms of the Creative
Commons Attribution License ( 0), which permits unrestricted use, di stribution, and
reproduction in any medium, provided the original work is properly cited.
approaches, it seems obvious that future designers and
implementers of collaboratives should be guided by infor-
mation on how to optimize the benefits of QICs. This
requires a better understanding of the factors that deter-
mine their success.
Although a few studies have explored the presence of
conditions for successful implementation of collabora-
tives [6-9], an analysis of the oretic al concepts influen-
cing the impact of QICs is absent, as is an overview of
the key characteristics of the approach relating to suc-
cess. Moreover, sound information as to why particular
QICs worked in specific settings, organisations, or teams
but not in others and what factors influenced their suc-
cess or lack of success are l ikewise absent. One step in
gaining such an understanding is a comprehensive,
valid, and reliable measurement of such factors. We
have therefore developed and tested a new tool to mea-
sure factors that might influence success in QICs. This
instrument can be used as a measurement instrument to
collect information about perceived determinants of suc-
cess retrospectively. In addition, it can be applied pro-
spectively as a checklist to guide initiators, facilitators,
and participants of QICs, with info rmation about how
to carry out or participate in a collaborative with theore-
tically optimal chances of success. Such information can
be used to evaluate and improve QIC approaches.
Methods
The instrument was developed in several steps.
Developing an instrument with content validity
’Factors influencing success in a QIC’ is the focal con-
struct of this QIC instrument. To increase confidence
that the instrument measures the aspects it was
designed for, we addressed content validity according to
published procedures [10]. The aim was to ensure that
the instrument content was relevant and thoroughly
represented the potential determinants of suc cess in
QICs. The first step we took to distinguish and define
potential determinants of success in a QIC was to use a
systematic search [3] to find theoretical papers about
QICs. We searched the MEDLINE® (US National Library
of Medicine, Bethesda, MD, USA), CINAHL® (EBSCO
Publishing, Ipswich, MA, USA), Embase® (Elsevier B.V.,
New York, NY, USA), Cochrane, and PsycINFO® (Amer-
ican Psychological Association, Washington, DC, USA)
databases for literature about QICs in the period from
January 1995 to June 2006, inclusive. We started with a
MEDLINE search for free text terms describing QICs,
and we combined the keywords (non-MeSH) ‘ qu ality
and i mprovement and collaborative’ or ‘ (series or pro-
ject) and breakthrough’. The same steps were repeated
for the other databases. We also reviewed the re ference
lists of the included papers. To distinguish and define
determinants of success, studies were i ncluded if t hey
(a) gave an overview of key elements or components of
QICs applied in healthcare and (b) were written in Eng-
lish. Two researchers (LS and MH) reviewed titles of
articles and abstracts identified in the search. Each
potentially eligible paper was independently assessed.
The reference lists of the papers were also reviewed.
Our search identified five studies that met our inclu-
sion criteria [1,11-14]. All authors were experts in the
field of QICs. Two reviewers (LS and MH) indepen-
dently extracted the characteristics of the collaboratives
and the theoretical conce pts influencing success from
these papers. Then they catego rized the item s using the
following definition as a template: ‘ AQICisanorga-
nised, multifaceted approach to quality improvement
that involves five essential features, namely, (1) there is
a specified topic, (2) clinical experts and experts in qual-
ity improvement provide ideas a nd support, (3) multi-
professional teams from multiple sit es participate, (4)
there is a model for improvement (setting targets, col-
lecting data, and testing changes), and (5) the collabora-
tive process involves a series of structured activities’ [3].
The five pa pers with an overv iew of collaborat ives
provided a list of 128 items of expert-opinion-based
determinants of success [15]. Two reviewers (LS and
MH) analysed the list of determinants to identify pro-
blems with wording or meaning and redundancy or rele-
vancy of items. Items measuring similar determinants
were categorized together. Determinants with potential
overlap in construct and t hose that were deemed vague,
ambiguous, or redundant were removed. T his exercise
reduced the list to 72 items.
After revisions of wording and sequencing of ques-
tions, four expert s involved in QICs reviewed the first
draft of the instrument to enhance the face validity.
They were asked to judge the questions for readability,
comprehensibility, ease of response, and content validity.
After review by the expert panel, the list was reduced to
50 items. Overall, the reviewers’ responses were similar
in nature, with no noteworthy variance. As part of the
content validity testing , items were accepted or de leted
on the basis of the level of agreement between the
reviewers, and appropriate changes were made in accor-
dance with the suggestions of the experts. As a result,
the QIC instrument was thoroughly critiqued and
refined [16].
The 50-item instrument that was created was intended
to represent four sub scales believed to represent various
determinants of success in a specific QIC: (1) sufficient
expert panel support, (2) effective multiprofessional
teamwork, (3) appropriate use of the improvement
model, and (4) helpful collaborative processes. A five-
point Likert scale was used in the design of the items
and ranged from strongly disagree to strongly agree.
Schouten et al. Implementation Science 2010, 5:84
/>Page 2 of 9
Testing the instrument
Sample and data collection
To comprehensively test the construct validity and the
internal consistency of our QIC instrument, we asked
participants in current national collaboratives to com-
plete the instrument. Our sample represented healthcare
workers from 46 multidisciplinary quality improvement
teams participating in two dis tinct collaboratives based
on the Breakthrough Series [12], one focu sing on breast
cancer and one on perioperative care. Each team con-
sisted of a minimum of four people. Individual team
members were asked to complete the questionnaire at
the last conference or post completed questionnaires to
us. In order to examine the central tendency, variability,
and symmetry, we calculated descriptive statistics and
the response distribution for each item. To enhance fea-
sibility, we considered reducing the number of items.
Items with the following characteristics were removed:
those with a high proportion of missing responses (>
10%), those that showed redundancy of measurement
through a high correlation (r > .85) with another item,
and t hose with skewed distributions (items with > 90%
of the answers in categories 1 and 2 or 4 and 5 on a
five point likert scale).
Before items were removed, their importance was con-
sidered, as judged by the reviewers’ (LS and MH) opi-
nions of their content validity.
Construct validity testing: Exploratory factor analysis
We used principal comp onents analysis for the explora-
tory factor analysis to analyse the construct validity,
defined as the extent to which a test measures a theore-
tical construct or trait [17,18]. We used SPSS 16.0®
(IBM, Chicago, IL, USA) to select the final items for the
questionnaire. We used a maximum likelihood solution
with varimax, an orthogonal rotation method that mini-
mizes the number of variables with high loadings on
each factor. This method simplifies the interpretation of
the factors. A precedent cutoff of 0.4 was specified for
acceptable factor loadings, and ite ms with a loading of
0.4 or more were retained [19].
Internal consistency testing
Internal homogeneity
We used Cronbach’s alpha to measure the internal
homogeneity, defined as the extent to which subscales
of an instrument measure the same attribute or dimen-
sion. Internal homogeneity represents an index of an
instrument’s reliability [20,21].
As the QIC instrument was an assembly of items in
four subscales designed to quantify agreement with the
determinants of succe ss in a QIC, it was important to
know whether the set o f items in the s ubscales consis-
tently measured the same construct. For the purposes of
this study, a Cronbach’ s alpha of .7 or more was
considered acceptable for the composite scores on the
subscales of the QIC instrument as a self-report instru-
men t [22]. Data acquired from the collaborative partici-
pants were used to te st internal consistency. Underlyi ng
theoretical constructs suggested that a positive correla-
tion should be expected between all items in a subscale.
Intercorrelations
To test item-internal consisten cy, the correlations of the
items with their scales were determined. High conver-
gent validity of the items was indicated if the item cor-
related with the relevant scale. A matrix was set up with
item-scale correlations comparing correlations across
scales.
Results
Sample
All 46 established improvement teams participated in the
working conferences (learning sessions) and completed
the collaborative. There were no dropouts. The mean
number of team members was 7 (range: 4 to 13),
although not all team members attended the conferences.
All teams included at least one medical specialist, one
nurse, and one allied health professional. Representing 44
teams, 144 participants attending the last conference
completed the questionnaire (response rate: 95%). The
numbers of valid responses were high for all items, pro-
viding evidence that items and response choices were
clear and unambiguous. Table 1 displays the descriptive
statistics of the items. Both collaborative topics (breast
cancer and pe rioperative care) showed high scores (mean
scores ≥4) for the presence of more than half of the
potential determinants. Most items showed little varia-
tion (the standard deviation varied between 0.515 and
1.17). No items were excluded on the basis of the propor-
tion of missing responses. We deleted nine items from
the initial 50-item instrument with 90% of the answers in
categories 4 and 5: 1.3 (chairperson was an expert), 2.10
(general goals of the collaborative were clear), 2.11 (team
supported collaborative’ s general goals), 2.15 (team
directly involved in changes), 2.16 (team had relevant
expertise), 2.18 (teams were motivated), 2.21 (team
focused on patient improvement), 2.22 (team focused on
care process improvement), 3.28 (team gathered mea-
surement data),
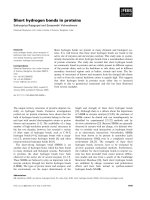
Construct validity testing: Exploratory factor analysis
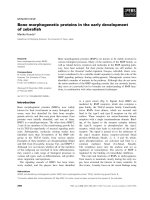
Exploratory factor analysis showed the 50 items to be
clustered in three s cales (Figure 1). Togeth er, these
three accounted for 44.2 % of the total variance . Table 2
presents the items of the scales and their factor loadings
for the three-factor solution, after varimax rotation.
Item 4.47 (there was competition betwe en improvement
teams at the joint working conferences) was removed
because the factor analysis showed it did not fit with
Schouten et al. Implementation Science 2010, 5:84
/>Page 3 of 9
Table 1 Item-descriptive statistics of the questionnaire
Items Mean SD
Sufficient expert panel support
1.1 The collaborative chairperson was an opinion leader 4.10 0.697
1.2 The expert panel provided information and advice for changes 4.11 0.655
1.3 The collaborative chairperson was an expert on the QIC topic 4.45 0.686
1.4 The expert panel provided sufficient time for our project 4.03 0.687
1.5 The expert panel provided positive feedback for our project 3.95 0.702
1.6 The expert panel was experienced in successfully improving the care process for the QIC topic 4.09 0.758
1.7 The expert panel contributed scientific knowledge 4.25 0.742
1.8 The expert panel contributed practical experience 4.18 0.778
Effective multidisciplinary teamwork
2.9 Collaborative participation was carefully prepared and organised 3.84 0.894
2.10 General goals of the collaborative were clear 4.29 0.549
2.11 My team supported the collaborative’s general goals 4.29 0.617
2.12 Management provided sufficient means and time 3.48 1.170
2.13 Management followed project progress 3.22 1.115
2.14 Management prioritised success 3.37 0.963
2.15 Team members were directly involved in changes 4.37 0.600
2.16 Team members had relevant expertise 4.41 0.539
2.17 Team members had leadership skills 4.12 0.794
2.18 Teams were motivated in implementing changes 4.19 0.637
2.19 Roles in my team were clearly defined 3.93 0.755
2.20 Participation in this project enhanced multidisciplinary collaboration in my organization 4.15 0.743
2.21 My team focused on patient improvement 4.31 0.572
2.22 My team focused on care-process improvement 4.26 0.565
Appropriate use of the improvement model
3.23 My team formulated clear goals 4.02 0.737
3.24 My team focused on achieving goals 4.05 0.719
3.25 Goals were discussed within organisation 3.71 0.805
3.26 Goals were incorporated in organisation policy 3.84 0.768
3.27 Goals were readily measurable 4.04 0.669
3.28 My team gathered measurement data 4.36 0.585
3.29 My team used measurements to plan changes 3.93 0.862
3.30 My team used measurements to test changes 3.68 0.996
3.31 My team used measurements to track progress 4.11 0.734
3.32 My team considered continuous improvement a part of working process 3.91 0.699
3.33 My team continued to aim for change 3.63 0.802
3.34 My team tracked progress continuously 3.80 0.754
Helpful collaborative processes
4.35 Useful knowledge and skills we given to my team during working conferences 3.88 0.699
4.36 Focus was on practical application of knowledge and skills at working conferences 3.78 0.651
4.37 My team shared experiences at working conferences 4.05 0.587
4.38 Working conferences focused on joint learning 3.95 0.656
4.39 My team developed skills in planning changes at working conferences 3.68 0.752
4.40 My team developed skills in processing changes at working conferences 3.66 0.756
4.41 My team developed confidence in achievability of changes at working conferences 3.88 0.721
4.42 Teams reflected on results at working conferences 4.05 0.515
4.43 My team contacted coworkers from other organisations at working conferences 3.77 0.815
4.44 My team learned from progress reporting by other teams at working conferences 3.92 0.659
4.45 Teams received feedback on progress from expert panel at working conferences 3.72 0.720
4.46 Teams supported one another at working conferences 3.49 0.774
4.47 There was competition between teams during the joint working conferences 2.74 0.996
4.48 There was a moment to reflect on achieved results 3.96 0.607
4.49 Information, ideas, and suggestions were actively exchanged at working conferences 3.65 0.694
4.50 Teams exchanged information outside working conferences 2.73 0.968
SD = standard deviation; QIC = quality improvement collaborative.
Schouten et al. Implementation Science 2010, 5:84
/>Page 4 of 9
any distinct factors representing the different concepts.
It was not necessary to apply a second criterion; none of
the remaining items loaded on more than one factor
after varimax rotation.
Overall, all items from the scale ‘clinical experts and
experts in quality improvement provide ideas and sup-
port for improvement’ (seven items) and ‘the collabora-
tive process involves structured activities’ (15 items)
loaded on their theoretical scales. The original scales
‘multiprofessional teams from multiple sites participate’
and ‘ use of a model for improvement’ converged (in
total, 18 items). The three components were labeled:
‘sufficient expert panel support’, ‘effective multidisciplin-
ary teamwork’, and ‘helpful collaborative processes’.
Internal consistency testing
Internal homogeneity
Cronbach’ s alpha analysis of the three scales revealed
alphas between .85 and .89, which indicates very good
reliability for all three factors of the instrument.
Intercorrelations
All factors o r scales correlated significantly and posi-
tively (Table 3). Scale correlations ranged from .205
(’sufficient expert panel support’ and ‘effective multidis-
ciplinary tea mwork’ ) to .398 (‘helpful collaborative pro-
cess’ and ‘ effective multidisciplinary teamwork’ ). The
inter-item correlations s how adequate levels of inter-
scale correlations (Table 4).
Discussion
This study comprehensively explored the potential
determinants of success that can be included in measur-
ing the impact of QICs. The theoretical framework of
our instrument was exclusively built on information
from literature and expert opinion concerning QICs.
We based our instr ument on four key component s of
QICs: (1) clinical experts and experts in quality
improvement provide ideas and support for improve-
ment, (2) multiprofessional teams from multiple sites
participate, (3) there is a model for improvement (set-
ting targets, collecting data, and testing changes), and
(4) the collaborative process involves a series of struc-
tured activities. We would expect that factors reflecting
any of these key components potentially influence the
success or failure of QICs. For example, ‘ expert panel
support’ may play an important role in legitimizing the
collaborative and motiva ting the partici pants. Effective
‘multiprofessional teamwork’ may require gathering the
right individuals for an improvement team, committing
to change, and securing time, resources, and manage-
ment support. Engaging in a ‘ model for improvement’ is
assumed to build the i nternal capacity of participating
organisations to establish clear aims, to collect and
monitor appropriate performance measures, and to set
the stage for continuous improvem ent. Finally, ‘ colla-
borative processes and activities’ are targeted to enable
mutual learning, social comparison, and support. The
Figure 1 Scree plot.
Schouten et al. Implementation Science 2010, 5:84
/>Page 5 of 9
factor structure found in the data is almost identical to
the four subcategories we theorised. However, ‘multipro-
fessional teams’ and ‘there is a model for improvem ent’
loaded on one factor. Rather than four, we found three
factors in exploratory factor analysis. Items reflecting
intern al-team features, like multiprofessional team wor k,
Table 2 Factor loadings for the list for the quality improvement collaborative
Rotated component matrix
a
Item Component
123
1.8 Expert panel contributed practical experience 0.755
1.7 Expert panel contributed scientific knowledge 0.741
1.6 Expert panel was experienced in successfully improving care process 0.725
1.2 Expert panel gave advice on changes 0.676
1.1 Chairperson of the expert panel was an opinion leader 0.627
1.4 Expert panel had ample time 0.617
1.5 Expert panel gave positive feedback 0.611
3.23 My team formulated clear goals 0.747
2.19 Roles in my team were clearly defined 0.731
3.24 My team focused on achieving goals 0.728
3.32 My team considered continuous improvement a part of working process 0.718
2.09 Collaborative participation was carefully prepared and organized 0.705
3.34 My team tracked progress continuously 0.690
2.17 Team members had leadership skills 0.658
3.27 Goals were readily measurable 0.652
2.14 Management prioritised success 0.639
2.12 Management provided sufficient means and time 0.605
3.25 Goals were discussed within organization 0.530
3.33 My team continued to aim for change 0.527
2.20 Participation in this project enhanced multidisciplinary collaboration in my organisation 0.521
3.29 My team used measurements to plan changes 0.521
2.13 Management followed project progress 0.514
3.30 My team used measurement to test changes 0.511
3.31 My team used measurements to track progress 0.487
3.26 Goals were incorporated in organisation policy 0.483
4.40 My team developed skills in processing changes at working conferences 0.732
4.39 My team developed skills in planning changes at working conferences 0.711
4.44 My team learned from progress reporting by other teams at working conferences 0.668
4.38 Working conferences focused on joint learning 0.654
4.36 Focus was on practical application of knowledge and skills at working conferences 0.651
4.43 My team contacted coworkers from other organisations at working conferences 0.645
4.46 Teams supported one another at working conferences 0.628
4.49 Information, ideas, and suggestions were actively exchanged at working conferences 0.623
4.35 Useful knowledge and skills were given to my team during working conferences 0.617
4.48 There was a moment to reflect on achieved results 0.561
4.37 My team shared experiences at working conferences 0.558
4.41 My team developed confidence in achievability of changes at working conferences 0.511
4.50 Teams exchanged information outside working conferences 0.509
4.45 Teams received feedback on progress from expert panel at working conferences 0.509
4.42 Teams reflected on results at working conferences 0.487
a
Rotation converged in five iterations.
Extraction method: principal component analysis; rotation method: varimax with Kaiser normalization; item excluded: 4.47: There was competition between teams
during the joint working conferences.
Schouten et al. Implementation Science 2010, 5:84
/>Page 6 of 9
senior management support, and clarity of roles, coin-
cided with features like setting aims, collecting data,
and testing changes, at least in the eyes of the QIC
participants.
Duckers et al. [6] developed a 15-item instrument for
team organisations and s upport ive conditions to imple-
ment QIC projects using literature about QICs, team-
based implement ation, and the dissemination of innova-
tions within health service organisations. Mills et al.
[7,8] and Neilly et al. [9] used surveys based on research
in team performance and organisational learning and
the characteristics of high-pe rforming healthcare micro-
systems to assess determinants of success in QICs.
While some items in these instruments overlap with
ours ( e.g., items reflecting teamwork, leadership and/or
organisational support), several differences remain
(Table 5). Our instrument was buil t exclusively on the
key compone nts of QICs based on expert literature and
expert opinion about QICs. With the exception o f the
feature ‘ there is a specified topic’ (excluded from our
instrument as a prerequi site assumed not to vary in one
specific QIC), our instrument reflects the key compo-
nents of a collaborative, addin g items about the use of
opinion leaders as change agents; setting clear and mea-
surable goals; multidisciplinary collaboration; receiving
feedback on progress; reflecting on results at working
conferences; and focusing on sharing, exchanging, joint
learning, and external peer support.
Although only in the first stages of development and
validation, our instrument seems a promising tool that
will be able to provide healthcare workers, facilitators,
managers, and researchers with a more specific under-
standing of success determinants in approaches to colla-
borative quality improvement. Partici pant completi on of
the QIC instrument during or after the QIC will provide
researchers, healthcare w orkers, facilitators, and man-
agers with an objective measure of the perceived success
of determinants in a QIC. In a ddition, with a little
rephrasing, the instrument can be applied as a checklist
to prospectively guide initiators and facilitators of a QIC
by providing i nformation on how to carry out a colla-
borative with theoretically optimal chances of success.
This information can be used to adapt the performance
of the QIC during (for current participant s) or after (for
future participants) the QIC. Thus, hospital managers,
project teams, external change agents, researchers, and
other interested public parties m ay benefit from t his
instrument since it provides ready information relevant
to real-time adjustments, intake procedures, and further
research.
Limitations
Our testing has some limitations. First, a few remarks
must be made with regard to the sample size. Different
standards are applied for the number to cases ratio of
items for a factor analysis versus a principal component
analysis. Five to ten cases for each item are generally
recommended [23,24]. Others state that the most impor-
tant issues in determining reliable factor solutions are the
absolute sample size and the absolute magnitude o f
Table 3 Correlations calculated as Spearman’s rho
Support from expert
team
Multidisciplinary team, improvement
model
Collaborative
process
Sufficient expert panel support Correlation coefficient 1.000
Significance (two-tailed
test)
Effective multidisciplinary
teamwork
Correlation coefficient .230* 1.000
Significance (two-tailed
test)
.050 .
Helpful collaborative processes Correlation coefficient .410** .323** 1.000
Significance (two-tailed
test)
.000 .004
*Correlation is significant at the .05 level (two-tailed test); **Correlation is significant at the .01 level (two-tailed test).
Table 4 Intercorrelations and reliabilities among scales
Items Alpha
coefficient
Interitem
correlation
(lowest to highest)
Interscale
correlation
Scale 123
1. Sufficient expert panel support 7 .85 .255 712
2. Effective multidisciplinary teamwork 18 .89 .046 777 .205
3. Helpful collaborative processes 15 .88 .132 834 .388** .398**
Schouten et al. Implementation Science 2010, 5:84
/>Page 7 of 9
factor loadings. For example, Guadagnoli and Velicer [25]
state that a factor with four or more loadings greater than
0.6 is reliable, regardless of sample size. In our analysis, 7
out of 7 (factor 1), 10 out of 18 (factor 2), and 9 out of 15
items (factor 3) showed loadings > 0.60.
Second, we were unable to test the temporal reliability,
so we could not compute a test-retest reliability coeffi-
cient and did not assess the discriminating capacity.
Third, we tested our instrument by using it as a measure-
ment instrument to retrospectively collect information
about perceived determinants of success. Appropriately
applying the instrument prospectively (as a checklist)
may require the same steps as fo r testing construct valid-
ity and internal consistency. Finally, the relatively high
scores of the 44 multidisciplinary improvement teams
that completed the instrument in this study do suggest
that most determinants or conditions in these specific
collaboratives were present or fulfilled. These s cores are
not necessarily applicable to other teams or QIC initia-
tives. As participating teams vary in their individual per-
formance and amount of improvement, further research
is needed to quantitatively determine its usefulness in
explaining the differences of success between teams par-
ticipating in a QIC.
Many experts and researchers involved in QICs have
pointed out that it would be helpful to understand
which success factors are associated with outcomes in
QICs. It is therefore important to have access to assess-
ment tools that have undergone evaluation and have
been proven to be valid and reliable. This study shows
that the psychometric properties of this newly developed
instrument are satisfactory. Further research to refine
the instrument and link its outcomes to key effect para-
meters is needed to estimate its usefulness in quantita-
tively explaining the differences of success in a QIC.
Author details
1
Dutch Institute for Healthcare Improvement, Utrecht, The Netherlands.
2
Nijmegen Medical Centre, Radboud University, Nijmegen, The Netherlands.
Authors’ contributions
LMTS participated in the design of the study, carried out the data collection
and performed the statistical analysis. MEJHH and RPTMG conceived of the
study, and participated in its design and coordination and helped to draft
the manuscript. All authors had full access to all of the data (including
statistical reports and tables) in the study and take responsibility for the
integrity of the data and the accuracy of the data analysis. All authors read
and approved the final manuscript.
Competing interests
The authors declare that they have no competing interests.
Received: 10 January 2010 Accepted: 28 October 2010
Published: 28 October 2010
References
1. Kilo CM: Improving care through collaboration. Pediatrics 1999, 103(1
Suppl E):384-393.
2. Leatherman S: Optimizing quality collaboratives. Qual Saf Health Care
2002, 11(4):307.
3. Schouten LM, Hulscher ME, van Everdingen JJ, Huijsman R, Grol RP:
Evidence for the impact of quality improvement collaboratives:
systematic review. BMJ 2008, 336(7659):1491-1494.
4. Solberg LI: If you’ve seen one quality improvement collaborative. Ann
Fam Med 2005, 3(3):198-199.
5. Mittman BS: Creating the evidence base for quality improvement
collaboratives. Ann Intern Med 2004, 140(11):897-901.
6. Duckers ML, Wagner C, Groenewegen PP: Developing and testing an
instrument to measure the presence of conditions for successful
implementation of quality improvement collaboratives. BMC Health Serv
Res 2008, 8:172.
7. Mills PD, Weeks WB, Surott-Kimberly BC: A multihospital safety
improvement effort and the dissemination of new knowledge. Jt Comm
J Qual Saf 2003, 29(3):124-133.
8. Mills PD, Weeks WB: Characteristics of successful quality improvement
teams: lessons from five collaborative projects in the VHA. Jt Comm J
Qual Saf 2004, 30(3):152-162.
9. Neily J, Howard K, Quigley P, Mills PD: One-year follow-up after a
collaborative breakthrough series on reducing falls and fall-related
injuries. Jt Comm J Qual Patient Saf 2005, 31(5):275-285.
10. Rubio DM, Berg-Wegner M, Tebb SS, Lee ES, Rauch S: Objectifying content
validity: conducting a content validity study in social work research.
Social Work Research 2003, 127(2):94-104.
11. Plsek PE: Collaborating across organizational boundaries to improve the
quality of care. Am J Infect Control 1997, 25(2):85-95.
12. Kilo CM: A framework for collaborative improvement: lessons from the
Institute for Healthcare Improvement’s Breakthrough Series. Qual Manag
Health Care 1998, 6(4):1-13.
13. OVretveit J, Bate P, Cleary P, Cretin S, Gustafson D, McInnes K, et al: Quality
collaboratives: lessons from research. Qual Saf Health Care 2002,
11(4):345-351.
14. Wilson T, Berwick DM, Cleary PD: What do collaborative improvement
projects do? Experience from seven countries. Jt Comm J Qual Saf 2003,
29(2):85-93.
15. Hulscher M, Schouten L, Grol R: Quest for Quality and Improved
Performance: Collaboratives. The Health Foundation 2009.
16. Tilden VP, Nelson CA, May BA: Use of qualitative methods to enhance
content validity. Nurs Res 1990, 39(3):172-175.
17. Nunnally JC, Bernstein IH: Psychometric Theory. New York: McGraw-Hill;, 3
1994.
Table 5 Overview of questionnaire scales
Questionnaire scales
Mills et al. (2003; 2004); Neily et al. (2005) [7-9] Duckers et al. (2008) [6] Schouten et al. (2010)
Leadership support Organisational support Sufficient expert panel support
Teamwork skills Team organisation Effective multidisciplinary teamwork
Prior experience with quality improvement and teamwork. External change agency support Helpful collaborative processes
New skills, information exchange, and overall satisfaction
Useful information systems
Schouten et al. Implementation Science 2010, 5:84
/>Page 8 of 9
18. Conway JM, Huffcutt AI: A review and evaluation of exploratory factor
analysis practices in organizational research. Organizational Research
Methods 2003, 6(2):147-168.
19. Chou SC, Boldy DP, Lee AH: Measuring job satisfaction in residential aged
care. Int J Qual Health Care 2002, 14(1):49-54.
20. Anastasi A, Urbina S: Psychological Testing. Upper Saddle River, NJ:
Prentice Hall;, 7 1997.
21. Polit DF, Beck CT, Hungler BP: Essentials of Nursing Research: Methods,
Appraisal and Utilisation. Philadelphia, PA: Lippincott;, 5 2001.
22. De Villis R: Scale development. Application and theory Newbury Park: Sage;
1991.
23. Kass R.A., Tinsley H.E.A.: Factor analysis. Journal of Leisure Research 1979,
11:120-138.
24. Nunally JC: Psychometric theory. New York: McGraw-Hill;, 2 1978.
25. Guadagnoli E, Velicer WF: Relation of sample size to the stability of
component patterns. Psychol Bull 1988, 103(2):265-275.
doi:10.1186/1748-5908-5-84
Cite this article as: Schouten et al.: Factors influencing success in quality-
improvement collaboratives: development and psychometric testing of an
instrument. Implementation Science 2010 5:84.
Submit your next manuscript to BioMed Central
and take full advantage of:
• Convenient online submission
• Thorough peer review
• No space constraints or color figure charges
• Immediate publication on acceptance
• Inclusion in PubMed, CAS, Scopus and Google Scholar
• Research which is freely available for redistribution
Submit your manuscript at
www.biomedcentral.com/submit
Schouten et al. Implementation Science 2010, 5:84
/>Page 9 of 9