Tài liệu Báo cáo khoa học: Top-down MS, a powerful complement to the high capabilities of proteolysis proteomics pdf
Bạn đang xem bản rút gọn của tài liệu. Xem và tải ngay bản đầy đủ của tài liệu tại đây (960.8 KB, 13 trang )
MINIREVIEW
Top-down MS, a powerful complement to the high
capabilities of proteolysis proteomics
Fred W. McLafferty
1
, Kathrin Breuker
2
, Mi Jin
1
, Xuemei Han
1
, Giuseppe Infusini
1
, Honghai Jiang
1
,
Xianglei Kong
1
and Tadhg P. Begley
1
1 Department of Chemistry and Chemical Biology, Baker Laboratory, Cornell University, Ithaca, NY, USA
2 Institute of Organic Chemistry and Center for Molecular Biosciences Innsbruck (CMBI), University of Innsbruck, Austria
Introduction
The MS techniques of ESI [1] and MALDI [2] have
been available for only two decades, but they have rev-
olutionized the introduction of large, nonvolatile mole-
cules such as proteins into the mass spectrometer [3,4].
Here we discuss two general types of such MS ‘proteo-
mics’ applications: (a) the identification of a protein
from among those predicted from the parent genome’s
DNA; and (b) the structural characterization of a pro-
tein, such as identifying and locating post-translational
modifications (PTMs) or errors in the predicted
sequence. Currently, by far the most common method-
ology for these in useful applications involves initial
protein proteolysis, an approach that we have termed
‘bottom-up’ [5]. The ‘top-down’ [5] approach described
Keywords
electron capture dissociation; MS; protein
characterization; protein identification;
post-translational modifications; top-down
proteomics
Correspondence
F. W. McLafferty, Baker Chemistry
Laboratory, Cornell University, Ithaca,
NY 14853, USA
Fax: +607 255 4137
E-mail:
(Received 30 May 2007, revised 12 October
2007, accepted 17 October 2007)
doi:10.1111/j.1742-4658.2007.06147.x
For the characterization of protein sequences and post-translational modifi-
cations by MS, the ‘top-down’ proteomics approach utilizes molecular and
fragment ion mass data obtained by ionizing and dissociating a protein in
the mass spectrometer. This requires more complex instrumentation and
methodology than the far more widely used ‘bottom-up’ approach, which
instead uses such data of peptides from the protein’s digestion, but the top-
down data are far more specific. The ESI MS spectrum of a 14 protein
mixture provides full separation of its molecular ions for MS ⁄ MS dissocia-
tion of the individual components. False-positive rates for the identification
of proteins are far lower with the top-down approach, and quantitation of
multiply modified isomers is more efficient. Bottom-up proteolysis destroys
the information on the size of the protein and the connectivities of the pep-
tide fragments, but it has no size limit for protein digestion. In contrast,
the top-down approach has a 500 residue, 50 kDa limitation for the
extensive molecular ion dissociation required. Basic studies indicate that
this molecular ion intractability arises from greatly strengthened electro-
static interactions, such as hydrogen bonding, in the gas-phase molecular
ions. This limit is now greatly extended by variable thermal and collisional
activation just after electrospray (‘prefolding dissociation’). This process
can cleave 287 inter-residue bonds in the termini of a 1314 residue
(144 kDa) protein, specify previously unidentified disulfide bonds between
eight of 27 cysteines in a 1714 residue (200 kDa) protein, and correct
sequence predictions in two proteins, one of 2153 residues (229 kDa).
Abbreviations
BCA, bovine carbonic anhydrase; CAD, collisionally-activated dissociation; ECD, electron-capture dissociation; HAD, 3-hydroxyanthranilate-
3,4-dioxygenase; IRMPD, infrared multiphoton dissociation; PFD, prefolding dissociation; PTM, post-translational modification;
PurL, formylglycinamide ribonucleotide amidotransferase.
6256 FEBS Journal 274 (2007) 6256–6268 ª 2007 The Authors Journal compilation ª 2007 FEBS
here directly introduces the proteins into the mass
spectrometer, providing far higher specificity at the
expense of far higher experimental requirements. As
predicted in a prescient 2004 review [6], the top-down
method is being exploited increasingly in unique appli-
cations, with 18% of proteomics papers ⁄ posters at the
2007 meeting of the American Society for Mass Spec-
trometry concerning this newer approach.
Although ESI spectra of proteins larger than mega-
daltons have been reported [7,8], the great majority
of ESI spectra measured are those of the small
(< 3 kDa) peptides produced by the bottom-up prote-
omics methodology [9–13]. The sample is digested with
a protease such as trypsin to produce a mixture of
small peptides from each protein, and is applicable to
even a complex mixture of proteins (e.g. the ‘shotgun
approach’) [10]. A common next step is the separation
of the total mixture into fractions by HPLC, followed
by their on-line introduction into the mass spectrome-
ter to yield ESI spectra showing molecular ions, and
thus molecular mass values, of the peptides. MS ⁄ MS
dissociation of molecular ions of an individual peptide
can yield fragment masses that are indicative of its
sequence. These results can then be matched against
the molecular mass and MS⁄ MS peptide masses
expected for the individual proteins predicted from the
parent genome’s DNA. In contrast [14], the ‘top-down’
methodology [5,6,14–22] can directly subject a mixture
of proteins, even of > 10 components, to ESI to yield
a spectrum of their molecular ions that indicates the
molecular mass values of individual proteins. MS ⁄ MS
of the mass-selected ions of a protein then provides
fragment mass values for its structural characteriza-
tion.
In general, the bottom-up method is widely accepted
for the routine identification of proteins in complex
mixtures. Usually, the identification of the gene that
encodes the protein is more important than full struc-
tural characterization of the protein. Its quantitative
analysis by the bottom-up method under normal and
abnormal conditions can then provide a direct indica-
tion of the upregulation or downregulation of the
gene. If, however, more extensive or specific data are
needed, such as on polymorphisms or PTMs, the com-
plementary top-down approach can often provide
these in a very straightforward manner. This review
also discusses alleviation of a serious previous prob-
lem: top-down molecular ion dissociations have given
few product ions for proteins > 50 kDa. The far
higher masses measured with the top-down approach
require correspondingly higher MS resolving power,
so the instrument of choice has been the expensive
Fourier transform mass spectrometer (FT MS)
[3,5,23,24]. FT MS has the added advantage that it
can give MS ⁄ MS spectra by electron-capture dissocia-
tion (ECD) [25–27], which provides far more fragment
ion information than either collisionally-activated
dissociation (CAD) [28] or infrared multiphoton disso-
ciation (IRMPD) [29]. However, ECD’s descendant,
electron-transfer dissociation [30], works well with less
expensive MS instruments, and can be applied to pep-
tides and smaller proteins [31] with versatile ion–ion
reactions [32]. Of special promise for routine top-down
applications is the recently developed Orbitrap mass
spectrometer, which has resolution and mass accuracy
capabilities approaching those of FT MS, with very
promising cost advantages [33]. ECD and electron-
transfer dissociation are less sensitive than CAD or
IRMPD, in part because they produce far more
product ions.
Identification
To date, by far the largest use of MS proteomics has
been to identify unknown proteins, usually by match-
ing mass values against those from a list of sequences
predicted from the precursor DNA. The quantities of
these proteins that are expressed can differ by many
orders of magnitude, so that a specific problem often
requires preconcentration ⁄ separation (e.g. LC). In bot-
tom-up identifications, the partial or full sequence of
an individual peptide is predicted from its molecular
mass and MS ⁄ MS mass values, with the number and
uniqueness of these values determining the peptide
identification accuracy. The matching of multiple pep-
tide sequences with that of a predicted protein
increases the bottom-up identification accuracy,
although it is possible that the same peptide data could
also match those of another protein in the mixture
(identified peptides that do not match a predicted pro-
tein are typically ignored). Several bottom-up
approaches achieve 1% identification accuracy in
routine applications [9–13]. Sensitivity, automation and
throughput can also be of vital importance, but these
depend on the combination of separation methods,
MS instrumentation, and computation employed.
Top-down MS ⁄ MS of the selected molecular ion
mass representing a specific protein produces far more
fragments that have much higher masses, and are thus
more unique, and the more expensive FT MS instru-
mentation used with the top-down approach also pro-
vides much higher mass accuracy [6,18,23,34].
Furthermore, these fragment mass values originate
from the same molecular ions, so they must all be
characteristic of that protein’s sequence and molecular
mass value. Thus, top-down data can give an accuracy
F. W. McLafferty et al. Top-down MS of proteins
FEBS Journal 274 (2007) 6256–6268 ª 2007 The Authors Journal compilation ª 2007 FEBS 6257
of identification that is orders of magnitude higher
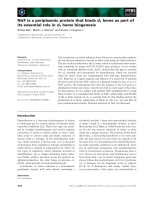
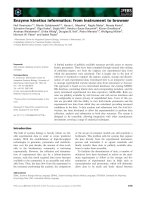
[6,23,35]. For example, Begley and co-workers [21] iso-
lated an enzyme YjbV involved in the B. subtilis thia-
mine biosynthesis pathway for which 1D SDS-PAGE
analysis indicated an approximate mass of 3 kDa
(Fig. 1). The top-down ESI ⁄ FT MS spectrum of this
protein with nozzle-skimmer CAD dissociation (Fig. 1)
confirmed the YjbV sequence and demonstrated the
absence of any post translational modifications. Not
only does the measured molecular mass value of
31 407.1 agree with the predicted mass from the DNA
sequence at 31 406.9 Da, within the limits of experi-
mental accuracy, but also there are 23 top-down frag-
ment mass values that agree with those expected from
single backbone cleavages (Fig. 1). Thus, each frag-
ment contains either the N-terminus or C-terminus,
providing extensive confirmatory sequence information
(see below) for this SDS ⁄ PAGE-purified protein.
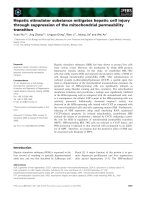
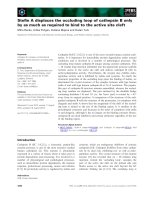
For protein identifications in complex mixtures, a
dramatic advantage of the top-down approach is
that a final separation stage can be done in the
FT MS instrument. For example, after rough separa-
tion of the proteins from Arabidopsis thaliana, the
stromal protein fraction was introduced directly by
ESI into the FT MS instrument to yield an ESI
mass spectrum in which the molecular ions from 14
different proteins can be distinguished (Fig. 2) [20].
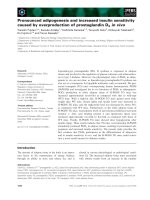
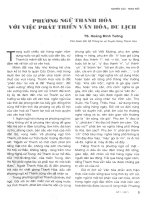
Figure 3 shows a protein’s molecular ion isotopic
cluster that yielded a measured molecular mass of
20 211.3 Da. An obvious identification was the DNA-
predicted protein At1g06680, whose molecular mass is
20211.9 Da. As a convincing confirmation, the CAD
MS ⁄ MS spectrum of this isolated ion cluster included
eight peaks of 8246–9308 Da whose mass differences
matched those expected in the predicted protein for
the sequence A-V-X
4
-F-G-G-(S + E) (Fig. 3) [20].
Extending this to mixtures of large proteins (see
below), nozzle-skimmer dissociation spectra of 1 : 1,
2 : 1 and 3 : 1 mixtures of 144 and 116 kDa proteins
showed the corresponding molecular ions and, for
each, 11–17 different mass values of 1–10 kDa that
represented their b or y fragment ions with a standard
deviation of 5 p.p.m. [36].
ECD
The development of ECD [25] has made possible a
dramatic increase in the proportion of inter-residue
backbone bonds that can be cleaved in molecular ions.
The high-energy ( 5 eV) recombination of an electron
with the multiply protonated ion makes differences in
bond dissociation energies much less important and
leads to much more indiscriminate protein backbone
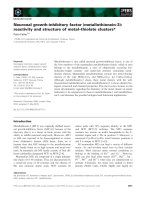
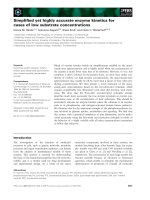
cleavages. For example, 250 of the 258 inter-residue
bonds could be cleaved (as assigned by the terminus-
containing ions c, z., a., b and y) in bovine carbonic
anhydrase (BCA) molecular ions in 25 ECD ⁄ CAD
spectra [19], with 183 bonds being cleaved in a single
‘plasma ECD’ spectrum (Fig. 4) [26]. Obviously, this
amount of mass spectral information makes possible
even higher identification reliabilities, and also extensive
de novo sequencing and structural characterization.
Fig. 1. Left: 1D SDS ⁄ PAGE chromatograms
of ThiD from E. coli and of unknown YjbV
from B. subtilis. Right, above: ESI spectrum
of YjbV, molecular ion isotopic peaks. Right,
below: nozzle-skimmer dissociation spectral
data, YjbV fragment peaks. The ‘) 20 ’ after
the molecular mass value signifies that the
main component ion of the most abundant
isotopic peak contains 20
13
C atoms and
has this mass value.
Top-down MS of proteins F. W. McLafferty et al.
6258 FEBS Journal 274 (2007) 6256–6268 ª 2007 The Authors Journal compilation ª 2007 FEBS
Characterization
The high specificity of the top-down approach for pro-
tein structural characterization is due to the extensive
molecular connectivity information that it provides;
this is not destroyed by proteolysis. The peptides from
proteolysis usually represent substantially less than
100% coverage of the protein sequence, so that even
when their mass information is consistent with a previ-
ously identified protein, the sample protein could have
missing or extra parts. In the top-down approach, an
incorrect molecular mass value directly indicates the
presence of PTMs and ⁄ or an incorrect sequence. In
another ESI mass spectrum of proteins isolated from
Fig. 2. ESI mass spectrum of the isolated
stromal proteins from A. thaliana with their
measured molecular mass values [20].
Fig. 3. ESI mass spectrum of the isolated chloroplast proteins from A. thaliana (top). The 20 211.3 Da 19+ ions (< 10% abundance) were
subjected to top-down MS ⁄ MS to yield the CAD spectrum (bottom), which is consistent with the predicted sequence of At1g06680, molec-
ular mass 20 211.9 Da.
F. W. McLafferty et al. Top-down MS of proteins
FEBS Journal 274 (2007) 6256–6268 ª 2007 The Authors Journal compilation ª 2007 FEBS 6259
A. thaliana [20], molecular ions representing a 5%
component gave a molecular mass of 16 309.7 Da, but
this matched none of the DNA-predicted proteins.
MS ⁄ MS of these ions gave the C-terminal sequence of
Fig. 5. These and all other peaks of that spectrum did
match those expected for the predicted protein
At4g21280, although its molecular mass of
16 123.4 Da is lower than that found by 186 Da.
Dissociation of the 16 121.8 Da fragment peak
(MS ⁄ MS ⁄ MS, Fig. 5) showed a fragment ion resulting
from an initial loss of 186.0 Da, followed by cleavages
corresponding to the N-terminal sequence of the pre-
dicted protein; the cleavage loss of the signal peptide
left two more amino acids on the protein than pre-
dicted. Even if the bottom-up approach did provide
mass data on a peptide containing these amino acids,
these data would have been ignored in most protocols.
However, even measuring a molecular mass value
that is the same as that predicted is not a guarantee
that the predicted sequence is correct. In an early
(1993) example of top-down identification [23], our
measured molecular mass value, 29 024.2 Da, of BCA
matched well the value that was calculated,
29 024.7 Da, from the published sequence. Further-
more, MS ⁄ MS (nozzle-skimmer CAD) of the molecu-
lar ions gave 21 terminal fragment ions that were also
consistent with the published sequence. However, our
2003 plasma ECD spectrum of BCA (Fig. 4; 183
cleavage sites) gave 512 mass values [26], of which 45
were in error by ) 1 Da; these values all represented
cleavages in the region of residues 10–31. This is
strong evidence that the residue reported as Asp10
should be Asn10, and Asn31 should be Asp31
(Asp CO-OH, Asn CO-NH
2
, Dm ¼ –1 Da; note that
these changes do not affect the molecular mass value
of the protein). Detecting this error in the usual bot-
tom-up approach would be difficult, as peptides that
incorporate residues 10 or 31 would not match a pre-
dicted sequence and so would be ignored. Worse yet,
in our 1999 top-down study of BCA [5], + 1.00 Da
and + 0.99 Da errors found for peptides Phe19–
Asp33 and Asp18–Lys35 were termed ‘unexpected
(and unexplained) anomalies’. Obviously, the precision
of locating such sequence errors or PTMs is depen-
dent on obtaining fragment ion masses representing
nearby dissociations on either side of the error; in the
unusual Fig. 4 case of nearby offsetting errors, having
multiple ions representing cleavages between almost
all neighboring residues made it clear that these were
not ‘anomalies’.
Post-translational modifications are the most com-
mon challenge for the structural characterization of
proteins. Special bottom-up techniques have been
developed for specific PTMs, e.g. affinity separation of
the protein digest to concentrate all glycosylated or all
phosphorylated peptides for MS ⁄ MS. For a sample
containing proteins modified on different sites, the bot-
tom-up approach cannot characterize individual pro-
teins. In contrast, the top-down approach can select
molecular ions with a molecular mass value cor-
responding to, for example, a single substitution;
MS ⁄ MS will then show the substituent positions of dif-
ferent isomers. A problem for MS ⁄ MS of either the
peptides for the bottom-up approach or of the proteins
for the top-down approach is that backbone dissocia-
tion techniques such as CAD or IRMPD can also
cleave off side-chain substituents such as glycosylated,
phosphorylated or sulfonated components, thus
Fig. 4. A single plasma ECD spectrum of
BCA whose 512 different m ⁄ z values define
183 of its 258 inter-residue cleavage sites
[26]. Of these m ⁄ z values, 45 are 1 Da
higher than those predicted by the protein
database sequence, and all represent cleav-
ages between the proposed Asp10 and
Asn31. This shows that these identifications
are reversed, an error that does not affect
the molecular mass value and a sequence
consistent with those of sheep and human
carbonic anhydrases.
Top-down MS of proteins F. W. McLafferty et al.
6260 FEBS Journal 274 (2007) 6256–6268 ª 2007 The Authors Journal compilation ª 2007 FEBS
destroying information on their backbone location.
However, the energetic (‘nonergodic’) dissociation of
ECD is localized on the backbone, with little accompa-
nying cleavage of weaker side-chain modifications such
as glycosylated [37] and phosphorylated structures [38]
(and even of noncovalent bonding and conformational
tertiary protein structures; see below). Top-down ECD
and CAD of b-casein gave 126 out of the possible 208
backbone cleavages (Fig. 6); the ECD cleavages not
only indicate the five phosphorylation sites without
loss of these side chains, but also that these cleavages
are so positioned that they would have specified phos-
phorylation if it had occurred at any of the other 21
possible sites (Ser, Thr, Tyr) of b-casein [38]. Although
ECD requires the more expensive FT MS instrumen-
tation, it measures all product ions simultaneously,
which is of particular value for repeated quantitative
measurements, e.g. variable phosphorylation of isolated
b-casein samples.
Unexpected modifications are especially difficult for
classic and bottom-up methods, which must be selected
or tailored for the specific PTM. In the biosynthesis of
NAD, the enzyme 3-hydroxyanthranilate-3,4-dioxygen-
ase (HAD) catalyzes the oxidative ring opening of
3-hydroxyanthranilate, which, with cyclization, forms a
quinolinate [39]. Excess quinolinate is implicated in
neurological disorders such as stroke and Huntington’s
disease, and 4-halohydroxyanthranilates have been
found to be specific and potent HAD inhibitors. To
check for covalent modifications of the enzyme, the
effect of the inhibitor on the molecular mass value of
HAD was measured; instead of an adduct increase, or
no change, the value had unexpectedly decreased from
22 417.0 Da to 22 413.2 Da, a loss of 4 Da. MS ⁄ MS
of these molecular ions (Fig. 7) cleaved 144 of the 193
inter-residue bonds (78 uniquely from ECD), confirm-
ing almost completely the predicted sequence of the
first 75 residues after eliminating the mistakenly pre-
dicted N-terminal Met. The fragment ions containing
the C-terminus have the predicted mass values going
back 10 residues to Cys183, but after Cys180 they are
all 2 Da lower than predicted until Cys149 and
Fig. 5. Partial CAD spectrum (top) of the
16+ ions of molecular mass 16 309.7 Da
(5% abundance) from ESI of the thylakoid
peripheral proteins isolated from A. thaliana .
This spectrum matched the masses pre-
dicted for the C-terminus of the protein
At4G21280, molecular mass 16 123.4 Da.
A partial CAD spectrum (bottom) of the
16 121.8 Da 15+ fragment ions
(MS ⁄ MS ⁄ MS) matched that protein’s N-ter-
minus plus two signal peptide amino acids
whose mass corresponds to the 186 Da dis-
crepancy in the protein molecular mass
value.
F. W. McLafferty et al. Top-down MS of proteins
FEBS Journal 274 (2007) 6256–6268 ª 2007 The Authors Journal compilation ª 2007 FEBS 6261
Cys146, after which they are low by 4 Da, the
decrease of the molecular mass value. The most proba-
ble reason for a 2 Da decrease is the formation of an
S–S bond; although this was totally unexpected and
unprecedented, the top-down approach efficiently gave
a specific characterization of the inhibitor mechanism
[39]. Even if two S–S bonds had been suspected, identi-
fying for each their two specific cysteines cut of the
10 possible for the five cysteines (including Cys127),
would be difficult by classic or bottom-up methods.
Deamidation of Asn or Gln in proteins has impor-
tant effects on enzyme activity and folding, and has
even been proposed as a biological clock [40]. How-
ever, changing –CO-NH
2
to –CO-OH only produces a
mass increase of 1 Da; as in Fig. 4, this makes the
ability of FT MS to resolve protein ion isotopic peaks
of critical importance for such a mass shift determina-
tion. The most abundant of the 13+ molecular ions of
reduced RNase A before deamidation (Fig. 8A) shows
Fig. 7. ECD, CAD and IRMPD spectral data of HAD treated with
inhibitor [22]. C-terminal fragment ions 1–4 Da below the mass
values predicted for untreated HAD clearly indicate the unexpected
S–S bonds Cys146 to Cys149 and Cys183 to Cys186.
Fig. 6. Inter-residue backbone fragmentations from the ECD spect-
rum of b-casein’s three variants, molecular masses 24 008.2 Da,
23 968.2 Da, and 24 077.2 Da [38]. These fragmentations are con-
sistent with the known phosphorylations at Ser15, Ser17, Ser18,
Ser19, and Ser35. These fragmentations would also specifically
indicate any phosphorylation that occurred at the other 21 possible
Ser, Thr and Tyr sites.
Fig. 8. Molecular ion isotopic clusters from ESI of the product mix-
tures from deamidation of RNase A over increasing time periods.
Deamidation of any one of the 17 Asn and Gln sites of RNase A
produces a 1 Da increase in the mass, –CO-NH
2
fi –CO-OH, of
the molecular ions of that product. The observed isotopic abun-
dances give calculated best fits for the average increases of 0.0,
1.0, 1.8, 3.7 and 4.4 Da, respectively, in the masses of the prod-
ucts [40].
Top-down MS of proteins F. W. McLafferty et al.
6262 FEBS Journal 274 (2007) 6256–6268 ª 2007 The Authors Journal compilation ª 2007 FEBS
a mass of 13 689.3 Da versus the calculated value
13 689.3 Da. The circles represent the calculated abun-
dance distribution for the isotopic peaks whose maxi-
mum peak contains mainly
13
C
8
, whereas the squares
represent the distribution 1 Da higher. To determine
the mass increase with increasing time of deamidation
(pH 9.6), the best fit of calculated intensity values
(squares) was determined (Fig. 9B–E). The correspond-
ing mass increase values in the ECD and CAD frag-
ment ions were determined similarly and are plotted
for the four product samples in Fig. 9 as mass
increases (decreases) for the N-terminal (C-terminal)-
containing fragment ions. Thus, for the + 1.0 Da sam-
ple (Fig. 8B), the N-terminal fragment ions show little
increase in mass with increasing size until Asn67, with
this increase of 1.0 Da staying constant for larger
N-terminal ions and with the C-terminal ions showing
the complementary decrease. This demonstrates
directly that Asn67, the only deamidation site found
previously, is indeed deamidated before any other resi-
due. In a similar fashion, the samples with 1.8, 3.7 and
4.4 Da increases show that Asn71 and Asn94 are
nearly equally reactive as the next sites, followed by
Asn34 and then Gln74 [40]. Other examples show the
utility of top-down MS ⁄ MS for such kinetic studies
[17,22,41].
Top-down quantitative analysis
Measuring the differences in protein expression levels
that result from disease states, environment, etc. is
critically important in many biomedical investiga-
tions. The protein quantities in cases of normal and
perturbed expression are compared accurately by iso-
topically labeling the proteins from one and compar-
ing in their mixture the corresponding peaks of their
respective peptides, usually differing by three or
more mass units [9–12]. The kinetic deamidation
study above (Fig. 9), in a similar fashion, compares
the quantities of proteins differing in the position of
deamidation (only a + l Da change) with the multi-
ple MS ⁄ MS spectral peaks, providing multiple mea-
surements of the quantities. The top-down approach
should be the method of choice for quantitation of
position isomers of proteins containing multiple mod-
ifications [42].
Fig. 9. ECD spectral data from the RNase A deamidation samples of Fig. 8. Deamidation at an individual residue of a specific product causes
a 1 Da increase in any fragment ion containing that residue. The average mass gain of N-terminal and C-terminal fragment ions are plotted
as positive and negative, respectively, mass increases, with the molecular ion mass increases of Fig. 8 designated on the right ordinate [40].
F. W. McLafferty et al. Top-down MS of proteins
FEBS Journal 274 (2007) 6256–6268 ª 2007 The Authors Journal compilation ª 2007 FEBS 6263
The top-down approach for larger
(> 50 kDa) proteins
The basic information for identification and character-
ization of proteins comes from the masses of their
dissociation products. The solution-phase enzymatic
dissociation used for the bottom-up approach is far
more generally applicable than the gas-phase MS ⁄ MS
dissociation methods used with protein molecular ions
for the top-down approach. With increasing protein
size, the hydrophilic (e.g. hydrogen bonds) and hydro-
phobic tertiary bonding becomes more complex and
stabilizing. Such native conformer structures of pro-
teins in solution are easily destroyed by various reac-
tive agents, but top-down dissociation methods for
gaseous protein ions, such as CAD and IRMPD, are
unimolecular, and so require the use of increasing
amounts of energy for the dissociation of increasingly
large protein ions. Basic studies over the past 15 years
have shown fundamental differences in protein confor-
mations in solution versus the gas phase, with H ⁄ D
exchange identifying reactive regions of the conforma-
tion [43–45], ion mobility measuring conformational
cross-sections [46,47], ECD identifying regions of ter-
tiary noncovalent bonding, as these are preserved when
backbone bonds are cleaved [48,49], and infrared
photodissociation spectroscopy characterizing func-
tional group environments [44,50]. For example,
charge sites, such as the protonated side chains of
basic residues, in solution are solvated out into the
aqueous phase, while in the gas phase they are instead
solvated onto the protein backbone, with this appar-
ently favored if the backbone is in an a-helical struc-
ture [44–50].
ECD itself causes negligible cleavage of this tertiary
structure. However, its noncovalent bonds have sub-
stantially lower bond dissociation energies, in general,
so that limited activation by earlier or concurrent
CAD or IRMPD can denature the tertiary structure
sufficiently to produce fragment ions by ECD back-
bone cleavage (activated ion ECD [27]), without this
activation also forming abundant CAD products.
However, for protein molecular ions larger than
50 kDa, electrosprayed from denatured solutions,
this tertiary structure has become so strong and exten-
sive that conventional activation by CAD or IRMPD
gives few or no backbone cleavages, making the top-
down approach ineffective [51].
A possible solution to this problem was indicated by
the study of conformational changes occurring during
solvent evaporation immediately after electrospray
introduction into the FT mass spectrometer [52]. Solu-
tion protein conformations are actually unfolded dur-
ing electrospray; use of native ECD [53] showed that
ECD could occur without externally added electrons
when electrosprayed native cytochrome c unfolded in
the inlet capillary, exposing basic residues that
attracted electrons and caused ECD. Solvent removal
reduces or destroys hydrophobic bonding. Further-
more, in solution, water molecules solvate the protein’s
protonated side chains; on solvent removal, these are
immediately available for new hydrogen bonding.
Thus, supplying thermal and collisional energy during
solvent evaporation can slow the new folding stabiliza-
tion of the protein ions, while also providing sufficient
excitation to effect cleavage before the gaseous confor-
mation becomes too stable [52].
This new technique of prefolding dissociation (PFD)
has now been successfully applied to 116, 144, 200 and
229 kDa proteins [36], using a 6 Tesla FT MS instru-
ment [15–17]. ESI of formylglycinamide ribonucleotide
amidotransferase (PurL) (1315 residues), whose
reported sequence [54] corresponds to a molecular
mass of 143 635 Da, gave the Fig. 10 spectrum
indicating a molecular mass of 143 500 ± 23 Da. Our
nozzle-skimmer dissociation system can vary the ion
Fig. 10. ESI mass spectrum of PurL. Isotopic peaks are not resolved; deconvolution yields a molecular mass of 143 500 ± 23 Da [36].
Top-down MS of proteins F. W. McLafferty et al.
6264 FEBS Journal 274 (2007) 6256–6268 ª 2007 The Authors Journal compilation ª 2007 FEBS
accelerating voltage for CAD both in the 1 Torr
pressure region before the skimmer (V
pre
) and in the
10
)3
Torr region after the skimmer (V
post
). In gen-
eral, V
pre
produces many low-energy collisions to
cleave noncovalent bonds, whereas V
post
produces
fewer collisions with energies approaching the acceler-
ating voltage to cleave backbone bonds. Different
combinations of V
pre
, V
post
and capillary temperature
values in 11 PFD spectra gave 173 different inter-resi-
due backbone cleavages (Fig. 11). In a serendipitous
discovery, additives to the ESI solution such as ammo-
nium tartrate increased the number of cleavages by
50%, with a total of 21 spectra showing 287 differ-
ent cleavages (Fig. 11) [36]. These are only between the
first 240 residues from each end, so that here they
provide extensive ( 60%) sequence coverage. For
example, these data clearly show that the predicted
N-terminal Met is not present; this changes the pre-
dicted molecular mass value to 143 504 Da, in good
agreement with that found of 143 500 ± 23 Da. How-
ever, no information has been obtained from the
central 900 residues; we picture this gaseous protein
conformation as a ‘ball of spaghetti’, for which the
energetic activation has denatured the free ends or has
prevented them from folding. Possibly, the highly ener-
getic ECD in the capillary-skimmer region could effect
a few cleavages in the center of the protein to form
additional loose ends to be denatured out of the ball
of spaghetti.
The ESI spectrum of the 200 kDa human comple-
ment C4 glycoprotein (of 1714 residues in three chains
connected by three S–S bonds) [55] had no molecular
ions. Nearly complete deglycosylation (of predicted
molecular mass 186 437 Da) was indicated, as gentle
PFD gave fragment ions of 20 838 Da (b-185 of the
b-chain) and 165 746 ± 80 Da, with the total
186 584 ± 80 Da indicating < 0.1% remaining glyco-
sylation. This was confirmed by stronger PFD, with
which 87 fragment ions were found to correspond to
different cleavages of the deglycosylated protein. This
contains 27 Cys residues, but it was not known which
are still in the –SH form or which form S–S bonds,
and what are the connectivities for the latter. As for
HAD [39] above, the presence of an S–S bond in a ter-
minal fragment ion causes the PFD fragment mass to
be 2 Da less than the sequence-predicted value, and
fragment ions are usually not observed from cleavages
between the Cys residues, as they are held together by
the S–S bond. With this, eight additional S–S bonds
could be specified [36].
The largest protein examined, mycoserosic acid
synthase, had a predicted [56] molecular mass of
229 067 da (2154 residues), whereas ESI gave
228 934 ± 60 Da. Five PFD spectra designated 62
cleavages by omitting the predicted N-terminal Met,
correcting the molecular mass value to 228 936 Da to
agree with that measured. Its ‘ball of spaghetti’ is more
difficult to unravel; cleavages were limited to 134 and
182 residues from the N-terminus and C-terminus,
respectively. Very recently in collaboration with
M. Boyne and N. Kelleher, (University of Illinois,
Urbana, IL) PFD has also been implemented on an
8.4 Tesla FT MS instrument, despite its substantially
different ion entrance system, which includes an ion
funnel and octupole for ion storage.
Conclusions
The top-down and bottom-up proteomics approaches
are obviously complementary. The identification of
proteins from among those predicted by the DNA
sequence still has by far the largest sample demands.
In most cases, the bottom-up approach, requiring less
sophisticated instrumentation and expertise, should be
tried first for qualitative identification, although increas-
ing demands for more accurate quantitation provide a
promising area for the top-down approach [36,57,58].
Reliability of identification can be far superior with the
Fig. 11. PFD spectral data of PurL. Inter-residue backbone fragmentations are indicated by: N-terminal-containing b fragment ions (left, above
line); C-terminal-containing y ions (right, above line); and secondary fragment ions (below line). Top line: 173 different fragmentations from
11 spectra using various values of capillary temperature and preskimmer and postskimmer accelerating voltages. Bottom: 287 in total,
including 10 additional spectra with ammonium tartrate added to the ESI solution.
F. W. McLafferty et al. Top-down MS of proteins
FEBS Journal 274 (2007) 6256–6268 ª 2007 The Authors Journal compilation ª 2007 FEBS 6265
top-down approach, reaching its ultimate level in
de novo sequencing [34]. For protein characterization
of sequence and PTMs, the general superiority of the
top-down approach is now clear [35,59]. Although
excellent bottom-up methods have been developed for
routine characterization, especially quantitative, of spe-
cific problems such as phosphorylation [59] of a partic-
ular enzyme, accurate masses for the molecular ion
and fragment ions representing all inter-residue back-
bone cleavages essentially provide de novo sequencing
and characterization of PTMs. The recent research of
leading laboratories such as those of Kelleher (e.g.
histones) [34,57–62], Walsh [58,62], and Hunt [30,59]
indicate that the unique capabilities of the top-down
approach deserve consideration for important pro-
teomics research.
Acknowledgements
We thank Barbara Baird, Ian Jardine, Neil Kelleher,
Harold Scheraga and Klaas van Wyck for valuable
discussions, and the General Medical Institute of the
National Institutes of Health, GM16609, for generous
financial support.
References
1 Fenn JB, Mann M, Meng CK, Wong SF & Whitehouse
CM (1989) Electrospray ionization for mass spectrome-
try of large biomolecules. Science 246, 64–71.
2 Karas M & Hillenkamp F (1988) Laser desorption ioni-
zation of proteins with molecular masses exceeding
10,000 daltons. Anal Chem 60, 2299–2301.
3 Henry KD, Williams ER, Wang BH, McLafferty FW,
Shabanowitz J & Hunt DF (1989) Fourier-transform
mass spectrometry of large molecules by electrospray
ionization. Proc Natl Acad Sci USA 86, 9075–9078.
4 Tanaka K, Waki H, Ido Y, Akita S, Yoshida Y &
Yoshida T (1988) Protein and polymer analyses up to
m ⁄ z 100,000 by laser ionization time-of-flight mass
spectrometry. Rapid Commun Mass Spectrom 2,
151–153.
5 Kelleher NL, Lin HY, Valaskovic GA, Aaserud DJ,
Fridriksson EK & McLafferty FW (1999) Top down
versus bottom up protein characterization by tandem
high-resolution mass spectrometry. J Am Chem Soc 121,
806–812.
6 Kelleher NL (2004) Top-down proteomics. Anal Chem
76, 197A–203A.
7 Rostom AA, Fucini P, Benjamin DR, Juenemann R,
Nierhaus KH, Hartl FU, Dobson CM & Robinson CV
(2000) Detection and selective dissociation of intact
ribosomes in a mass spectrometer. Proc Natl Acad Sci
USA 97, 5185–5190.
8 Loo JA, Berhane B, Kaddis CS, Wooding KM, Xie Y,
Kaufman SL & Chernushevich IV (2005) Electrospray
ionization mass spectrometry and ion mobility analysis
of the 20S proteasome complex. J Am Soc Mass
Spectrom 16, 998–1008.
9 Henzel WJ, Watanabe C & Stults JT (2003) Protein
identification: the origins of peptide mass fingerprinting.
J Am Soc Mass Spectrom 14, 931–942.
10 McDonald WH, Yates JR 3rd (2003) Shotgun proteo-
mics: integrating technologies to answer biological ques-
tions. Curr Opin Mol Ther 5, 302–309.
11 Aebersold R & Mann M (2003) Mass spectrometry-
based proteomics. Nature 422, 198–207.
12 Gygi SP & Aebersold R (2000) Mass spectrometry and
proteomics. Curr Opin Chem Biol 4, 489–494.
13 Savitski MM, Nielsen ML, Kjeldsen F & Zubarev RA
(2005) Proteomics-grade de novo sequencing approach.
J Proteome Res 4, 2348–2354.
14 Chait BT (2006) Mass spectrometry: bottom-up or top-
down? Science 314, 65–66.
15 Ge Y, Lawhorn BGEI, Naggar M, Strauss E, Park JH,
Begley TP & McLafferty FW (2002) Top down charac-
terization of larger proteins (45 kDa) by electron cap-
ture dissociation mass spectrometry. J Am Chem Soc
124, 672–678.
16 Park JH, Dorrestein PC, Zhai H, Kinsland C, McLaff-
erty FW & Begley TP (2003) Biosynthesis of the thia-
zole moiety of thiamin pyrophosphate (vitamin B
1
).
Biochemistry 42, 12430–12438.
17 Narayan M, Xu G, Ripoli DR, Zhai H, Breuker K,
Wanjalla C, Leung HJ, Navon A, Welker E, McLaffer-
ty FW et al. (2004) Dissimilarity in the reductive
unfolding pathways of two ribonuclease homologues.
J Mol Biol 338, 795–809.
18 Horn DM, Zubarev RA & McLafferty FW (2000)
Automated de novo sequencing of proteins by tandem
high-resolution mass spectrometry. Proc Natl Acad Sci
USA 97, 10313–10317.
19 Sze SK, Ge Y, Oh HB & McLafferty FW (2002) Top
down mass spectrometry of a 29 kDa protein for charac-
terization of any posttranslational modification to within
one residue. Proc Natl Acad Sci USA 99, 1774–1779.
20 Zabrouskov V, Giacomelli L, van Wijk KJ & McLafferty
FW (2003) A new approach for plant proteomics.
Characterization of chloroplast proteins of Arabidopsis
thaliana by top-down mass spectrometry. Mol Cell
Proteomics 2, 1253–1260.
21 Park JH, Burns K, Kinsland C & Begley TP (2004)
Characterization of two kinases involved in thiamine
pyrophosphate and pyridoxal phosphate biosynthesis in
Bacillus subtilis: 4-amino-5-hydroxymethyl-2-methyl-
pyrimidine kinase and pyridoxal kinase. J Bacteriol
186, 1571–1573.
22 Xu G, Zhai H, Narayan M, McLafferty FW & Scheraga
HA (2004) Simultaneous characterization of the
Top-down MS of proteins F. W. McLafferty et al.
6266 FEBS Journal 274 (2007) 6256–6268 ª 2007 The Authors Journal compilation ª 2007 FEBS
reductive unfolding pathways of RNase B isoforms by
top-down mass spectrometry. Chem Biol 11, 517–524.
23 Beu S, Senko MW, Quinn JP & McLafferty FW (1993)
Improved Fourier-transform ion-cyclotron-resonance
mass spectrometry of large biomolecules. J Am Soc
Mass Spectrom 4, 190–192.
24 Patrie SM, Charlebois JP, Whipple D, Kelleher NL,
Hendrickson CL, Quinn JP, Marshall AG & Mukho-
padhyay B (2004) Construction of a hybrid quadru-
pole ⁄ Fourier transform ion cyclotron resonance mass
spectrometer for versatile MS ⁄ MS above 10 kDa. JAm
Soc Mass Spectrom 15, 1099–1108.
25 Zubarev RA, Kelleher NL & McLafferty FW (1998)
Electron capture dissociation of multiply charged pro-
tein cations. A nonergodic process. J Am Chem Soc
120, 3265–3266.
26 Sze SK, Ge Y, Oh HB & McLafferty FW (2003) Plasma
electron capture dissociation for the characterization of
large proteins by top down mass spectrometry. Anal
Chem 75, 1599–1603.
27 Horn DM, Ge Y & McLafferty FW (2000) Activated
ion electron capture dissociation for mass spectral
sequencing of larger (42 kDa) proteins. Anal Chem 72,
4778–4784.
28 Senko MW, Speir JP & McLafferty FW (1994) Colli-
sional activation of large multiply charged ions using
Fourier transform mass spectrometry. Anal Chem 66,
2801–2808.
29 Little DP, Speir JP, Senko MW, O’Conner PB &
McLafferty FW (1994) Infrared multiphoton dissocia-
tion of large multiply charged ions for biomolecule
sequencing. Anal Chem 66, 2809–2815.
30 Syka JEP, Coon JJ, Schroeder MJ, Shabanowitz J &
Hunt DF (2004) Peptide and protein sequence analysis
by electron transfer dissociation mass spectrometry.
Proc Natl Acad Sci USA 101, 9528–9533.
31 Coon JJ, Ueberheide B, Syka JEP, Dryhurst DD,
Ausio J, Shabanowitz J & Hunt DF (2005) Protein
identification using sequential ion ⁄ ion reactions and
tandem mass spectrometry. Proc Natl Acad Sci USA
102, 9463–9468.
32 Pitteri SJ & McLuckey SA (2005) Recent developments
in the ion ⁄ ion chemistry of high-mass multiply charged
ions. Mass Spectrom Rev 24 , 931–958.
33 McAlister GC, Phanstiel D, Good DM, Berggren WT
& Coon JJ (2007) Implementation of electron-transfer
dissociation on a hybrid linear ion trap–orbitrap mass
spectrometer. Anal Chem 79, 3525–3534.
34 Siuti N & Kelleher NL (2007) Decoding protein modifi-
cations using top-down mass spectrometry. Nat Methods
4, 817–821.
35 Zamdborg L, LeDuc RD, Glowacz KJ, Kim YB,
Viswanathan V, Spaulding IT, Early BP, Bluhm EJ,
Babai S & Kelleher NL (2007) ProSight PTM 2.0:
improved protein identification and characterization for
top down mass spectrometry. Nucleic Acids Res 35,
701–706.
36 Han X, Jin M, Breuker K & McLafferty FW (2006)
Extending top-down mass spectrometry to proteins with
masses >200 kDa. Science 314, 109–112.
37 Mirgorodskaya E, Roepstorff P & Zubarev RA (1999)
Localization of O-glycosylation sites in peptides by elec-
tron capture dissociation in a Fourier transform mass
spectrometer. Anal Chem 71, 4431–4436.
38 Shi SDH, Hemling ME, Carr SA, Horn DM, Lindh I &
McLafferty FW (2001) Phosphopeptide ⁄ phosphoprotein
mapping by electron capture dissociation mass spec-
trometry. Anal Chem 73, 19–22.
39 Colabroy KL, Zhai H, Li T, Ge Y, Zhang Y, Liu A,
Ealick SE, McLafferty FW & Begley TP (2005) The
mechanism of inactivation of 3-hydroxyanthranilate-
3,4-dioxygenase by 4-chloro-3-hydroxyanthranilate.
Biochemistry 44, 7623–7631.
40 Zabrouskov V, Han X, Welker E, Zhai H, Lin C, van
Wijk KJ, Scheraga HA & McLafferty FW (2006) Step-
wise deamidation of ribonuclease A at five sites deter-
mined by top down mass spectrometry. Biochemistry 45,
987–992.
41 Zhai H, Dorrestein PC, Chatterjee A, Begley TP &
McLafferty FW (2005) Simultaneous kinetic character-
ization of multiple protein forms by top down mass
spectrometry. J Am Soc Mass Spectrom 16, 1052–
1059.
42 Garcia BA, Pesavento JJ, Mizzen CA & Kelleher NL
(2007) Pervasive combinatorial modification of histone
H3 in human cells. Nat Methods 129, 487–489.
43 McLafferty FW, Guan Z, Haupts U, Wood TD &
Kelleher NL (1998) Gaseous conformational structures
of cytochrome c. J Am Chem Soc 120, 4732–4740.
44 Oh HB, Breuker K, Sze SK, Ge Y, Carpenter BK &
McLafferty FW (2002) Secondary and tertiary struc-
tures of gaseous protein ions characterized by electron
capture dissociation mass spectrometry and photofrag-
ment spectroscopy. Proc Natl Acad Sci USA 99, 15863–
15868.
45 Robinson EW & Williams ER (2005) Multidimensional
separations of ubiquitin conformers in the gas phase:
relating ion cross sections to H ⁄ D exchange measure-
ments. J Am Soc Mass Spectrom 16, 1427–1437.
46 Hoaglund-Hyzer CS, Counterman AE & Clemmer DE
(1999) Anhydrous protein ions. Chem Rev 99, 3037–3079.
47 Koeniger SL & Clemmer DE (2007) Resolution and
structural transitions of elongated states of ubiquitin.
J Am Soc Mass Spectrom 18, 322–331.
48 Breuker K, Oh HB, Horn DM, Cerda BA & McLaffer-
ty FW (2002) Detailed unfolding and folding of gaseous
ubiquitin ions characterized by electron capture dissoci-
ation. J Am Chem Soc 124, 6407–6420.
49 Breuker K, Oh HB, Lin C, Carpenter BK & McLafferty
FW (2004) Nonergodic and conformational control in
F. W. McLafferty et al. Top-down MS of proteins
FEBS Journal 274 (2007) 6256–6268 ª 2007 The Authors Journal compilation ª 2007 FEBS 6267
electron capture dissociation of protein ions. Proc Natl
Acad Sci USA 101, 14011–14016.
50 Oh HB, Lin C, Hwang HY, Zhai H, Breuker K,
Zabrouskov V, Carpenter BK & McLafferty FW (2005)
Infrared photodissociation spectroscopy of electro-
sprayed ions in a Fourier-transform mass spectrometer.
J Am Chem Soc 127, 4076–4083.
51 Hicks LM, Mazur MT, Miller LM, Dorrestein PC,
Schnarr NA, Khosla C & Kelleher NL (2006)
Investigating nonribosomal peptide and polyketide
biosynthesis by direct detection of intermediates on
>70 kDa polypeptides using Fourier-transform mass
spectrometry. Chembiochem 7, 904–907.
52 Zhai H, Han X, Breuker K & McLafferty FW (2005)
Consecutive ion activation for top down mass spectrom-
etry: improved protein sequencing by nozzle-skimmer
dissociation. Anal Chem 77, 5777–5784.
53 Breuker K & McLafferty FW (2005) The thermal
unfolding of native cytochrome c in the transition from
solution to gas phase probed by native electron capture
dissociation. Angew Chem Int Ed 44, 4911–4914.
54 Anand R, Hoskins AA, Stubbe J & Ealick SE (2004)
Domain organization of Salmonella typhimurium form-
ylglycinamide ribonucleotide amidotransferase revealed
by X-ray crystallography. Biochemistry 43, 10328–
10342.
55 Seya T, Nagasawa S & Atkinson JP (1986) Location of
the interchain disulfide bonds of the fourth component
of human complement (C4): evidence based on the liber-
ation of fragments secondary to thiol–disulfide inter-
change reactions. J Immunol 136, 4152–4156.
56 Onwueme KC, Vos CJ, Zurita J, Ferreras JA & Quadri
LEN (2005) The dimycocerosate ester polyketide
virulence factors of mycobacteria. Prog Lipid Res 44,
259–302.
57 Du Y, Parks BA, Sohn S, Kwast KE & Kelleher NL
(2006) Top down approaches for measuring expression
ratios of intact yeast proteins using Fourier-transform
mass spectrometry. Anal Chem 78, 686–694.
58 Dorrestein PC, Blackhall J, Straight PD, Fischbach
MA, Garneau-Tsodikova S, Edwards DJ, McLaughlin
SM, Lin M, Gerwick WH, Kolter R et al. (2006) Activ-
ity screening of carrier domains within nonribosomal
peptide synthetases using complex substrate mixtures
and large molecule mass spectrometry. Biochemistry 45,
1537–1546.
59 Garcia BA, Joshi S, Thomas CE, Chitta RK, Diaz RL,
Busby SA, Andrews PC, Ogorzalek Loo RR, Shabano-
witz J, Kelleher NL et al. (2006) Comprehensive phos-
phoprotein analysis of linker histone H1 from
Tetrahymena thermophila. Mol Cell Proteomics 5,
1593–1609.
60 Thomas CE, Mizzen CA & Kelleher NL (2006) Mass
spectrometric characterization of human histone H3: a
bird’s eye view. J Proteome Res 5, 240–247.
61 Jiang L, Smith JN, Anderson SL, Ma P, Mizzen CA &
Kelleher NL (2007) Global assessment of combinatorial
post-translational modification of core histones in yeast
using contemporary mass spectrometry. LYS4 trimethy-
lation correlates with degree of acetylation on the same
H3 tail. J Biol Chem 21, 27923–27934.
62 Calderone CT, Iwig DF, Dorrestein PC, Kelleher NL &
Walsh CT (2007) Incorporation of nonmethyl branches
by isoprenoid-like logic: multiple beta-alkylation events
in the biosynthesis of myxovirescin A1. Chem Biol 14,
835–846.
Top-down MS of proteins F. W. McLafferty et al.
6268 FEBS Journal 274 (2007) 6256–6268 ª 2007 The Authors Journal compilation ª 2007 FEBS