báo cáo khoa học: " Usability evaluation of a clinical decision support tool for osteoporosis disease management" pps
Bạn đang xem bản rút gọn của tài liệu. Xem và tải ngay bản đầy đủ của tài liệu tại đây (2.65 MB, 12 trang )
RESEARC H ARTIC LE Open Access
Usability evaluation of a clinical decision support
tool for osteoporosis disease management
Monika Kastner
1*†
, Danielle Lottridge
2†
, Christine Marquez
3†
, David Newton
3†
, Sharon E Straus
1,3†
Abstract
Background: Osteoporosis affects over 200 million people worldwide at a high cost to healthcare systems.
Although guidelines are available, patients are not receivin g appropriate diagnostic testing or treatment. Findings
from a systematic review of osteoporosis interventions and a series of focus groups were used to devel op a
functional multifaceted tool that can support clinical decision-making in osteoporosis disease management at the
point of care. The objecti ve of our study was to assess how well the prototype met functional goals and usability
needs.
Methods: We conducted a usability study for each component of the tool–the Best Practice Recommendation
Prompt (BestPROMPT), the Risk Assessment Questionnaire (RAQ), and the Customised Osteoporosis Education
(COPE) sheet–using the framework described by Kushniruk and Patel. All studies consisted of one-on-one sessions
with a moderator using a standardised worksheet. Sessions were audio- and video-taped and transcribed verbatim.
Data analysis consisted of a combination of qualitative and quantitative analyses.
Results: In study 1, physicians liked that the BestPROMPT can provide customised recommendations based on risk
factors identified from the RAQ. Barriers included lack of time to use the tool, the need to alter clinic workflow to
enable point-of-care use, and that the tool may disrupt the real reason for the visit. In study 2, patients completed
the RAQ in a mean of 6 minutes, 35 seconds. Of the 42 critical incidents, 60% were navigational and most
occurred when the first nine participants were using the stylus pen; no critical incidents were observed with the
last six participants that used the touch screen. Patients thought that the RAQ questions were easy to read and
understand, but they found it difficult to initiate the questionnaire. Suggestions for improvement included
improving aspects of the interface and navigation. The results of study 3 showed that most patients were able to
understand and describe sections of the COPE sheet, and all considered discussing the information with their
physicians. Suggestions for improvement included simplifying the language and improving the layout.
Conclusions: Findings from the three studies informed changes to the tool and confirmed the importance of
usability testing on all end users to reduce errors, and as an important step in the development process of
knowledge translation interventions.
Background
Osteoporosis affects over 200 million people worldwide
[1], and the fractures it can cause represent a consider-
able financial burden to healthcare systems [2-6]. This
challenge is compounded by an increasingly aging popu-
lation [2,6,7], particularly since the clinical consequences
of osteoporosis can significantly impair quality of life,
physical function, and social interaction and can lead to
admission to long-term care [4,8]. Although guidelines
are available for osteoporosis disease management
[9-14], patients are not receiving appropriate diagnostic
testing or t reatment [15-17]. One potential solution to
closing these practice gaps is to use clinical decision
support systems (CDSSs), which can facilitate disease
management by translating high-quality evidence at the
point of care. We conducted a systematic review of ran-
domised controlled trials to determine what features of
current tools may support clinical decision-making in
osteoporosis disease management [18]. Findings
* Correspondence:
† Contributed equally
1
Department of Health Policy, Management and Evaluation, Faculty of
Medicine, University of Toronto, Toronto, Ontario, Canada
Full list of author information is available at the end of the article
Kastner et al. Implementation Science 2010, 5:96
/>Implementation
Science
© 2010 Kastner et a l; licensee BioMed Central Lt d. This is an O pen Access article distributed under the terms of the Creative Commons
Attribution License ( which permits unrestricted use, distribution, and reproduction in
any medium, provided the original work is properly cited.
indicated that few osteoporosis CDSSs exist and that the
disease-management components of interventions were
lacking in most studies [18]. Interventions consisting of
reminders and education targeted to physicians and
patients appeared more promising for increasing osteo-
porosis investigations and treatment than did single-
component or single-target interventions. Findings from
the systematic review and input from clinicians and
experts in information technology and human-factors
engineering were used to develop a conceptual model of
an osteoporosis tool. This mo del was qualitatively
explored in a series of focus groups to determine how
physicians perceived this conceptual model and which
key features, functions, and evidence were needed to
transform it into a functional prototype [19].
The resulting prototype tool is targeted to both physi-
cians and patients and consists of three components: (1)
an electronic osteoporosis Risk Assessment Question-
naire (RAQ) completed by eligible patients o n a tablet
PC in the clinic examination room; (2) a paper-based,
Best Practice Recommendation Prompt (BestPROMPT)
outlining appropriate osteoporosis disease-management
recommendations for use by physicians at the point of
care; and (3) a paper-based, Customised Osteoporosis
Educational (COPE) sheet given to patients at the end
of their physician visit. The first component of the tool
(i.e., the RAQ) is de signed so it can be completed on a
tablet PC by eligible patients (men ≥65 years and
women ≥50 years of age) in a clinic examination room
during the 5- to 15-minute waiting period prior to the
actual physician visit. Completion of the RAQ in the
examination room provides privacy for patients and the
ability to u se the audio support feature of the tool.
Patients can listen to the questions out loud (default) or
turn off the sound at any time during the qu estionnaire.
Once the questionnaire is completed, RAQ responses
are processed using a decision algorithm programmed
into the tablet PC, which automatically generates two
paper-based outputs using a wireless printer: one for the
physician (i.e., the BestPROMPT sheet) and one for the
patient (i.e., the COPE sheet). The BestPROMPT pro-
vides a summary of the patient’s RAQ responses, a sec-
tion outlining appropriate osteoporosis disease-
management recommendations (e.g., to initiate bone
mineral density testing or osteoporosis medications such
as bisphosphonates), and a graph to plot the patient’s
10-year absolute fracture risk. These features were
designed so that physicians would be able to use this
information with their patients at the point of care. The
COPE sheet summarizes patients’ osteoporosis risks
according to their RAQ responses and provides a sec-
tion outlining osteoporosis information customised to
their identified risks (i.e., an explanation of what each
risk factors means, and what they can do about them).
Although information technology or CDSSs, such as
the osteoporosis tool, can address important barriers to
clinical practice and may enhance the safety, quality,
and patient-centeredness of care while increasing effi-
ciency [20,21], there is an increasing body of evidence
showing unanticipated and undesired consequences to
impl ementation of these systems [22-26]. Without care-
ful consideration of system design, function, and end-
user perspectives, these systems can fail if rushed to
becom e an integral part of healthcare systems and prac-
tices either during rigorous evaluation or after imple-
mentation of such interventions [27]. If information
technology systems are integrated without evaluating
how they might impact end users or their existing work-
flow, they have the potential to be ineffective, function
poorly, and result in medical or technology-induced
errors [22,23]. Usability testing is an investigation of the
human-computer interaction–to provide practical feed-
back on the design of computer systems and user inter-
faces and provide information about the process of
using a system to char acterize decision-making, rea son-
ing skills, and the information-processing needs of parti-
cipants as they perform represent ative tasks that require
complex information processing [28-30]. Another
important consideration in the prototype development
processisiterativesystemsanalysis, which involves the
evaluation of the system during the design phase, fol-
lowed by further cycles of redesign and testing. These
evaluations are needed to ensure that the needs of end
users are considered over what researchers and
designers might perceive as important user require-
ments. Importantly, iterative analysis is needed before a
system is ever considered for implementation in clinical
practice [31].
The objectives of the current study were to conduct a
usability evaluation of the three components of the
osteoporosis tool to assess how well the prototype meets
functional goals (features, format, and interface) and
usability needs (outcome impact goals and end users’
requirements and information needs) and to determine
end users’ perceptions of the facilitators and barriers to
using the prototype at the point of care.
Methods
To determine if the osteoporosis prototype meets the
usability needs of all end users, a usability study was
planned for each component of the tool: usability study
1 (the BestPROMPT) ; usability study 2 (the RAQ), and
usability study 3 (the COPE sheet). All three studies
were designed according to the usability framework
described by Kushniruk and Patel [28] because it pro-
motes an evidence-based approach to deriving knowl-
edge and is regarded as the most useful method for
testing usability in the medical context [32,33]. It was
Kastner et al. Implementation Science 2010, 5:96
/>Page 2 of 12
anticipated that the osteoporosis tool would be changed
iteratively throughout the usability evaluation studies,
retested and evaluated, and a final modification made
once the desired functionality and usability w ere
achieved.
All usability studies were approved by the University
of Toronto and St. Michael’ sHospitalresearchand
ethics boards, and a written informed consent was
obtained from all participants. All studies consisted of
30- to 60-minute, one-on-one sessions with an experi-
enced moderator using a standardised, structured work-
sheet combined with a semistructured discussion using
open-ended questions to evalua te each tool component.
Participants were encouraged to ‘think aloud’ and verba-
lise their thoughts about the component being tested.
The target sample size for each study was five to eight
participants because evidence indicates that 70% of
severe usability problems can be uncovered within the
first five users and up to 85% by the eighth user, after
which the yield of identified problems tends to drop and
is also less significant [28,34].
Usability study 1: evaluation of the BestPROMPT sheet
The first study was conducted with full-time family phy-
sicians and general internal medicine specialists in the
greater Toronto area between May and September 2008.
Physicians were randomly selected from the College of
Physicians and Surgeons of Ontario database using a
standardised faxed recruitment letter. To reach the tar-
get sample size of eight participants, purposive sampling
from the St. Michael’s Family Practice Unit in Toronto
was required. Population exclusion criteria were general
internists who saw patients in a subspecialty practice
that excluded the possibility of seeing patients with
osteoporosis.
Usability sessions were designed to evaluate the Best-
PROMPT sheet with relevant end users for appropriate
content and format and to include tasks that would be
representative of the real uses of the sheet. This
involved showing physicians h ow the BestPROMPT
sheet is generated so that potential barriers to using it
at the point of care can be addressed in the context of
participants’ own workflow. To achieve this, the mod-
erator simulated a patient at risk for osteoporosis and
completed the RAQ on a tablet PC, which the physician
participant observed. Using a structured worksheet, the
BestPROMPT copy that was generated during this exer-
cise was used in the second part of the usability session
to elicit feedback on format (e.g., font, spacing), readabil-
ity, and understandability using a five-point Likert scale.
Open-ended questions were used to probe what partici-
pants found the most/least useful about the Best-
PROMPT and the barriers to using the sheet at the
point of care; we a lso included a validated, 10-item
System Usabil ity Scale [35] to assess the subjective
usability of the tool.
Usability study 2: evaluation of the RAQ
The second study was conducted with patie nts at risk
for osteoporosis (men ≥65 years of age and postmeno-
pausal women) between October and December 2008.
Patients were selected purposively from the patient
population of one family physician at the St. Michael’s
Family Practice Unit until at least five to eight patients
(per input device) were tested or usability problems
were eliminated. To maximize the number of eligible
patients to be recruited, sessions were planned with
patients immediately following their family physician
visit.
Usability sessions were designed to evaluate the RAQ
with its relevant end users (i.e., patients at risk for
osteoporosis) for appropriate content, format, naviga-
tion, and input device (stylus, mouse and keyboard, or
touch screen). The moderator used a standardised,
pilot-tested script and worksheet for the sessions, which
included tasks that would be the most representative of
the real uses of the R AQ. A goal for these sessions was
to ensure that the RAQ could be completed by partici-
pants with little to no assistance from the moderator (i.
e., to simulate what might be expected in real practice).
The usability sessions consisted of three parts: In part 1,
the moderator documented observed even ts as partici-
pants completed each RAQ question. This was supple-
mented by an embedded program, which generated a
timed log of each tap/click/touch to enable the calcula-
tion of the time it took to complete the RAQ and fre-
quency of incidents and data entry errors. The incident
log was developed based on the critical incidence tech-
nique pioneered by Flanagan et al. [36], whi ch can pro-
vide an objective assessment of events that make the
difference between success and failure (i.e., the critical
incident) [36]. We defined an incident in terms of its
negative impact: a problem or error according to two
levels of severity (critical or general). A critical incident
was defined as a problem that completely halte d the
normal functioning of the RAQ (e.g., unable to initiate
the questionnaire), whereas a general incident could
occur within one session or across sessions but did not
inhibit the completion of the RAQ (e.g., mis-tapping of
a button, activating the ‘Warning ’ w indow). Incident
types were classified as navigational, interface, technical,
input-device related, question to moderator, or other.
General incidents occurring at least two times within
one or across sessions were elevated to critical status.
Immediate changes were made only for critical inci-
dents. In the second part of the usability session,
observed critical incidents were used as memory probes
to clarify the problem and to identify what influence the
Kastner et al. Implementation Science 2010, 5:96
/>Page 3 of 12
incident had on the interaction with the system. The last
part of the session consisted of a series of semistruc-
tured, open-ended questions about the format, interface,
features, and content of the RAQ and what participants
liked/disliked about the questionnaire.
Usability study 3: evaluation of the COPE sheet
The third study was conducted with patients at risk for
osteoporosis in December 2008. Participants were
selected purposively from the same family physician’s
patient population as used in usability study 2 until at
least five to eight patients were recruited or usability
problems were eliminated. Usability sessions were
designed to evaluate the COPE sheet with its relevant
end users (i.e., patients at risk for osteoporosis) for
appropriate content and format. The ses sions consisted
of two parts: In part 1, participants were asked to com-
plete the RAQ so they could observe how the COPE
sheet is generated. This process enabled testing whether
the decision algorithm accurately translated the response
inputs from the RAQ into the educational content of
the COPE sheet. In part 2, the moderator conducted a
semistructured interview with participants to explore
their understanding of the COPE sheet, what they might
do if they had any unanswered questions about their
osteoporosis risks, and if they might consider discussing
the sheet with their physician. The moderator also asked
participants to rate the rea dability, understandability,
and format of the COPE sheet using a verbal five-point
Likert scale.
Data collection and analysis
All usability sessions were audiotaped and transcribed
verbatim. Usability study 2 was also videotaped to
observe users’ physical behaviour as they interacted with
the RAQ. Data collection and analysis consisted of a
combination of qualitative analysis to assess the effect of
technology on participant reasoning and decision-mak-
ing, and quantitative analysis to assess data from the
demographic questionnaire, System Usability Scale, criti-
cal incident log sheet, and Likert-type questions.
Qualitative data
Qualitative content analyses were guided by the constant
comparative method of grounded theory methodology
[31] and verbal protocol-analysis techniques [28,29].
Audio and video data were coded from transcripts using
a process of open, axial, and selective coding [37,38]
using NVivo 8 software (QSR International, Cambridge,
MA, USA). Two researchers independently developed a
coding scheme by identifying, classifying, and labelling
the primary patterns in the data from the transcripts.
During open coding, the constant comparative approach
was used to group the codes into categories (where each
category was considered a unit of analysis) and identify
themes. Axial coding was then done to look at the inter-
relationship of categories [37]. The frequency and con-
sistency with which participants indicated categories in
the transcripts were used to provide credibility to these
categories. We performed a calibration exercise between
two reviewers for appropriately classifying themes into
categories using Kappa statistics (in NVivo 8), and any
disagreements (considered as <90% agreement) were
resolved through consensus by a third reviewer. Videos
from usability study 2 were viewed by one researcher
and coded only for themes related to general and critical
incidents. Data from the coded video were used to sup-
plement themes identified by audio transcripts and to
corroborate incident log records from direct obs ervation
of participants.
Quantitative data
Quantitative data were analysed using frequency analysis
of demographic ques tions, task accuracy, and frequency
and classes of problems encountered; descriptive statis-
tics to calculate proportions and time to completion of
tasks (e.g., mean time to RAQ completion with standard
deviations [SDs]); Likert-scale questions (mean scores
with SDs); independent sample t-tests for comparing
groups for differences in mean time to RAQ completion
(with standard errors of the means [SEs]); and a one-
way between-groups analysis of variance (ANOVA) to
compare the effects of the three input devices on mean
time to RAQ completion. Time data were converted
from minutes:seconds to total seconds for data entry
into the statistical software, and means and SDs were
reconver ted to minutes:seconds for results tables; means
and their 95% confidence intervals (CIs) for comparison
groups were converted to minutes. All statistical ana-
lyses were carried out using SPSS (Macintosh version
17.0; IBM Corporation, Somers, NY, USA).
Testing-session worksheets and components of the
osteoporosis tool were modified and refined according
to changes suggested by quantitatively and qualitatively
analysed data and retested if findings indicated that sig-
nificant changes were recommended. The analysis was
thus cumulative and iterative, with new versions of the
tool components building on proceeding versions. This
procedure was continued wit h the transcripts and data
of subsequent usability sessions until themes were
saturated.
Results
Usability study 1 (BestPROMPT)
Table 1 shows the characteristics of the 11 physicians (9
family physicians and 2 general internists; 46% between
46 and 55 years of age) who participated in the usability
study. The mean overall System Usability Scale score
Kastner et al. Implementation Science 2010, 5:96
/>Page 4 of 12
was 80.5 (SD 9.5), which indicates a subjective global
view of the BestPROMPT as “relatively easy to use” [35].
Usability worksheet results
Data analyses of the semistructured interviews identified
three broad categories of themes:
1.
Participants’ perceptions of the barriers to using the
BestPROMPT: 91% of physicians identified lack of time
as the biggest barrier to using the sheet in family prac-
tice. Some were concerned that patients might not finish
the RAQ in time for the visit or that the tool would be
problematic in settings with no extra examinatio n
rooms. Other identified barriers to using the tool were
related to workflow and administrative processes, such
as increased clinic staff workload (e.g., explaining the
tool to patients, alteration of workflow to make the
BestPROMPT available at the point of care). About half
of the participants were particularly concerned that the
tool may disrupt the real reason for the visit and inter-
rupt or delay the care of patients with more serious
symptoms (e.g., chest pain). Suggestions to overcome
the lack of clarity in the Recommendation Box section
of the s heet were to highlight the Diagnosis section, to
distinguish between the Diagnosis and Treatment
Recommendation sections, and to indicate when a bone
mineral density test should be repeated.
2.
Participants’ perceptions of the facilitators to using
the BestPROMPT: Features that were perceived as facili-
tators were the inclusion of a 10-year absolute fracture
risk graph to show patients which risk region (low,
moderate, high) they fell into, the inclusion o f a Justifi-
cation section for the recommendations, and the provi-
sion of the most important information about risk,
diagnosis, and treatment on one page. Participants liked
the RAQ summary table because it provided an over-
view of their patients’ responses and highlighted their
major and minor risk factors. Some thought that this
informati on could be used as a reminder about risk fac-
tors that may have been overlooked or forgotte n, and to
select which patient should have a bone mineral density
test or which treatment should be started.
3.
Participants’ perceptions of using the BestPRO MPT
at the point of care: Most participants indicated that
they would use the tool at the point of care but not
necessarily during a standard scheduled visit. Sugges-
tions were t o use the sheet during a dedicated visit for
osteoporosis or a physical examination, and physicians
believed that these o ptions would provide more time to
discuss the information with patients. Suggestions to
enhance point-of-care use were to ensure that the prac-
tice workflow is considered during tool implementation
and to enable the wireles s printing of the BestPROMPT
so it can be available for review by physicians prior to
the patient visit.
Usability study 2 (RAQ)
Nineteen patients (mean age 72 years; 53% women)
from the practice of one family physician participated in
the usability study (Table 2). Sixty-eight percent of par-
ticipants indicated previous experienc e with using a
computer, but less than half (47%) reported ever having
used the Internet. The first nine participants (47%)
tested the RAQ using a stylus pen as the pilot input
device. Subsequent patients were alternated between the
mouse/keyboard or touch screen. After two alternations
Table 1 Characteristics of physicians who tested the
usability of the Best Practice Recommendation Prompt
(BestPROMPT) (N = 11)
Characteristic N
(%)
Gender
Men 5
(45)
Women 6
(55)
Age range (years)
25 to 35 3
(27)
36 to 45 3
(18)
46 to 55 5
(46)
56 to 65 1 (9)
>65 0
Type of physician
Family 9
(82)
General internal medicine 2
(18)
Years in practice
<5 2
(18)
5to10 2
(18)
11 to 15 2
(18)
16 to 25 4
(36)
> 25 1 (9)
Type of patient record system
Electronic Health Record (EHR) 0
Paper-based 6
(55)
Partial EHR 5
(45)
Functions performed on the EHR: Diagnostic and lab
results (N = 5)
4
(80)
Kastner et al. Implementation Science 2010, 5:96
/>Page 5 of 12
of these devices, participants found the touch screen
considerably easier to use, so t he mouse/keyboard test-
ing was discontinued.
Usability worksheet results
Time to RAQ completion
The mean time to RAQ completion was 6:35 (minutes:
seconds) (SD 5:15) (Table 2). There was no difference
between participants with previous computer use or
Internet experience compared with those with no
experience for time to RAQ completion (mean differ-
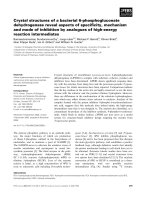
ence range 0:22 to 0:47 seconds). Although the mean
time to RAQ completion decreased by almost four min-
utes from initial testing with a stylus pen to the touch
screen (Figure 1); a o ne-way ANOVA analysis showed
no significant difference between the three input devices
for mean time to RAQ completion (Table 3).
Critical incident analysis
Of 81 inciden ts observed among 19 parti cipants, 42 were
critical and 36 were general incidents (6 general incidents
were elevated to critical status). Navigational problems (i.
e., moving from one RAQ page to the next without assis-
tance) accounted for 60% of the total critical incidents,
and 20% of problems were related to input device (i.e.,
mis-tapping, clicking or touching on the tablet PC screen).
Most critical i ncidents (80%) occurred with the first nine
participants testing the stylus pen (range zero to eight inci-
dents), but decreased from five incidents (participant 10)
to one incident (participants 11 to 13), to no critical inci-
dents observed with the last six participants using the
touch screen (Figure 1). Data analysis identified three
broad categories of themes from the critical incident log
and the semistructured interview of patients:
1.
Participants’ perceptions of the facilitators to using
the RAQ: Fifteen of 19 participants (79%) thought that the
questions were clear and s imple and easy to read, under-
stand, and use overall. Participants liked the audio feed-
back and picture aids because these clarified and helped to
understand the questions. Of those who tested the touch
screen (N = 8), most participants (88%) liked it because it
was familiar, even if they had never used a computer: ‘It
was made easy for me, i t was completely natural because
it’s similar to banking machines, there you’ve got to touch
the screens too, so this reminded me of that’.
2.
Participants’ perceptions of the barriers to using the
RAQ: Several format features impacted use, including
Table 2 Characteristics of patients who tested the usability of the Risk Assessment Questionnaire (RAQ) (N = 19)
Characteristic N
(%)
Mean age
(years)
Mean time to RAQ completion
(minutes:seconds [SD])
Comparison
groups
Mean difference in time to RAQ completion
(minutes [95% CI])
a
All 72 6:35 (5:15)
Gender
Women 10
(53)
74 5:56 (1:24) Women vs.
Men
1.40 (-3.80 to 6.59)
Men 9
(47)
69 7:19 (7:40)
Computer use
Yes 13
(68)
72 6:42 (6:19) Use vs. no
use
0.36 (-5.27 to 5.98)
No 6
(32)
72 6:21 (1:52)
Internet use
Yes 9
(47)
69 7:00 (7:43) Use vs. no
use
0.78 (-4.44 to 6.01)
No 10
(53)
75 6:13 (1:26)
a
Calculated using independent samples t -test.
SD = standard deviation; CI = confidence interval.
Figure 1 The number of inci dents (critical, general, and total)
across participants who tested the Risk Assessment
Questionnaire (RAQ).
Kastner et al. Implementation Science 2010, 5:96
/>Page 6 of 12
the ‘Audio’ button on the Start page, which many found
confusing as it interfered with the successful initiation
of the questionnaire. Navigational problems were also
identified, including the tendency to unintentionally
bypass the second part of two-part questions such as
the Periods and Bone Mineral Density pages.
3.
Participants’ suggestions for improving the RAQ:
Suggestions for additional clarity were provided, includ-
ing creating separate entry fields to distinguish between
surname and first name, pro viding definitions for condi-
tions (e.g., rheumatoid arthritis), and providing more
direction for participants to move from one page to the
next.
Usability study 3
Eight participants (mean age 76 years; 50% men) from
the practice of one family physician participated in this
usability study. Of these, seven participants (88%) were
recruited from the RAQ usability study sample. The
mean time to RAQ completion was 4:31 (minutes:sec-
onds) (SD 1:25), and men completed the RAQ almost
two minutes faster than did women (Table 4).
Usability session worksheet
Data analysis from the semistructured interview identi-
fied two broad categories of themes:
1.
Participants’ perceptions of what they liked about
the COPE sheet overall: Most participants (88%) were
able to understand and describe specific sections. When
asked what they would do with the COPE sheet, all
eight participants indicated that they would discuss the
information with their physician.
2.
Participants’ suggestions for improving the COPE
sheet: Several content and formatting suggestions were
made, including using simpler language (e.g., to modify
‘Your responses to the questionnaire’ to ‘This is your
answer’) and improving the layout so that the table in
the COPE sheet extended all the way to the bottom.
The COPE sh eet was iteratively changed reflecting these
sugg estio ns after the first four participants and after the
last participant.
Discussion
The three components of the osteoporosis tool were
evaluated in individual usability studies to determine
how well the prototype met end users’ needs, functional
goals (features, format, content, navigation), and out-
come impact goals (e.g., the use of the tool at the point
of care). Of the three components of the osteoporosis
tool that were tested, the RAQ required the most cycles
of iteration to meet the needs of patients at risk for
osteoporosis, which may be attributed to several factors.
First, the format of the RAQ is complex because it is
computer-based and interactive, while the other compo-
nents are paper-based. Since the RAQ is computer-
based, it can also support a system for adapting to
Table 3 Characteristics of patients who tested the usability of the Risk Assessment Questionnaire (RAQ) according to
three different input devices (N = 19)
Input device N
(%)
Mean age
(years)
Mean time to RAQ completion
(minutes:seconds [SD])
Comparison
groups
Average difference in time between input
devices (minutes) (b [CIs])
a
Stylus pen 9
(47)
73 8:27 (7:10) –
Mouse/
Keyboard
2
(11)
64 6:29 (2:36) Stylus vs. mouse/
keyboard
-1.97 (-10.58 to 6.63)
Touch
screen
8
(42)
73 4:31 (1:21) Stylus vs. touch
screen
-3.93 (-9.28 to 1.42)
a
Calculated using analysis of variance (ANOVA).
*SD = standard deviation; CI = confidence interval.
Table 4 Characteristics of patients who tested the usability of the Customised Osteoporosis Education (COPE) tool
(N = 8)
Characteristic N
(%)
Mean age
(years)
Mean time to RAQ completion
(minutes:seconds [SD])
Comparison
groups
Mean difference in time to RAQ completion
(minutes:seconds [SE])
p
value
All 76 4:31 (1:25)
Gender
Women 4
(50)
79 5:27 (0:29) Women vs.
men
1:52 (0:46) 0.05
a
Men 4
(50)
72 3:35 (0:26)
a
Significant (calculated using independent samples t-test).
RAQ = risk assessment questionnaire; SD = standard deviation; SE = standard error.
Kastner et al. Implementation Science 2010, 5:96
/>Page 7 of 12
evolving evidence about osteoporosis disease manage-
ment. For example, the decision algorithm of the RAQ
was originally programmed according to the 2002 osteo-
porosis guidelines [9] but can be easily updated to
reflect changing guidelines. Second, the ma jority of peo-
ple that would be targeted to use the RAQ are older
(age ≥65 years). This is a population that tends to have
less experience with computerised syste ms and may
have motor or cognitive impairments or visual deficien-
cies that may require more attenti on to interface design
(e.g., font and tab size and colour), content (e.g., wording
and amount of information), and ease of navigability.
The think-aloud approach enabled the observation of
end users as they carried out relevant tasks while inter-
acting with individual tool components. This process
was very helpful for identifying specific problems and to
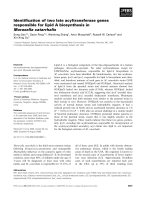
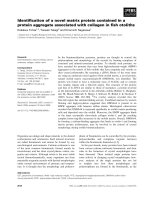
iteratively modify the system accordingly. The transfor-
mations of the tool from pre- to post-usability prototype
are shown in Figure 2 (selected screenshots of the
RAQ), Figure 3 (screenshot of the BestPROMPT sheet),
and Figure 4 (screenshot of the COPE sheet), and a
demonstration of the tool can be accessed at http://
knowledgetranslation.ca/osteo_final/.
Several challenges to point-of-care use of CDSSs in
family practice emerged from the findings of the usabil-
ity studies. It is not surprising that physicians indicated
lack of time or resources to use the osteoporosis tool as
a major barrier to point-of-care use, as this has been
identified in other studies investigating CDSSs [20,21].
However, an unexpected barrier also emerged–the
osteoporosis tool might unintentionally disrupt the real
reason for the visit. Although evidence indicates that
providing CDSSs at the point of care may improve clini-
cal practice [21], there are challenges to designing such
tools for family practice settings b ecause the physician-
patient encounter can be disrupted. Although we
achieved the goal of designing a quick and easy tool
(i.e., the last eight patients completed the RAQ in a
mean 4:31 minutes and the last six initiated the ques-
tionnaire without assistance), physicians suggested that
the provision of osteoporosis information at the point of
care could interfere with their usual practice in other
ways. First, the practice visit agenda may be disrupted
because the experience of working through the RAQ
may prompt patients to ask questions about osteoporo-
sis during the visit. Second, the introduction of either
the BestPROMPT or COPE sheets can facilitate the
transmission of osteoporosis knowledge between provi-
der and patient, but this has to be weighed carefully
against the cost of interrupting or halting the discussio n
of more urgent aspects of the patient’s intended visit
agenda (e.g., chest pain) or health status (e.g., diabetes).
This finding should be an important consideration when
designing point-of-care tools and highlights the need for
a flexible and pragmatic approach when planning how
such tools should be implemented and used in family
practice. Interventions that are adapted to their local
settings and are tailored to the specific needs of physi-
cians should be considered for systems to better fit the
real practice workflow [24-26,39]. It might also be useful
to provide physicians with a choice to either act on or
defer the use of point-of-care information, depending on
the context of the patient visit. Physicians are more
likely to adopt CDSSs if they have some control over
the way it is used, without giving up complete autonomy
of their clinical decision-making [26,40]. In the case of
the osteoporosis tool, this would enable physicians to
use information about osteoporosis at their discretion
without having to compromise the well-being of their
patients or care agenda.
Limitations
There are a number of limitations to the usability stu-
dies. First, although we exceeded our target sample
sizes, it is possible that the inclusion of more partici-
pants may have uncovered more information or pro-
blems or have shown significant differences between
comparison groups for time to RAQ completion. Sec-
ond, we recruited all 19 patients from the patien t popu-
lation of one family physician, and more than half of
physicians were recruited from the same inner-city cen-
ter family practice unit, which may not be representative
of other family physicians and their patients or settings.
However, given the demographics of the participants,
they appear similar to other patients with osteoporosis.
Third, we excluded the System Usability Scale question-
naire from patient usability testing, so it was not possi-
ble to calculate an overall usability score for either the
RAQ or COPE components of the tool. We wanted to
optimise the balance between getting feedback about the
usability of these tool components without exhausting
the mostly elderly participants. Additionally, the recruit-
ment process restricted the opportunity to extend ses-
sions to include the System Usability Scale since most
patients were recruited immediately after their family
physician appointment, when many patients were too
tired, weak, or ill to participate in a study lasting more
than 30 minutes. Lastly, control for selection bias was
difficult because patients who tested the RAQ and
COPE sheet were selected from the same practice set-
ting (i.e., the St. Michael’s Hospital Family Practice
Unit). However, their inclusion was also useful because
they were able to see two components of the tool.
Conclusions
Results from the three usability studies were used to make
informed modifications and refinements to the osteoporo-
sis tool prototype. Major challenges to point-of-care use of
Kastner et al. Implementation Science 2010, 5:96
/>Page 8 of 12
the tool were physicians’ lack of time and that the tool
might unintentionally disrupt the real reason for the visit.
These challenges indicate that implementation of such
too ls in family pract ice requires a flexible and pragmatic
approach. The findings also confirm the importance of
usability testing of interactive clinical decision support
applications and information systems on all end users to
reduce problems and errors, particularly if the future goal
is to implement such systems in a clinical practice setting.
The findings of the usability studies also highlight the
Figure 2 Screen shots depicting the evolution of selected RAQ questions.
Kastner et al. Implementation Science 2010, 5:96
/>Page 9 of 12
Figure 3 Screen shots depicting the evolution of the BestPROMPT sheet for physicians.
Figure 4 Screen shots depicting the evolution of the COPE sheet for patients.
Kastner et al. Implementation Science 2010, 5:96
/>Page 10 of 12
need to include usability e valuation as an important step
in the development process of knowledge translation
interventions.
Author details
1
Department of Health Policy, Management and Evaluation, Faculty of
Medicine, University of Toronto, Toronto, Ontario, Canada.
2
Department of
Mechanical and Industrial Engineering, University of Toronto, Toronto,
Ontario, Canada.
3
Li Ka Shing Knowledge Institute of St. Michae l’s Hospital,
Toronto, Ontario, Canada.
Authors’ contributions
All authors participated in the design of the study. MK and CM conducted
the usability testing sessions. MK, CM, and SES performed the analysis. MK
drafted the manuscript, and all authors read and approved the final
manuscript.
Competing interests
The authors declare that they have no competing interests.
Received: 4 June 2010 Accepted: 10 December 2010
Published: 10 December 2010
References
1. Gullberg B, Johnell O, Kanis JA: World-wide projections for hip fracture.
Osteoporosis Int 1997, 7 :407-13.
2. Osteoporosis Canada. [ />Accessed in December, 2010.
3. Goeree R, O’Brien B, Pettitt D, Cuddy L, Ferraz M, Adachi JD: An assessment
of the burden of illness due to osteoporosis in Canada. J Soc Obstet
Gynaecol Can 1996, 18(Suppl (July)):15-24.
4. Cummings SR, Melton LJ: Epidemiology and outcomes of osteoporotic
fractures. Lancet 2002, 359:1761-7.
5. Poole KES, Compston JE: Clinical review: Osteoporosis and its
management. BMJ 2006, 333:1251-6.
6. International Osteoporosis Foundation. [ />facts-and-statistics.html], Accessed in April, 2010.
7. Osteoporosis prevention, diagnosis and therapy. NIH consensus
statements. 2000, 17(1) :1-45[ />2000Osteoporosis111html.htm], Accessed in December, 2010.
8. Lips P, van Schoor NM: Quality of life in patients with osteoporosis.
Osteoporosis Int 2005, 16:447-455.
9. Brown JP, Josse RG, for the Scientific Advisory Council of the Osteoporosis
Society of Canada: 2002 clinical practice guidelines for the diagnosis and
management of osteoporosis in Canada (revised, August 26, 2004).
CMAJ 2002, 167(10):S1-S34.
10. The Society of Obstetrics and Gynecology: Canadian Consensus
Conference on Osteoporosis, 2006 Update. [ />guidelines/index_e.asp], Accessed in April 2010.
11. Canadian Task Force on Preventive Health Care: Prevention of
Osteoporosis and Osteoporotic Fractures in Postmenopausal Women.
[], Accessed in May 2010.
12. ACOG Committee on Practice Bulletins. ACOG Practice Bulletin. Clinical
Management Guidelines for Obstetrician-Gynecologists. Number 50,
January 2004. Osteoporosis Obstet Gynecol 2004, 103(1):203-16.
13. Osteoporosis, Clinical Guidelines for Prevention and Treatment: Update
on pharmacological interventions and algorithm for management. Royal
College of Physicians, Bone and Tooth Society of Great Britain; 2003 [http://
www.rcplondon.ac.uk], Accessed in April, 2010.
14. Cranney A, Papaioannou A, Zytaruk N, Hanley D, Adachi J, for the Clinical
Guidelines Committee of Osteoporosis Canada, et al: Parathyroid hormone
for the treatment of osteoporosis: a systematic review. CMAJ 2006,
175(1):52-59.
15. Jaglal SB, McIsaac WJ, Hawker G, Carroll J, Jaakkimainen L, et al: Information
needs in the management of osteoporosis in family practice: an
illustration of the failure of the current guideline implementation
process. Osteoporosis Int 2003, 14:672-6.
16. Papaioannou A, Giangregorio L, Kvern B, Boulos P, Ioannidis G, Adachi JD:
The osteoporosis care gap in Canada. BMC Musculoskelet Disord
2004,
6:5-11.
17. Cheng N, Green ME: Osteoporosis screening for men: Are family
physicians following guidelines? Can Fam Phys 2008, 54:1140-1, e1-5.
18. Kastner M, Straus SE: Clinical decision support tools for osteoporosis
disease management: A systematic review of randomized controlled
trials. JGIM 2008, 23(12):2095-2105.
19. Kastner M, Li J, Lottridge D, Marquez C, Newton D, Straus SE: Development
of a Prototype Clinical Decision Support Tool for Osteoporosis Disease
Management: A Qualitative Study of Focus Groups. BMC Med Inform Dec
Mak 2010, 10:40.
20. Garg AX, Adhikari NKJ, McDonald H, Devereaux PJ, Beyene J, Sam J,
Haynes RB: Effects of Computerized Clinical Decision Support Systems on
Practitioner Performance and Patient Outcomes: A Systematic Review.
JAMA 2005, 293:1223-38.
21. Kawamoto K, Houlihan CA, Balas EA, Lobach DF: Improving clinical
practice using clinical decision support systems: a systematic review of
trials to identify features critical to success. BMJ 2005, 330:765-73.
22. Graham TAD, Kushniruk AW, Bullard MJ, et al: How usability of a web-
based clinical decision support system has the potential to contribute to
adverse medical events. AMIA Ann Symp Proc 2008, 257-61.
23. Kushniruk AW, Triola MM, Borycki EM, et al: Technology induced error and
usability: the relationship between usability problems and prescription
errors when using handheld application. Int J Med Inform 2005, 74(7-
8):519-526.
24. Ash JS, Berg M, Coiera E: Some unintended consequences of information
technology in health care: the nature of patient care information
system-related errors. JAMIA 2004, 11:104-112.
25. Trivedi MH, Daly EJ, Kern JK, et al: Barriers to implementation of a
computerized decision support system for depression: an observational
report on lessons learned in “real world” clinical settings. BMC Med
Inform and Dec Mak 2009, 9:6.
26. Varonen H, Korteeisto T, Kaia M, for the EBMeDs Study Group: What may
help or hinder the implementation of computerized decision support
systems (CDSSs): a focus group study with physicians. Family Practice
2008, 25:162-167.
27. Eccles M, Ssteen N, et al: Effect of computerised evidence based
guidelines on management of asthma and angina in adults in primary
care: cluster randomised controlled trial. BMJ 2002, 325:1-7.
28. Kushniruk AW, Patel VL: Cognitive and usability engineering methods for
the evaluation of clinical information systems. J Biomed Inform 2004,
37(1):56-76.
29. Ericsson K, Simon H: Protocol analysis: verbal reports of data Cambridge, MA:
Academic Press; 1993.
30. Nielsen J: Usability engineering New York: Academic Press; 1993.
31. Kushniruk A: Evaluation in the design of health information systems:
application of approaches emerging from usability engineering.
Computers in Biol and Med 2002, 32:141-149.
32. Dumas JS: In User-based Evaluations. Edited by: Jacko JA, Sears A. The
Human-Computer Interaction Handbook, Lawrence Earlbaum Associates,
Mahwah, New Jersey; 2003:1093-1117.
33. Daniels J, Fels S, Kushniruk AW, et al: A framework for evaluating usability
of clinical monitoring technology. J Clin Mon Comp 2007, 21:323-330.
34. Vizri RA: Refining the test phase of usability evaluation: how many
subjects is enough? Human Factors 1992, 34:457-68.
35. Brooke J: In SUS: A “ quick and dirty” usability scale. Edited by: Jordan PW,
Thomas B, Werdmeester BA, McClelland AL. Usability Evaluation in Industry.
London: Taylor and Francis; 1996:.
36. Flanagan JC: The Critical Incident Technique. Psychological Bulletin 1954,
51(4):327-359.
37. Strauss A, Corbin J: Basics of qualitative research: Techniques and procedures
for developing grounded theory. 2 edition. Thousand Oaks, CA: Sage; 1998.
38. Patton MQ: Qualitative Research and Evaluation Methods. 3 edition.
California: Sage Publications Inc; 2002.
39. Craig P, Dieppe P, Macintyre S, et al: Developing and evaluating complex
interventions: the new Medical Research Council guidance. BMJ 2008,
337:979-983.
Kastner et al. Implementation Science 2010, 5:96
/>Page 11 of 12
40. Toth-Pal E, Wardh I, Strender LE, Nilsson G: Implementing a clinical
decision-support system in practice: A qualitative analysis of influencing
attitudes and characteristics among general practitioners. Informatics for
Health & Social Care 2008, 33(1):39-54.
doi:10.1186/1748-5908-5-96
Cite this article as: Kastner et al.: Usability evaluation of a clinical
decision support tool for osteoporosis disease management.
Implementation Science 2010 5:96.
Submit your next manuscript to BioMed Central
and take full advantage of:
• Convenient online submission
• Thorough peer review
• No space constraints or color figure charges
• Immediate publication on acceptance
• Inclusion in PubMed, CAS, Scopus and Google Scholar
• Research which is freely available for redistribution
Submit your manuscript at
www.biomedcentral.com/submit
Kastner et al. Implementation Science 2010, 5:96
/>Page 12 of 12


![Tài liệu Báo cáo khoa học: Specific targeting of a DNA-alkylating reagent to mitochondria Synthesis and characterization of [4-((11aS)-7-methoxy-1,2,3,11a-tetrahydro-5H-pyrrolo[2,1-c][1,4]benzodiazepin-5-on-8-oxy)butyl]-triphenylphosphonium iodide doc](https://media.store123doc.com/images/document/14/br/vp/medium_vpv1392870032.jpg)