báo cáo khoa học: "Feedback GAP: study protocol for a clusterrandomized trial of goal setting and action plans to increase the effectiveness of audit and feedback interventions in primary care" pdf
Bạn đang xem bản rút gọn của tài liệu. Xem và tải ngay bản đầy đủ của tài liệu tại đây (460.73 KB, 10 trang )
STUDY PROTO C O L Open Access
Feedback GAP: study protocol for a cluster-
randomized trial of goal setting and action
plans to increase the effectiveness of audit
and feedback interventions in primary care
Noah M Ivers
1,2,3,4*
, Karen Tu
2,4,5
, Jill Francis
6
, Jan Barnsley
3
, Baiju Shah
2,3,7
, Ross Upshur
2,4,7,8
, Alex Kiss
2,3
,
Jeremy M Grimshaw
9
, Merrick Zwarenstein
2,7
Abstract
Background: Audit and feedback to physicians is commonly used alone or as part of multifaceted interventions.
While it can play an important role in quality improvement, the optimal design of audit and feedback is unknown.
This study explores how feedback can be improved to increase acceptability and usability in primary care. The trial
seeks to determine whether a the ory-informed worksheet appended to feedback reports can help family physicians
improve quality of care for their patients with diabetes and/or ischemic heart disease.
Methods: Two-arm cluster trial was cond ucted with participating primary care practices allocated using
minimization to simple feedback or enhanced feedback group. The simple feedback group receives performance
feedback reports every six months for two years regarding the prop ortion of their patients with diabetes and/or
ischemic heart disease who are meeting quality targets. The enhanced feedback group receives these same reports
as well as a theory-informed worksheet designed to facilitate goal setting and action plan development in
response to the feedback reports. Participants are family physicians from across Ontario who use electronic medical
records; data for rostered patients are used to produce the feedback reports and for analysis.
Outcomes: The primary disease outcomes are the blood pressure (BP), and low-density lipoprotein cholesterol
(LDL) levels. The primary process measure is a composite score indicating the number of recommended activities
(e.g., tests and prescriptions) conducted by the family physicians for their patients with diabetes and/or ischemic
heart disease within the appropriate timeframe. Secondary outcomes are the proportion of patients whose results
meet targets for glucose, LDL, and BP as well as the percent of patients receiving relevant prescriptions. A
qualitative process evaluation using semi-structured interviews will explore perceived barriers to behaviour change
in response to feedback reports and preferences with regard to feedback design.
Analysis: Intention-to-treat approach will be used to analyze the trial. Analysis will be performed on patient-level
variables using generalized estimating equation models to adjust for covariates and account for the clustered
nature of the data. The trial is powered to show small, but clinically important differences of 7 mmHG in systolic
BP and 0.32 mmol/L in LDL.
Trial Registration: ClinicalTrials.gov NCT00996645
* Correspondence:
1
Women’s College Hospital Family Health Team, 76 Grenville Street, Toron to
ON, M5 S 1B2, Canada
Full list of author information is available at the end of the article
Ivers et al . Implementation Science 2010, 5:98
/>Implementation
Science
© 2010 Ivers et al; licensee BioMed Central Ltd. This is an Open Access a rticle distributed under the terms of the Creat ive Commons
Attribution License ( whi ch permits unrestricted use, distribution, and reproduction in
any medium, provided the original work is pro perly cited.
Background
Patients with diabetes or ischemic heart disease (IHD)
are at elev ated risk of cardiovascular events, especially if
they have a history of both conditions [1]. Research
findings regarding quality indicators in diabetes and
IHD suggest agreement and acceptance of guidelines
amongst Canadian family practitioners, who manage the
bulk of care for these patients [2]. Unfo rtunately, there
remains a large gap between ideal and actual care pro-
vided to such patients, making them a common focus
for translational research [3]. Diabetes and IHD are con-
sidered particularly good targets for quality improve-
ment strategies such as audit and feedback which can
increase adoption and adherence to guidelines [4,5].
Audit and feedback has been defined as a ‘summary of
performance in a specific area with or without recom-
mendations for action’ [6] and is felt to be effective
because it may overcome physicians’ limited ability to
accurately self-assess [7]. Thus, audit and feedback
focuses o n addressing the gap between ideal and actual
care that is within the control of the health care provi-
der and is often the foundation of multifaceted quality
improvement interventions.
The Cochrane review of audit and feedback [8] con-
cluded that it is effective, but the authors noted great
variability in the design and the effectiveness of feedbac k
interventions. That meta-analysis included 118 trials, find-
ing a median increase in compliance with guidelines of 5%
for dichotomous outcomes (inter-quartile range 3% to
11%) and 16% for continuous outcomes (inter-quartile
range 5% to 37%), but great heterogeneity in both inter-
vention design and reporting limited conclusions regard-
ing how to best implement audit and feedback. Therefore,
the important question to ask at this point is not whether
feedback is effective, but how feedback can be most effec-
tive. Optimal design and delivery of feedback should more
consistently lead to improved results, but few studies have
tested different designs of feedback [9]. In an attempt to
further delineate how to most effectively d esign and deliv er
feedback interventions, Hysong completed a re-analysis of
the Cochrane review [10], finding that feedback h ad greater
effectiveness with increasing frequency, with written rather
than verbal or graphical delivery, and with feedback that
included ‘correct solution information.’ Most recently,
Gardner et al. conducted a reanalysis of the Cochrane
review to test target-setting and action plans as effec t-
modifiers of feedback [11], but very few studies explicitly
described their use of targets and/or action plans, making
their r eport inconclusive.
Using theory to design an enhanced feedback
intervention
Briefly, performance feedback may be understood to work
by directing attention toward a discrepancy between an
expected or desired state and reality [12]. When present,
this discrepancy may encourage the recipient to generate
increased effort toward the goal, especially if the next
steps or sub-goals are clear. Alternatively, the feedback
may be perceived as inaccurate and disregarded, or the
feedback may result in the recipient lowering their goal to
mak e it more achievable [13]. To be effective, the ideally
designed feedback would consistently lead to changes in
behaviour by the recipient through increased efforts to
reach appropriate goals.
There are both theoretical and empirical reasons to
believe that feedback will be more effecti ve if the recipi-
ents set goals [14] and develop action plans [15].
According to Goa l-Setting Theory [16], those who are
dissatisfied with their performance will develop a change
in behaviour if they are committed to the goal and if
they meet a threshold level of self-efficacy for that task.
Banduraexplainsthatpeoplearemorelikelytotryto
accomplish a goal if they believe their efforts will be
successful [17].
Psychologists have repeatedly shown that detailed
plans regarding where/when/how behaviours will be
enacted increases the likelihood of task accomplishment
[18]. In the context of feedback and goals, these plans
may increase goal-directed behaviours by increasing
self-efficacy. Action plans can also facilitate success by
increasing goal-commitment to overcome barriers such
as distraction or fatigue; implementation plans in parti-
cular seem to increase goal-directed behaviours [19].
Implementation intentions are developed through if/
then statements, wherein the participant must connect a
situation (if) with a behavioural response (then). With
some effort (i.e., considering and writ ing down the
plan), the connection made between contextual cues
and an action plan can become automatic, thereby
increasing goal attainment without conscious intent.
Ther e is some empirical evidence that intensive inter-
ventions that help participants set practice improvement
plans in response to feedback can improve outcomes
[20], possibly by increasing goal commitment and self-
efficacy. Recognizing that feedback alone is sometimes
not enough to change provider behaviours, further
improvements have been found by pairing feedback with
more intensive (and expensive) co-interventions, such as
educational outreach visits [21]. Although these inten-
sive interventions are rarely explicitly informed by the-
ory [22], they presumably work because they help
participants to take action to improve outcomes for
patients. The assumption is that healthcare providers
intend to provide consistently high quality o f care, but
are uncertain how t o change their behaviours to accom-
plish this feat. Therefore, an intervention aiming to
close this intention-behaviour-gap could be very effec-
tive. In this study, it is expected that the feedback
Ivers et al . Implementation Science 2010, 5:98
/>Page 2 of 10
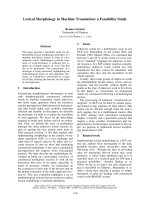
repo rts will draw family physicians’ attention to a discre-
pancy between actual and ideal care – e.g ., fewer patients
than expected are at target blood pressure (BP) – and
that a theoretically-informed worksheet can be developed
to facilitate goal-setting and action-plans to enhance the
likelihood that they will take action to close this gap (e.g.,
implement systems to monitor at-risk patients with BP
above target). See Figure 1 for an illustration of potential
role of goal-setting and action plans on effectiveness of
feedback.
Study objectives and hypotheses
For family physicians receiving performance feedback
reporting the percentage of their patients with diabetes
and /or IHD who are achieving quality targets, the addi-
tion of a theory-informed worksheet designed to facili-
tate goal setting and the developme nt of action plans
will lead to changes in behaviour and improved out-
comes. A second hypothesis is that those physicians in
the intervention group who properly complete the work-
sheet will have the largest improvement in outcomes.
Finally, we aim to explore qualitatively the perceived
barriers to behaviour change in response to feedback
reports and the preferences of family physicians with
regard to feedback design.
Methods
Study design
This is a mixed methods study built around a pragmatic,
cluster-trial with two arms; one group will receive ‘sim-
ple’ feedback, while the other will receive ‘enhanced’
feedback. Allocation is at the practice level to reduce
risk of contamination and the intervention directed at
the physician level. In Ontario, family physicians do
work in groups, but this generally involves sharing
administrative resources, not patients. The usual
approach is fo r chronic conditions to be dealt with by
the personal p hysician, while acute issues may be dealt
withbytheavailablephysician.Therefore,webelieve
that an intervention aimed at the physicia n rather than
the entire clinic is appropriate. The analysis will be at
the patient level, including both disease-level outcomes
of BP and low-density lipoprotein cholesterol (LDL) and
a composite score of process variables, as detailed in the
‘outcomes’ section.
The lack of a control group receiving no feedback at
all is both necessary (because participants expected
something in return for contributing data) and prag-
matic (because most quality improvement interventions
include some degree of feedback, making this the ‘usual
care’ comparator) [23]. In particular, the Ministry of
Health and Long-Term Care in Ontario (MOHLTC) is
providing feedback reports to all f amily physicians as
part of its diabetes strategy [24].
This study has received approval from the Research
Ethics Office at Sunnybrook Health Sciences Centre
(271-2006) and is registered with ClinicalTrials.gov
(NCT00996645).
Participants and data collection
Through t he Electronic Medical Record Admin istrative
data Linked Database (EMRALD), family physicians
from all regions of Ontario who have been using Prac-
tice Solutions® Electronic Medical Records (EMRs) for at
least 12 months have signed a data-sharing agreement
with the Institute for Clinical Evaluative Sciences (ICES)
where EMRALD is held. ICES is a prescribed entity,
under the province of Ontario’s Personal Health Infor-
mation Protection Act, which allows for the collection
of individual level health information for use in planning
and managing the healthcare system.
At ICES, mechanisms to extract , securely transfer, and
de-identify the EMR data have been established [25]. For
patient visits, consultations, investigations, and treat-
ments, data in EMRALD compare well with (and often
out-perform) administrative databases [unpublished
data]. Furthermore, alg orithms to identify patients in the
EMRALD database with diabetes (sensitivity 83.1%, spe-
cificity 98.2%) [26] and IHD (sensitivity 72.4%, specificity
99.6%) [27] have been validated. Since publishing those
papers, we have made further improvement to the dia-
betes algorithm (by considering the ‘problem list’ and
‘past medical history’ fields in addition to the lab tests
and prescriptions) resulting in a sensitivity of 90.9% and
specificity of 99.2%. The algorithm for identification of
the IHD algorithm has also been improved by continuing
to refine the search terms used to identify patients in t he
‘problem-list’ and ‘past medical history ’ fields. The algo-
rithms developed for EMRALD do not require any spe-
cial coding or data input by the participating physicians.
Family physicians were originally invited to participate
in EMRALD through convenience sampling of EMR
!
!
""
!
#
Figure 1 Illustration of hypothesized role played by goal-
setting and action-plan worksheet to promote increased effort
to improve care.
Ivers et al . Implementation Science 2010, 5:98
/>Page 3 of 10
users. Presently, all participants work in multi-provider
clinics and nearly all have access to allied healthcare
providers. As a result, participants are not necessarily
representative of all O ntario family physicians or of all
primary care EMR users. However, this concern is par-
tially mitigated by the varied characteristics of physi-
cians in the sample (Table 1). As EMRALD continues to
recruit new family physicians, the diversity of the sample
is expected to g row. The number of participating physi-
cians and practices in EMRALD may grow by as much
as 50% during the first six months of this trial.
For the present study, all EMRALD participants were
sent consent forms and invitations to participate. Mini-
mal eligibility criteria are applied. Physicians with less
than one year of experience with EMR or with less than
100 rostered, active adult patients will be excluded,
because these ‘new’ physicians would not have adequate
data to assess some of the quality indicators. To be con-
sidered active, and to ensure there is a history with the
physician, patients must have at least one visit between
12 and 36 months prior to the data upload date. The
EMR data for all remaining phy sicians are assesse d to
ensure completeness with respect to electronic capture
of lab tests and prescriptions. Finally, because ICES does
not permit reporting of cells smaller than five (to ensure
confidentiality), the data fo r the remaining physicians
are assessed to ensure that each has more than five
patients with diabetes and more than five with IHD.
Setting
The Ontario Health Insurance Program pays for doctor
visits and laboratory tests, but covers medications o nly
for the elderly or those on social assistance. Over one-
half of the primary care providers in Ontario have
eschewed the old model of fee-for-service and joined
primary care reform models where capitation plays a
large role in compensation for patient care. To earn the
capitation fees, physicians and patients must co-sign an
agreement that officially adds the patient to the physi-
cian’s roster; through this process, patients are encour-
aged to seek care primarily with their own provider or
clinic. Only data from ‘rostered’ patients are included in
the trial.
All the physician participants in this project roster
their patients and most also benefit from the newest pri-
mary care reform process that provides funds to hire
allied healthcare providers to work in the clinic.
Although less than half of Ontario family physicians use
EMR, Practice Solutions® EMR has 45% of the Ontario
EMR market [28].
Intervention
The intervention has been developed through an itera-
tive process. The materials for dissemination were
designed after a review of the literature and consultation
with experts from continuing medical education, health
psychology, and knowledge translation.
Participants in both arms of t he trial will each receive
an information packag e by courier every six months for
two years with multiple components, including a one-
page cover letter, a one-page explanation of how the
patient information was identified from EMRALD, a
one-page handout reviewing generic clinical and quality
improvement strategies for patient s with diabetes and/or
IHD (based in part on the chronic care model [29]), and
two separate feedback reports. The first report will
describe the percentage of the participating physician’s
patients with diabetes who are meeting evidence-based
Table 1 Characteristics of initial 14 clinics and 54 family physicians in the trial
Clinic Characteristics (N = 14) Physician Characteristics (N = 54)
Roster size, median (IQR) Sex, n (%)
Total patients
(total N = 46,864)
2,759 (1,915 to 4,250) Male 30 (55.6%)
IHD or diabetes
(total N = 4,593)
263 (219 to 505)
Years in Practice, n (%)
Location, n (%) Less than or equal to 10 17 (31.5%)
Rural 7 (50.0%) 11 to 20 12 (22.2%)
More than 20 25 (46.3%)
Physicians per clinic, n (%)
1 to 2 5 (35.7%) Years using EMR, n (%)
3 to 5 4 (28.6%) Less than 3 5 (9.3%)
6 to 11 5 (35.7%) 3 to 6 45 (83.3%)
More than 6 4 (7.4%)
N, n = number, IHD = ischemic heart disease, EMR = electronic medical record.
Ivers et al . Implementation Science 2010, 5:98
/>Page 4 of 10
quality targets. The second will present similar informa-
tion regard ing their patients with IHD. The quality tar-
gets used were chosen to be consistent with those used
by concurrent quality improvement interventions in
Ontario (Quality Improvement and Innovation Partner-
ship) [30] and with current guidelines (see Outcomes
section below). The reports will present information
comparing the performance achieved by the participat-
ing physi cian to the average achieved by the top 10% of
participants for any given measure. This type of com-
parator is similar to the achievable benchmark of care
previously shown to improve the effectiveness of feed-
back reports [31]. See Additional File 1 for prototype
feedback reports.
Participants randomized to the enhanced feedback arm
will receive exactly the same materials as the simple feed-
back arm, plus a one-page worksheet. This theory-
informed worksheet is designed to facilitate participants
in setting specific but challenging goals and help partici-
pants develop action-plans through the creation of imple-
mentation intentions (see Additional File 2 for prototype
of worksheet). An evaluation to assess the theoretical
validity of the intervention will be reported separately.
Based on our review of the literature, the largest
effects from goal setting and action planning seem to
come from actually developing the plan (and linking it
to a specific context to carry it out). For this reason, we
chose not to provide participants w ith a list of possible
actions. The participants, not the investigators, decide
how to improve upon a care gap that they identify as
important. Important mediators of the success of imp le-
mentation intentions seem to be participant adherence
to instructions to develop an appropriate plan, partici-
pant self-efficacy, and the inclusion of ‘coping plans’ to
help participants plan ahead for situations that could
interrupt goal-oriented behaviours [32,33]. These factors
will be addressed explicitly in this trial by: offering six
‘Main-Pro-C’ [34] continuing medical education credits
to encourage full completion of the worksheet and to
permit monitoring of plans by the investigators; allowing
participants to set their own goals for improvement; and
requiring participants to develop a coping plan in the
intervention workshe et. The form at in this aspect of the
worksheet is similar to previous studies [33], although
to our knowledge the application of this type of inter-
vention to family physicians is novel.
The worksheet in this intervention is similar in con-
cept to commitment-to-change procedures that are
increasingly used in the continuing medical education
field, based on multiple theories related to adult learning
[35]. Rigorous evaluations of such procedures are few,
but one study indicated that commitment-to-change can
mediate the effect of an educational intervention for
prescriptions [36]. Although a signature has not been
proven to increase the effectiveness of the commitment-
to-change procedure [37], it is included in the work-
sheet because it offers an o pportunity to explicitly use
the word ‘commitment;’ this is thought to be a neces-
sary feature for the procedure to successfully generate
behav iour change (see Additional File 2 for prototype of
worksheet) [38]. We tested the worksheet design and
all other intervention materials with a group of non-
part icipating family physicians and they found it easy to
use. Specifically, they reported that they found the
instructions clear and advised no changes to the design.
To our knowledge, the applicat ion of this type of w ork-
sheet as a means of ‘enhanc ing’ the effectiveness of
audit and feedback is novel.
Allocation and blinding
Given the small number of practices (clusters) involved
in EMRALD, simple randomization cannot be expected
to generate two similar arms for this trial. Instead, mini-
mization was used to achieve balance at baseline across
the three primary outcomes and the number of patient s
in each cluster who have diabetes and/or IHD. Using
the baseline da ta for ea ch cluster, these variables were
classified as high or low using the median value as the
cut-point. This was conducted with the free software,
‘MINIM’ [39]. Enrolment will continue for a maximum
of six months; new practices will be minimized using
their baseline data.
Although minimization has been criticised for increas-
ing the risk for selection bias [40], the benefits of
achieving balance at baseline through the use of minimi-
zation outweighs the minor risks involved (especially for
small trials) and therefore has been widely recom-
mended [41,42]. We believe that risk of selecti on bias is
low in this case because the recruitment of the first
fourteen practices (clusters) was completed prior to allo-
cation of the practices using the minimization software.
Furthermore, allocation of practices will remain con-
cealed; study IDs will be used to ensure that the audit
process and statistical analysi s will be blinded with
regard to group assignment. A research coordinator
who is otherwise unaffiliated with the study will use a
master list with study IDs and participant names to pre-
pare the intervention materials. Participants will not be
told explicitly which arm they are in; those in the
enhanced feedback group will not be aware that the
worksheet is the essential aspect of the intervention.
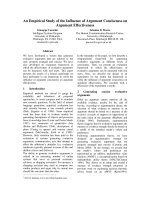
Timeline
The first reports were sent out in August 2010. Every
six months, practices will send new data uploads to
ICES so that new feedback reports can be produced and
distributed. Final analysis will occur after an audit at
24 months. See Figure 2 for cluster-flow diagram.
Ivers et al . Implementation Science 2010, 5:98
/>Page 5 of 10
Analysis
Outcomes
There will be two disease primary outcomes and one
process primary outcome. The disease primary out-
comes will be the patients’ most recent LDL and systolic
BP values, if they have been tested within 24 or
12 months, respectively. Though these are actually risk
factors, they are the ta rget of ca rdiovascular risk man-
agement, and are therefore appropriate given the brevity
of the trial.
The process primary o utcome is a com posite process
score indicating whether patients with diabetes and/or
IHD are receiving the recomme nded prescriptions and
tests within the appropriate timeframes. These evidence-
based quality indicators are concordant with guidelines
[43-48] and are comparable to composite scores used in
similar studies [47] . All patients with diabe tes and/or
IHD will receive a composite process score with a maxi-
mum of 6. For patients with diabetes, a maximum score
of 6 would indicate testing of urinary microalbumin and
serum LDL within a year, measuring BP and glycosylated
haemoglobin within six months, and having active pre-
scriptions for a statin and an angiotensin-modifying
agent. For patients with IHD, a maximum score of 6
would indicate t esting fasting blood glucose within two
years and LDL within one year, measuring BP within six
months, and having active prescriptions for aspirin, a sta-
tin, and an angiotensin-modifying agent. For patients
with both diabetes and IHD, the maximum raw score will
be 7 (based on the same indicators as diabetes but adding
aspirin), but this will then be multiplied by 6/7 to stan-
dardize to a maximum score of 6, as outlined in Table 2.
Secondary outcomes were chosen because they may be
the targets of action by reci pients of the intervention.
Thus, the secondary outcomes include: the proportion of
patients whose results meet the targets recommended in
guidelines for glucose, LDL, and BP; and the prescriptions
rates for insulin, beta blockers, angiotensin-modifying
agents, aspirin, and statins.
Analysis
Descriptive stati stics will be calculated for all variables of
interest. Continuous measures will be summarized using
means and standard deviations whereas categor ical mea-
sures will be summarized using counts and percentages.
We hypothesize that the enhanced feedback interven-
tion will lead to greater improvem ents in quality of care
for patients with dia betes and/or IHD. T he analysis to
test this hypothesis will be carried out using multilevel
hierarchical modeling (using the generalized estimating
equation approach) to control for the effects of cluster-
ing as well as adjusting for multiple covariates, including
the variables used in the minimization (baseline values
for BP, LDL, the composite process score, and the num-
ber of patients with diabetes and/or IHD). Anal ysis will
be performed on an intention-to-treat basis. No interim
analyses are planned. Prior to analysis, other covariates
will be assessed for the presence of multicollinearity;
when the tolerance statistic val ue < 0.4 only one mem-
ber of a correlated set will be retained for the model.
Primary analyses will be conducted on patient level vari-
ables, combining patients with diabetes and/or IHD.
Sub-group analyses will be performed on patients with
only IHD, only diabetes, or both, to assess the same out-
come variables.
The efficacy of the worksheet intervention will be
assessed as a planned secondary analysis in two ways.
First, we will test whether full completion of the worksheet
resulted in improved outcomes. Full completion of the
Figure 2 Trial Design and Cluster-Patient Flow.
Table 2 Composite process score to be calculated for
each patient as primary process outcome; the score is
calculated differently for patients with diabetes, ischemic
heart disease, or both.
Quality indicator
(for each patient
receives a score)
Diabetes
(max
score = 6)
IHD (max
score = 6)
Both Diabetes + IHD
(multiply by 6/7
for max score = 6)
BP test in 6M X X X
A1C test in 6M X X
FBG test in 24M X
LDL test in 12M X X X
ACR test in 12M X X
Rx ASA X X
Rx Statin X X X
Rx ACE/ARB X X X
IHD = ischemic heart disease, BP = blood pressure, A1C = glycolated
haemoglobin, FBG = fasting blood glucose, LDL = low density lipoprotein
cholesterol, ACR = urinary albumin-to-creatinine ratio, ASA = aspirin, ACE/ARB =
angiotensin-modifying agent.
Ivers et al . Implementation Science 2010, 5:98
/>Page 6 of 10
worksheet will be evaluated according to whether they
declared specific and measurable goals, completed all sec-
tions of the action plan, and confirmed their commitment
with their signature. Second, we will examine if physicians
achieved greater improvements in the specific clinical
topics that they chose to target using the worksheet.
All analyses will be carried out using the SAS Version
9.2 statistical program (SAS Institute, Cary, NC, USA).
Sample size
Based on pilot data, systolic BP is expected have a stan-
dard deviation of 20 mmHg. A clinically important dif-
ference in systolic BP is estimated to be 7 mmHg; this is
a difference often seen with initiation of treatment and
is associated with reduction in cardiovascular risk [49].
To have 80% power to find a difference in systolic BP of
7 mmHg using a two-sided unpaired t-test with a =
0.05 would require 258 total patients. To account for
clustering, this sample size must be multiplied by a var-
iance inflation factor (VIF) = [1 + (n - 1) × ICC] , where
n is the mean cluster sample size and ICC is the intra-
class correlation coefficient, a measure of the de gree of
correlation within clusters [50]. From baseline data, the
mean cluster size (number of patients with diabetes
and/or IHD in each practice) is approximately 328.
Using a presumed ICC of 0.05 (based on ICCs seen in
the literature[51]), the VIF equals 17.4. Thus, 4,489
patients with diabetes and/or IHD are required to find a
difference of 7 mmHg in BP, which equates to 13.7
clusters.
For LDL values, pilot data show a standard deviation
of 0.90. Therefore, using the same calculati ons, the trial
will have power to show an absolute difference in LDL
of 0.32 mmol/L; this difference has been shown to be
associated with reduction in cardiovascular risk [52].
This type of small improvement in the management of
these very common chronic diseases could translate into
a large impact on the population scale.
Based on pilot data, the standard deviation for the
composite process primary outcome is expected to be
1.61. For t his outcome, pilot data were also used to find
that the ICC was 0.0059, but to be conser vative this can
be rounded up to 0.01, giving a VIF of 4.28. Therefore,
to show an absolute difference in the final composite
process score of 0.3 (effect size 0.19), a sample size of
3,878 patients would be needed, which equates to 11.82
clusters.
Most of the power in cluster-trials co mes from t he
number of clusters, rather than the number of patients.
Therefore, dropout of a few participating physicians (or
many of their patients) would only minimally decrease
power. We do not expect dropout of entire clinics; clinic
managers are committed to this project and have facili-
tated the recruitment of individual physicians at each
clinic. However, even with a loss of two of the fourteen
clinics, the same calculations indicate that we would
have 80% power to f ind differences of 8 mmHG BP o r
0.36 mmol/L LDL.
Qualitative analysis and process evaluation
Previous qualitative studies have isolated timeliness, cus-
tomizability, and a non-punitive tone as key criteria for
‘actionable’ feedback [53]. Evidence from the organiza-
tional literature suggests that the recipient must be
satisfied with the feedback for it to be accepted and
acted upon [54]. Unfo rtunately, the literature has not
provided clear direction regarding how to design feed-
back interventions targeted at family physicians to
accomplish this goal.
One previous study has assessed eight Ontarian physi-
cians’ reactions to a 20-minute one-on-one performance
assessment presentation based on chart audits and
patient questionnaires, and found that physicians wel-
comed it [55]. Even though the data were garnered
directly from charts, the particip ants expressed concerns
about government involvement in the performance
improvement process. Another study revealed a general
scepticism amongst physicians regarding quality
improvement interventions based on secondary data-
bases [56]. Nevertheless, the MOHLTC, is now using
administrative data to send all family physicians ‘Dia-
betes Testing Reports’ regarding their patients with dia-
betes [57]. These reports from the government will
provide far less data to the physicians (and nothing
regarding patients with IHD) compared to the interven-
tion described in this protocol. This context provides an
oppor tunity to work with physicians receiving two types
of diabetes feedback to explore the barriers and facilita-
tors to Ontario family physicians’ acceptance and utiliza-
tion of performance feedback, and to exa mine the
perceived actionability of various approaches to the
design and delivery of feedback. While the ongoing gov-
ernment feedback will likely enri ch the qualitative com-
ponent of the study, we do not believe that it will
impact the inferences made from the trial. All partici-
pants will receive the government feedback, but the gov-
ernment feedback does not explicitly encourage goal
setting or action plans.
Semi-structured, individual interviews will be con-
ducted using an interview guide, developed based on a
review of the literature and consideration of the twelve
domains described by Michie et al. to explain behaviour
change in response to an intervention [58]. We will use
‘stratified purposeful sampling’ [59]; we will select parti-
cipants with those features believed to be relevant, not
with the goal of probabilistic representativeness, but for
info rmational representativeness. For instance, guideline
adherence and quality of care may be inversely related
Ivers et al . Implementation Science 2010, 5:98
/>Page 7 of 10
to years in practice [60] and physician gender [61], so
variety will be sought in these factors. Additionally, the
participants will be chosen to represent varying lev els of
baseline performance, because this was found to be an
important predictor in the Cochrane review. It is
expected that saturation may be accomplished with
approximately 12 interviews [62]. The sample will be
weighted with about two-thirds of participants having
received the enhanced feedback. To account for time
away from patient care, an honorarium will be offered
for participation.
Interviews will be recorded and a transcription service
used to produce verbatim electronic transcripts. These
will be stored with encryption software on a password-
protected computer drive. Identifying factors will be
omitted. NVivo™ software will be used to assist with the
data analysis. The framework analysis approach, as
described Ritchie and Spencer [63] (and more succinctly
by Pope et al.[ 64]) aims to accurately reflect the original
accounts of the participants through the use of inductive
techniques, yet start out deductively with preset goals.
As such, it represents an ideal foundation for analyzing
qualitative data within a pragmatic, mixed methods
study such as this one. For example, it has been success-
fully used in the past as part of a mixed method study
invest igating barriers and facilitators to guideline uptake
in the ICU [65].
The identification of themes will be tracked along with
dates of interpretations to provide an audit trail docu-
menting t he analysis. This is one way that trustworthi-
ness in the results can be increased [66]. Next, an index
of themes will be develo ped by combining apriori
objectives and issues identified in the literature with
those raised by the participants and recognized through
the readings. This process w ill occur after seven inter-
views have been completed and will be repeated in part
by a second researcher (JB). It is thought that multiple
coding provides a system of check and balances to
ensure that all possible themes are given consideration
[67]. Disagreements will be settled through consensus
and this proc ess may lead to changes in the interview
guide. At this point, disconfirming evidence to ensure
saturation of themes will be sought from further partici-
pants through the use of snowball sampling (by asking
participan ts to suggest colleagues that may have unique
perspectives on feedback). In this way, elements of mu l-
tiple coding and the constant comparative method will
be incorporated. Therefore, the qualitative protocol will
meet the criteria described by Kuper for judging qualita-
tive research [68].
Discussion
With the use of audit and feedback interventions likely
to increase over time, there is a need to understand how
their design effects the behaviour of primary care provi-
ders. This project will play a role in learning how to
generat e feedback reports that are useful for family phy-
sicians. Ev en if the trial is negative, the qualitative pro-
cess evaluation will provide useful information and
generate new study questions. Future studies may then
compare the cost-effectiveness of using interventions
similar to the one describ ed in this trial against more
intensive interventions such as academic detailing or
practice facilitators.
There are also some important limitations that war-
rant discussion. One concern regarding generalizability
is that it is possible that there will be a specific inter-
action between the worksheet intervention and the
feedback such that adding the worksheet to other
designs/types of feedback or other interventions may
not work as well. It is also important to note that par-
ticipants in EMRALD are a convenience sample of
Ontario family physicians using Practice Solutions®.
Therefore, findings from this group will not be strictly
generalizable to other providers who use different
EMR systems, or to those not using EMR at all. In
addition, many of the clinics are involved in other
quality improvement interventions. Thus, these clinics
maybemoreinnovativeandmayalsobeachievinga
higher level of evidenc e-based care than most other
primarycareproviders.
Perceived data accuracy has been identified as an
essential feature for acceptance of feedback reports [69],
and previous studies have shown that data quality from
EMRs are uncertain [70]. While we have validated algo-
rithms for identifying patients who have diabetes and/or
IHD in this database, the automated chart audits that
are the basis for both the intervention and the outcome
assessment may occasionally have errors. However,
there is no reason to believe that any such errors occur-
ring in the data abstraction process represent a risk for
bias; any problems with the algorithm would be equally
likely to occur in either arm of the trial.
This is a prag matic trial that is powered to find small
(but important) effects of a feedback intervention based
on the addition of a theoretically-infor med worksheet.
While a longer, larger trial would be ideal to assess true
cardiovascular endpoints, the size and timeframe of this
trial have been designed to ensure feasibility. Psychologi-
cal theory applicable to feedback inter vent ions indica tes
that the worksheet intervention tested in this trial
should help family physicians to close the gap between
their intended and actual behaviours with re spect to the
care they provide for their patients. If the intervention
works in this sample, it could be tested more broadly; if
it is not effective, it may be necessary to try more inten-
sive approaches to facilitate providers to achieve their
quality improvement targets.
Ivers et al . Implementation Science 2010, 5:98
/>Page 8 of 10
Additional material
Additional file 1: Feedback Intervention. Prototype of feedback report
that all participants will receive
Additional file 2: Goal-setting and Action-plan Worksheet for
Enhanced Feedback Intervention. Prototype of the intervention that
will be tested in the trial
Acknowledgements
We would like to thank the physicians participating to date in EMRALD.
Funding for the study includes: The development and testing of the
intervention and the qualitative aspect of the project is supported by a
Canadian Institutes of Health Research team grant, Knowledge Translation
Improved Clinical Effectiveness Behavioural Research. Group (KT-ICEBeRG);
EMRALD is funded by a Canadian Institutes of Health Research Team (CIHR)
Grant in Cardiovascular Outcomes Research to the Canadian Cardiovascular
Outcomes Research Team 2 . The entire project is
supported by the ICES, which is funded by an annual grant from the
MOHLTC. The opinions, results, and conclusions reported in this articl e are
those of the authors and are independent from the funding sources. No
endorsement by ICES or the Ontario MOHLTC is intended or should be
inferred. NI is supported by a CIHR Fellowship: Transdisciplinary
Understanding and Training on Research-Primary Healthcare (TUTOR-PHC).
RU is supported by a CIHR Canada Research Chair in Primary Care Research.
JMG is supported by a CIHR Canada Research Chair in Health Knowledge
Transfer and Uptake.
Author details
1
Women’s College Hospital Family Health Team, 76 Grenville Street, Toron to
ON, M5 S 1B2, Canada.
2
Institute for Clinical Evaluative Sciences, 2075
Bayview Avenue, Toronto ON, M4N 3M5, Canada.
3
Department of Health
Policy Management and Evaluation, University of Toronto, Health Sciences
Building, 155 College Street, Suite 425, Toronto, ON, M5T 3M6, Canada.
4
Department of Family and Community Medicine, University of Toronto, 263
McCaul Street, 5th Floor Toronto ON, M5T 1W7, Canada.
5
Toronto Western
Hospital Family Health Team, University Health Network, 399 Bathurst Street,
West Wing, 2nd Floor, Toronto, ON, M5T 2S8, Canada.
6
Health Services
Research Unit, University of Aberdeen, Third Floor Health Sciences Building,
Foresterhill, Aberdeen, UK.
7
Sunnybrook Health Sciences Centre, 2075
Bayview Avenue, Toronto ON, M4N 3M5, Canada.
8
Joint Centre for Bioethics,
University of Toronto, Health Sciences Building, 155 College Street, 7th floor,
Toronto, ON, M5T 1P8, Canada.
9
Clinical Epidemiology Program, Ottawa
Health Research Institute, 1053 Carling Avenue, Administration Building,
Room 2-017, Ottawa ON, K1Y 4E9, Canada.
Authors’ contributions
NI and MZ conceived the idea. NI prepared the manuscript. All authors have
made substantial contributions to the research design, have edited the
manuscript critically, and have approved of the final version.
Competing interests
The authors declare that they have no competing interests.
Received: 24 August 2010 Accepted: 17 December 2010
Published: 17 December 2010
References
1. Haffner SM, Lehto S, Ronnemaa T, Pyorala K, Laakso M: Mortality from
coronary heart disease in subjects with type 2 diabetes and in
nondiabetic subjects with and without prior myocardial infarction. N
Engl J Med 1998, 339(4):229-234.
2. Burge FI, Bower K, Putnam W, Cox JL: Quality indicators for cardiovascular
primary care. Can J Cardiol 2007, 23(5):383-388.
3. Narayan KM, Benjamin E, Gregg EW, Norris SL, Engelgau MM: Diabetes
translation research: where are we and where do we want to be? Ann
Intern Med 2004, 140(11):958-963.
4. Davis D, Davis N: Educational Interventions. In Knowledge Translation in
Health Care - Moving from Evidence to Practice. Edited by: Straus S, Tetroe J,
Graham ID. UK: Wiley-Blackwell; 2009:116.
5. Shojania KG, Ranji SR, McDonald KM, Grimshaw JM, Sundaram V,
Rushakoff RJ, Owens DK: Effects of quality improvement strategies for
type 2 diabetes on glycemic control: a meta-regression analysis. JAMA
2006, 296(4):427-440.
6. Oxman AD, Thomson MA, Davis DA, Haynes RB: No magic bullets: a
systematic review of 102 trials of interventions to improve professional
practice. CMAJ 1995, 153(10):1423-1431.
7. Davis DA, Mazmanian PE, Fordis M, Van Harrison R, Thorpe KE, Perrier L:
Accuracy of physician self-assessment compared with observed
measures of competence: a systematic review. JAMA 2006,
296(9):1094-1102.
8. Jamtvedt G, Young JM, Kristoffersen DT, O’Brien MA, Oxman AD: Audit and
feedback: effects on professional practice and health care outcomes.
Cochrane Database Syst Rev 2006, 2(2):CD000259.
9. Foy R, Eccles MP, Jamtvedt G, Young J, Grimshaw JM, Baker R: What do we
know about how to do audit and feedback? Pitfalls in applying
evidence from a systematic review. BMC Health Serv Res 2005, 5:50.
10. Hysong SJ: Meta-analysis: audit and feedback features impact
effectiveness on care quality. Med Care 2009, 47(3):356-363.
11. Gardner B, Whittington C, McAteer J, Eccles MP, Michie S: Using theory to
synthesise evidence from behaviour change interventions: the example
of audit and feedback. Soc Sci Med 2010, 70(10):1618-1625.
12. Kluger AN, DeNisi A: The Effects of Feedback Interventions on
Performance: A Historical Review, a Meta-Analysis, and a Preliminary
Feedback Intervention Theory. Psychol Bull 1996, 119(2):254-284.
13. Carver CS, Scheier MF: Control theory: a useful conceptual framework for
personality-social, clinical, and health psychology. Psychol Bull 1982,
92(1):111-135.
14. Locke EA, Latham GP: Building a practically useful theory of goal setting
and task motivation. A 35-year odyssey. Am Psychol 2002,
57(9):705-717.
15. Gollwitzer PM: Implementation Intentions. Am Psychol 1999, 54(7):493-503.
16. Locke EA: A theory of goal setting & task performance Englewood Cliffs, N.J.:
Prentice Hall; 1990.
17. Bandura A: Self-efficacy. In Encyclopedia of human behavior. Edited by:
Ramachandran VS. Toronto: Academic Press; 1994:71-81.
18. Ajzen I, Manstead ASR: Changing health-related behaviors: An approach
based on the theory of planned behavior. In The scope of social
psychology: Theory and applications. Edited by: van den Bos K, Hewstone M,
de Wit J, Schut H, Stroebe M. New York: Psychology Press; 2007:43-63.
19. Gollwitzer PM, Fujita K, Oettingen G: Planning and the Implementation of
Goals. In Handbook of self-regulation: research, theory, and applications.
Edited by: Baumeister RF, Vohs KD. New York: Guilford Press; 2004:211-228.
20. Kirschner K, Braspenning J, Maassen I, Bonte A, Burgers J, Grol R: Improving
access to primary care: the impact of a quality-improvement strategy.
Qual Saf Health Care 2010, 19(3):248-251.
21. O’Brien MA, Rogers S, Jamtvedt G, Oxman AD, Odgaard-Jensen J,
Kristoffersen DT, Forsetlund L, Bainbridge D, Freemantle N, Davis DA,
Haynes RB, Harvey EL: Educational outreach visits: effects on professional
practice and health care outcomes. Cochrane Database Syst Rev 2007, 4(4):
CD000409.
22. Davies P, Walker AE, Grimshaw JM: A systematic review of the use of
theory in the design of guideline dissemination and implementation
strategies and interpretation of the results of rigorous evaluations.
Implement Sci 2010, 5:14.
23. Dawson L, Zarin DA, Emanuel EJ, Friedman LM, Chaudhari B, Goodman SN:
Considering usual medical care in clinical trial design. PLoS Med 2009,
6(9):e1000111.
24. Stand Up To Diabetes - Ontario.ca. [ />diabetes/en/].
25. Tu K, Klein-Geltink J, Mitiku TF, Mihai C, Martin J: De-identification of
primary care electronic medical records free-text data in Ontario,
Canada. BMC Med Inform Decis Mak 2010, 10:35.
26. Tu K, Manuel D, Lam K, Kavanagh D, Mitiku TF, Guo H: Diabetics can be
identified in an electronic medical record using laboratory tests and
prescriptions. J Clin Epidemiol 2010.
27. Ivers NM, Pylypenko B, Tu K: Identifying Ischemic Heart Disease in an
Electronic Medical Record. Journal of Primary Care and Community Health;.
Ivers et al . Implementation Science 2010, 5:98
/>Page 9 of 10
28. OntarioMD Funding Eligible EMR Offerings: EMR Advisor. [https://www.
emradvisor.ca/compare].
29. Jackson GL, Weinberger M: A decade with the chronic care model: some
progress and opportunity for more. Med Care 2009, 47(9):929-931.
30. Quality Improvement and Innovation Partnership: Advancing
Improvement in Primary Healthcare in Ontario. [ />php].
31. Kiefe CI, Allison JJ, Williams OD, Person SD, Weaver MT, Weissman NW:
Improving quality improvement using achievable benchmarks for
physician feedback: a randomized controlled trial. JAMA 2001,
285(22):2871-2879.
32. Sniehotta FF: Towards a theory of intentional behaviour change: plans,
planning, and self-regulation. Br J Health Psychol 2009, 14(Pt 2):261-273.
33. Luszczynska A, Haynes C: Changing nutrition, physical activity and body
weight among student nurses and midwives: effects of a planning
intervention and self-efficacy beliefs. J Health Psychol 2009,
14(8):1075-1084.
34. Introduction to MAINPRO CPD, The College of Family Physicians of
Canada. [ />35. Shershneva MB, Wang MF, Lindeman GC, Savoy JN, Olson CA:
Commitment to Practice Change: An Evaluator’s Perspective. Eval Health
Prof 2010, 33(3):256-75.
36. Wakefield JG: Commitment to change: exploring its role in changing
physician behavior through continuing education. J Contin Educ Health
Prof 2004, 24(4):197-204.
37. Mazmanian PE, Johnson RE, Zhang A, Boothby J, Yeatts EJ: Effects of a
signature on rates of change: a randomized controlled trial involving
continuing education and the commitment-to-change model. Acad Med
2001, 76(6):642-646.
38. Overton GK, MacVicar R: Requesting a commitment to change: conditions
that produce behavioral or attitudinal commitment. J Contin Educ Health
Prof 2008, 28(2):60-66.
39. Minim: allocation by minimisation in clinical trials by Stephen Evans,
Patrick Royston and Simon Day. [ />guide/minim.htm].
40. Hewitt CE, Torgerson DJ: Is restricted randomisation necessary? BMJ 2006,
332(7556):1506-1508.
41. Scott NW, McPherson GC, Ramsay CR, Campbell MK: The method of
minimization for allocation to clinical trials. a review. Control Clin Trials
2002, 23(6):662-674.
42. Altman DG, Bland JM: Treatment allocation by minimisation. BMJ 2005,
330(7495):843.
43. Bhattacharyya OK, Estey EA, Cheng AY, Canadian Diabetes Association 2008:
Update on the Canadian Diabetes Association 2008 clinical practice
guidelines. Can Fam Physician 2009,
55(1):39-43.
44. Genest J, McPherson R, Frohlich J, Anderson T, Campbell N, Carpentier A,
Couture P, Dufour R, Fodor G, Francis GA, Grover S, Gupta M, Hegele RA,
Lau DC, Leiter L, Lewis GF, Lonn E, Mancini GB, Ng D, Pearson GJ,
Sniderman A, Stone JA, Ur E: 2009 Canadian Cardiovascular Society/
Canadian guidelines for the diagnosis and treatment of dyslipidemia
and prevention of cardiovascular disease in the adult - 2009
recommendations. Can J Cardiol 2009, 25(10):567-579.
45. Cooper A, Skinner J, Nherera L, Feder G, Ritchie G, Kathoria M,
Turnbull N, Shaw G, MacDermott K, Minhas R, Packham C, Squires H,
Thomson D, Tim mis A, Walsh J , Willia ms H, White A: Clinical Guidelines
and Evidence Review for Post Myocardial Infarction: Secondary
prevention in primary and secondary care for patients following a
myocardial infarction. Anon ymous London: National Collaborating Cen tre
for Primary Care and Royal College of General Practitioners 2007,
[Anonymous].
46. NICE and Diabetes: A Summary of Relevant Guidelines, November 2009.
[ />47. Holbrook A, Thabane L, Keshavjee K, Dolovich L, Bernstein B, Chan D,
Troyan S, Foster G, Gerstein H, COMPETE II Investigators: Individualized
electronic decision support and reminders to improve diabetes care in
the community: COMPETE II randomized trial. CMAJ 2009, 181(1-2):37-44.
48. Canadian Hypertension Education Program, Campbell N, Kwong MM: 2010
Canadian Hypertension Education Program recommendations: An
annual update. Can Fam Physician 2010, 56(7):649-653.
49. Law MR, Morris JK, Wald NJ: Use of blood pressure lowering drugs in the
prevention of cardiovascular disease: meta-analysis of 147 randomised
trials in the context of expectations from prospective epidemiological
studies. BMJ 2009, 338:b1665.
50. Donner A, Klar N: Design and Analysis of Cluster Randomization Trials in
Health Research New York: Oxford University Press; 2000.
51. Littenberg B, MacLean CD: Intra-cluster correlation coefficients in adults
with diabetes in primary care practices: the Vermont Diabetes
Information System field survey. BMC Med Res Methodol 2006, 6:20.
52. Kizer JR, Madias C, Wilner B, Vaughan CJ, Mushlin AI, Trushin P, Gotto AM Jr,
Pasternak RC: Relation of different measures of low-density lipoprotein
cholesterol to risk of coronary artery disease and death in a meta-
regression analysis of large-scale trials of statin therapy. Am J Cardiol
2010, 105(9):1289-1296.
53. Hysong SJ, Best RG, Pugh JA: Audit and feedback and clinical practice
guideline adherence: Making feedback actionable. Implement Sci 2006,
1:9.
54. Levy P, Williams J: The Social Context of Performance Appraisal: A Review
and Framework for the Future. Journal of Management 2004,
30(6):881-905.
55. Rowan MS, Hogg W, Martin C, Vilis E: Family physicians’ reactions to
performance assessment feedback. Can Fam Physician 2006,
52(12):1570-1571.
56. McAlearney AS, Chisolm DJ, Schweikhart S, Medow MA, Kelleher K: The
story behind the story: physician skepticism about relying on clinical
information technologies to reduce medical errors. Int J Med Inform 2007,
76(11-12):836-842.
57.
Stand Up To Diabetes - About Diabetes Testing Report - Ontario.ca.
[ />html].
58. Michie S, Johnston M, Abraham C, Lawton R, Parker D, Walker A,
’Psychological Theory’ Group: Making psychological theory useful for
implementing evidence based practice: a consensus approach. Qual Saf
Health Care 2005, 14(1):26-33.
59. Sandelowski M: Combining qualitative and quantitative sampling, data
collection, and analysis techniques in mixed-method studies. Res Nurs
Health 2000, 23(3):246-255.
60. Doroodchi H, Abdolrasulnia M, Foster JA, Foster E, Turakhia MP,
Skelding KA, Sagar K, Casebeer LL: Knowledge and attitudes of primary
care physicians in the management of patients at risk for cardiovascular
events. BMC Fam Pract 2008, 9:42.
61. Berthold HK, Gouni-Berthold I, Bestehorn KP, Bohm M, Krone W: Physician
gender is associated with the quality of type 2 diabetes care. J Intern
Med 2008, 264(4):340-50.
62. Kuzel AJ: Sampling in Qualitative Inquiry. In Doing Qualitative Research.
Research Methods for Primary Care. Volume 3. Edited by: Crabtree B, Miller W.
California: Sage Publications; 1992:41.
63. Ritchie J, Spencer L: Qualitative data analysis for applied policy research.
In Analyzing qualitative data. Edited by: Bryman A, Burgess RG. London:
Routledge; 1994:173-194.
64. Pope C, Ziebland S, Mays N: Qualitative research in health care. Analysing
qualitative data. BMJ 2000, 320(7227):114-116.
65. Jones NE, Suurdt J, Ouelette-Kuntz H, Heyland DK: Implementation of the
Canadian Clinical Practice Guidelines for Nutrition Support: a multiple
case study of barriers and enablers. Nutr Clin Pract 2007, 22(4):449-457.
66. Wolf ZR: Exploring the audit trail for qualitative investigations. Nurse Educ
2003, 28(4):175-178.
67. Barbour RS: Checklists for improving rigour in qualitative research: a case
of the tail wagging the dog? BMJ 2001, 322(7294):1115-1117.
68. Kuper A, Lingard L, Levinson W: Critically appraising qualitative research.
BMJ 2008, 337:a1035.
69. van der Veer SN, de Keizer NF, Ravelli AC, Tenkink S, Jager KJ: Improving
quality of care. A systematic review on how medical registries provide
information feedback to health care providers. Int J Med Inform 2010,
79(5):305-323.
70. Thiru K, Hassey A, Sullivan F: Systematic review of scope and quality of
electronic patient record data in primary care. BMJ 2003, 326(7398):1070.
doi:10.1186/1748-5908-5-98
Cite this article as: Ivers et al.: Feedback GAP: study protocol for a
cluster-randomized trial of goal setting and action plans to increase the
effectiveness of audit and feedback interventions in primary care.
Implementation Science 2010 5:98.
Ivers et al . Implementation Science 2010, 5:98
/>Page 10 of 10