báo cáo khoa học: " Target for improvement: a cluster randomised trial of public involvement in quality-indicator prioritisation (intervention development and study protocol)" doc
Bạn đang xem bản rút gọn của tài liệu. Xem và tải ngay bản đầy đủ của tài liệu tại đây (529 KB, 15 trang )
STUDY PROT O C O L Open Access
Target for improvement: a cluster randomised
trial of public involvement in quality-indicator
prioritisation (intervention development and
study protocol)
Antoine Boivin
1,2*
, Pascale Lehoux
3
, Réal Lacombe
2
, Anaïs Lacasse
4
, Jako Burgers
1
and Richard Grol
1
Abstract
Background: Public priorities for improvement often differ from those of clinicians and managers. Public
involvement has been proposed as a way to bridge the gap between professional and public clinical care priorities
but has not been studied in the context of quality-indicator choice. Our objective is to assess the feasibility and
impact of public involvement on quality-indicator choice and agreement with public priorities.
Methods: We will conduct a cluster randomised controlled trial comparing quality-indic ator prioritisation with
and without public involvement. In preparation for the trial, we developed a ‘menu ’ of quality indicators, based
on a systematic review o f existing validated indicator sets. Particip ants (public representatives, clinicians, and
managers) will be recruited from six participating sites. In intervention sites, public representatives will be
involved through direct participatio n (public representatives, clinicians, and managers will deliberate together to
agree on quality-indicator choice and use) and consultation (individual public recommendations for
improvement will be collected and presented to decision makers). In control sites, only clinicians and managers
will take part in the prioritisation process. Data on quality-indicator choice and intended use will be collected.
Our primary outcome will compare quality-indicator choice and agreement with public priorities between
intervention and control groups. A process evaluation based on direct observation, videorecording, and
participants’ assessment will be conducted to help explain the study’s results. The mar ginal cost of public
involvement will also be assessed.
Discussion: We identified 801 quality indicators that met our inclusion criteria. An expert panel agreed on a final
set of 37 items containing validated quality indicators relevant for chronic disease prevention and management in
primary care. We pilot tested our public-involvement intervention with 27 participants (11 pub lic representatives
and 16 clinicians and managers) and our study instruments with an additional 21 participants, which demonstrated
the feasibility of the intervention and generated important insights and adaptations to engage public
representatives more effectively. To our knowledge, this study is the first trial of public involvement in quality-
indicator prioritisation, and its results could foster more effective upstream engagement of patients and the public
in clinical practice improvement.
Trial registration: NTR2496 (Netherlands National Trial Register, ).
* Correspondence:
1
Scientific Institute for Quality of Healthcare, Radboud University Nijmegen
Medical Centre, Nijmegen, The Netherlands
Full list of author information is available at the end of the article
Boivin et al . Implementation Science 2011, 6:45
/>Implementation
Science
© 2011 Boiv in et al; licensee BioMed Central Ltd. This is an Open Access article distributed under the terms of the Creative Commons
Attribution License (http://creativecommons.o rg/licenses/by/2.0), which permits unrestricted use, distribution, and reproduction in
any medium, provided the original work is properly cited.
Background
Quality indicators can be used for setting measurable
targets for improvement and ensure that quality-
improvement activities tackle the most pressing areas
for change [1]. Public priorities on quality improvement
often markedly differ from those of clinicians and man-
agers [2-4]. Several authors have recommended that
public representatives, including patients and carers, be
involved in quality-improvement activities to ensure that
these efforts target their needs and expectations [5-9].
With the aging populat ion and the growing epidemic of
chronic disease, transforming the way health services are
delivered for chronic disease patients is a critical focus
of quality-improvement initiatives here and abroad.
These changes highlight the expert and proactive role
that patients, carers, and communities can play in
healthcare delivery and quality improvement [10,11]. In
recent years, a growing body of literature h as explored
the use of different methods to involve patients and the
public, along with other experts, in complex healthcare
policy and delivery decisions, including priority setting,
health research, technology assessment, and clinical
practice guideline development [12-19].
Public-involvement interventions can be classified in
three broad categories: communication methods (where
information is communicated to the public), consulta-
tion (information is collected from th e public), and par-
ticipation (information is exchanged between
participants) [20]. To date, most of the work on
patients’ roles in quality improvement falls under com-
munication and consultation methods, including public
reporting of performance results [21-23]; the develop-
ment of patient education material and decision aids
[24]; the collection of data on patients’ expectations,
experience of care, and satisfaction [25-31]; or th e use
of open consultations in the development of quality
indicators and clinical practice guidelines [4,12].
Although these involvement strategies allow patients
and the public to contrib ute to the quality agenda, they
leave several gaps unaddressed. First, the prioritisation
of indicators that will be used as targets for improve-
ment and will drive change at the clinical and manage-
ment level is still largely left to panels of experts and
professionals. Quality indicators can help to identify
priority areas for improvement, monitor change, and
report on the performance and quality of care [1]. Qual-
ity-indicator development and selection is usually based
on a combination of literature review and consensus
methods in which public representatives are seldom
involved, despite their critical strategic importance [1].
A few examples of large-scale consensus conferences
aiming at prioritising quality indicators at the national
or international level have included patient and public
representatives, but these initiatives have never been for-
mally evaluated [32-34].
A second gap in current involvement strategies is that
consultations on patients’ experience of care and satisfac-
tion often focus on those dimensions of care that are easier
to be appraised by patients, such as interpersonal commu-
nication and access, as opposed to other clinical and orga-
nisational aspects of care [4]. Also, patients involved
through communication and consultation methods tend
to appraise and judge quality in relation to their own indi-
vidual care, without consideration of existing research evi-
dence, the competing needs of different users in the
community, and the constraints of available resources and
services. As a result, health professionals, policy makers,
and the public often operate in different and separate
worlds in relation to quality improvement [35,36].
In response to those limitations, there is a growing
call for public-involvement methods that allow for active
participation and deliberation between stakeholders with
different expertises and knowledge [37]. Public delibera-
tion is a ‘ means by which the public can influence the
generation of data and the derivation of the policy
options as well as discussing acceptable decisions, thus,
taking account of public as well as expert knowledge
[38]’ . Deliberation is expected to result in (a) mutual
learning between participants; (b) the generation of
options that are formed on the basis of broader perspec-
tives, interests, and information; and (c) the formation
of solutions that most people involved in the delibera-
tive process can find acceptable [17,39].
Consultation, participation, and communication meth-
ods rest on different theoretical assumption s and meth-
ods. In the academic literature, a methodological and
paradigmatic divide tends to separate proponents of
consultation strategies (based on the collection of data
from population surveys and other epidemiological
methods) and proponents of participation methods that
rest on deliberative theory and political sciences [39,40].
Similarly, communication experts tend to focus their
work on methods to present information and evidence
to individual patients and public members in order to
support healthcare choices, behaviour change, and pub-
lic accountability [24,41]. As a result, mixed public-
involvement strategies have rarely been tested, althou gh
a number of quality-improvement organisations do
combine these different strategies in practice [12].
Many doubts remain regarding the feasibility and
impact of public involvement in quality improvement
[14,42-44]. To date, most empirical research on public
involvement in healthcare has studied the process of
involvement and its p erception by participants (e.g.,
whether public representatives are satisfied with the
experience and feel that deliberations were fair); no
Boivin et al . Implementation Science 2011, 6:45
/>Page 2 of 15
study has assessed the impact of public involvement in
quality-indicator prioritisation [14]. A recent knowledge
synthesis identified many barriers to the development of
effective involvement programs, including the following:
the lack of evidence o n public-involvement effectiveness,
concerns that public involvement may often be tokenistic
and is unlikely to influence group decision making, the
technical complexity of the task, the difficulty in identify-
ing and recruiti ng public members who are competent
and representative, the gap between professional and pub-
lic perspectives, and the feasibility of public-involvement
interventions in terms of time constraints and cost [45].
Our goal is to assess the feasibility and impact of pub-
lic involvement on quality-indicator prioritisation. Our
specific aims are the following:
1. Evaluate the impact of public involvement on:
a. quality-indicator choices and agreement with
public priorities (primary outcome);
b. decision makers’ intention to use the indica-
tors for quality improvement.
2. Identify factors that explain the effectiveness of
the public-involvement program.
3. Estimate the costs of invol ving the public in qual-
ity-indicator prioritisation.
Our main hypothesis is that public involvement will
result in quality-indicator choices that better agree with
public priorities.
Methodology
Project overview and design
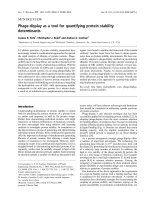
We will conduct a cluster randomised controlled trial
that will assess the impact of public involvement on
quality-indicator choice and intended use (Figure 1). A
cluster design is warranted because of our interest in
group decision making. In preparation for the trial, we
have developed a ‘menu’ of validated quality indicators
based on a systematic review of the literature and expert
consultation. We also pilot tested our intervention and
instruments. Participants (public representati ves, clini-
cians, and managers) will be recruited from six partici-
pating sites, which will be randomised in intervention
(quality-indicator prioritisation with public involvement)
and control sites (without public involvement).
Quality-indicator prioritisation will be conducted in
three steps. In step 1, public repr esentatives will have a
one-day training session to familiarize themselves with
the propos ed indicators and will be asked to ma ke indi-
vidual recommendations on indicator choice. In step 2,
public representatives will participate in a one-day delib-
erative meeting with clinician s and managers to agree
on five group recommendations. In step 3, individual
and group recommendations will be fed back to decision
makers, who will choose the indicators to be selected as
local targets for improvement and discuss actions to
support their use in clinical and management practices.
Public-involvement methods in intervention sites will
combine participation (deliberation between public
Figure 1 Project overview. In intervention sites, public representatives are involved in quality-indicator prioritisation through consultation and
participation methods, while prioritisation in control sites does not involve public representatives.
Boivin et al . Implementation Science 2011, 6:45
/>Page 3 of 15
representatives, clinicians, and manage ment) and con-
sultation methods (public priorit ies collected at the
training meeting w ill be fed back to decision makers).
Quality-indicator prioritisation in control sites will only
involve clinicians and managers.
Data on quality-indicator priorities will be collected
from participants at each meeting. Decision makers’
intentions to use the selected indicators for quality-
improvement purposes will also be collected at the end
of the step 3 meeting. This study was approved by the
Université du Québec en Abitibi-Témiscamingue ethics
committee. The following section will describe in detail
the process of intervention development and pilot test-
ing, as well as the protocol of the trial that will be used
to assess the intervention’s impact.
Study setting
Abitibi-T émiscamingue is one of the largest administra-
tive regions of Québec, Canada, with a population of
145,886 people, including 6,500 people (4.5%) from First
Nations communities. The economy of the region is
centered around the mining and wood industry. Most of
the population is francophone and 4% have English as
their first language [46]. The Regional Health Autho rity
of Abitibi-Témiscamingue (Agence de la santé et des
services sociaux de l’Abitibi-Témiscaminge [ASSSAT]) is
responsible for coordinating the services in the region.
The region is divided into six local service networks,
each one under the responsibility of a local health
authority(Centredesantéetdeservicessociaux
[CSSS]). The six local health authorities cover rural ter-
ritories of a few thousand people with basic community
care and medium-size towns of approximately 40,000
people with specialised hospital care. Local Health
Authorities are responsible for ensuring access to health
and social services for the population in its territory
through direct service delivery and agreements with
partner organisations in its local services network (medi-
cal clinics, community organisations, specialist services
and hospitals, etc.) [47]. Most family physicians provid-
ing primary care services in the region are organised in
family medicine groups (Groupes de Médecine Familiale
[GMFs]), a group of family physicians working in close
collaboration with nurses in an environment that fosters
providing family medicine to registered individuals.
Family physicians in the region cover many secondary
care services (e.g., emergency room, hospital care, obste-
trical care, intensive care unit). Each local health author-
ity is more than 100 km from another local health
authority and serves a rather captive population that
receives most of its care within its own community.
Since 2005, the ASSSAT has been implementing a
regional chronic disease prevention and management
program based on the integration of public health
approaches and clinical services for chronic disease
prevention and management, the promotion of inter-
disciplinary work, collaboration with community orga-
nisations, self-care support, and case management [48].
Modelled on the Expanded Chronic Care Model [49],
this regional program targets the prevention and man-
agement of four chronic conditions (diabetes, chronic
obstructive lung disease, is chemic heart disease, and
heart failure) but also supports broader structural
changes and integration within local health authorities
and their local services network partners. Adaptation
of the regional program to local priorities and context
has been encouraged since the beginning of the pro-
gram. An implementation evaluation of t he program
conducted in 2008-2009 concluded that the develop-
ment and use of quality indicators could help support
change and quality improvement at the local level [50].
The target for improve ment trial was devel oped and
integrated within the overall implementa tion strategy
of the ASSSAT regional chronic disease prevention
and management program. The study will be con-
ducted among the six local health authorities of t he
region.
Identification of quality indicators
We used a systematic process to develop a menu of
quality indicators on chronic disease prevention and
management that would be valid, relevant within the
context of primary care in Canada, and measurable
usingexistinginformationsystems. To be included, the
identified indicator had to:
1. relate to the prevention or management of
chronic diseases, defined as health conditions requir-
ing ongoing management over a period of years or
decades [51]. We included generic indicators applic-
able to any chronic disease and disease -specific indi-
cators related to the prevention and management of
type 2 diabetes, chronic obstructive pulmonary d is-
ease, coronary heart disease, or heart failure;
2. measure an element of practice structure, process,
or outcome for which there is evidence or consensus
that it can be used to assess t he quality, and hence
effect change, in the quality of care provided [1];
3. have been cited in a peer -review publication that
either described its development process, assessed its
psychometric properties, or used it for research and
evaluation.
We grouped our indicators into five quality domains:
access, integration, technical quality of prevention and
clinical management, interpersonal care, and outcomes.
Our classification was developed from a concept analysis
of existing quality-do main frameworks [2,3 ,33 ,34,52-59]
Boivin et al . Implementation Science 2011, 6:45
/>Page 4 of 15
and rested on operational definitions of primary care
attributes developed by Canadian experts [59].
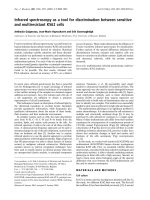
Figure 2 summarises the indicator identification and
selection process. We first conducted a systematic
search for quality indicators from the National Quality
Measure Clearinghouse [57]
1
and bibliographic databases
(MEDLINE, PsycINFO, HTA Database, NHS Economic
Evaluation Database, EconLit, Business Source Premier,
Health and Psychosocial Instruments)
2
,aswellas
through contact with experts and key informants and
hand-searching of reference from relevant papers.
We identified a total of 1489 individual indicators. 801
indicators met our inclusi on criteria. We extracted each
included individual indicator and built a quality-indica-
tor database. Two independent researchers, including
the p rincipal investigator, identified and removed dupli-
cates. When multiple related clinical care indicators
were present, w e chose indicators that were developed
in Canada or that were most closely aligned with cur-
rent Canadian clinical practice guidelines [60-65]. We
presented the remaining list of individual indicators to a
panel of five experts (two physicians, two health man-
agers, and an information specialist) who shared colle c-
tive expertise in the clinical and organisational aspects
of chronic disease management and knowledge of the
clinical context and the available information systems.
Expert panel member independently rated each indica-
tor based on relevance and measurability. Expert panel
members met twice to agree on the final list of
indicators.
Primary care delivery in Canada is largely provided by
family physicians, but allied health professionals, such as
primary care nurses and nurse practitioners, are playing
an increasing role in this area. To reflect these system
characteristics, we adapted the wording of some indica-
tors by changing ‘regular doctor’ to ‘ family doctor’ or
‘regular primary healthcare provider’, in accordance with
current Canadian indicators [66]. We translated the
selected indicators in French and wrote a plain language
description of each. Our expert panel validated the indi-
cator translation and description. Subscales of individual
questionnaires (e.g., the Primary Care Assessment Sur-
vey continuity domain [67]) and disease-specific clinical
indicators (e.g. clinical management of type 2 diabetes)
were grouped together as individual menu items.
The proposed indicator menu was tested for compre-
hens iven ess and relevance with a group of public repre-
sentatives and professionals in our pilot project
(described below). The final menu of indicators is com-
posed of 37 menu items (Tab le 1). T he complete
description of each indicator and a reference to the ori-
ginal indicator set is included in Additional file 1.
Development of the intervention and pilot testing
The development, pilot testing, and refinement of the
intervention followed a structured framework for the
design and evaluation of complex interventions in health
[68]. Our public-involvement intervention development
is based on best-practice recommendations for public
involvement in healthcare [5,12,13,69-72] and quality-
indicator development [33,73-75]. We sought to use a
public-involvement strategy that combined consultation
and partici pation methods. The consultative component
aims at collecting public recommendations from a broad
and diverse group of public representatives. The partici-
pation component aims at supporting deliberation
among clinicians, managers, and public representatives
to foster mutual learning, respectful disagreement, con-
sensus building, and the emergence of a collective per-
spective on quality improvement [20,39]. Our quality-
indicator prioritisation process is based on the RAND
appropriateness method, which combines a systematic
review of existing indicators, an individual rating of indi-
cators by a Delphi procedure, and a face-to-face delib-
eration and rerating of indicators using nominal group
technique [76].
Research questionnaires were pretested with 21 people
before being used in our three pilot meetings. We pilot
Figure 2 Systematic review of quality indicators flowchart.
Systematic review and selection of existing validated quality
indicators for chronic disease prevention and management in
primary care.
Boivin et al . Implementation Science 2011, 6:45
/>Page 5 of 15
tested the format of step 1 and step 2 meetings in the
region of Lanaudière (Québec), 500 km away from the
participating sites. The nort hern part of this region has
sociodemographic and health system characteristics that
are similar to those of the region of Abitibi-Témisca-
mingue, thus allowing us to test the feasibility of the
intervention without contaminating our study sites.
Nineteen participan ts (nine public representatives, eight
clinicians and managers) participated in the step 1 and
step 2 pilot meetings in Ja nuary and February 2010. We
pilot tested our decision makers’ meeting (step 3) with
10 participants (two public representatives, eight man-
agers and clinicians) from the Regional Health Authority
of Abitibi-Témiscamingue at t he end of September
2010. Two researchers were present during each pilot
meeting and took observation notes. A structured
debriefing session was held with participants at the end
of each pilot meeting to identify what worked and what
did not and to collect suggestions for improvement. We
held debriefing meetings with our team to adjust the
intervention format and da ta collection instruments
based on participants’ comments and observations.
As a result of our pilot testing, we adapted our inter-
vention and instruments and decided to:
1. clarify participants’ responsibilities, by developing
a detailed written task description;
2. introduce the menu of indicators to public repre-
sentatives during the training session;
3. develop structured recruitment documents with
explicit representation criteria to facilitate the identi-
fication of public representatives from different
socioeconomic backgrounds;
4. invite more public representatives and physicians
in step 2 meetings to deal with potential attrition;
5. prepare a seating plan to facilitate interactions
between public representatives, clinicians, and managers;
6. develop structured prompts and suggestions to
support the group deliberation process and enable
participants to complete the task more effectively;
7. add two new items to the indicator menu on
stress and collaboration with community organisa-
tions, in response to public representatives and pro-
fessionals’ suggestions;
8. use videorecording rather than audiorecording to
better capture social interactions among participants;
9. use color coding and ranking of step 1 and step 2
reported recommendations, to facilitate their com-
munication to decision makers in step 3 meetings;
Table 1 Menu of quality indicators
Access
1. Perceived difficulty to obtain an appointment 2. Primary healthcare organisation’s opening hours
3. Access for disabled people 4. Family physicians accepting new patients
5. Medication and treatment cost 6. Language barriers
7. Phone access to a primary care provider
Integration
8. Coordination among healthcare organisations 9. Electronic communications
10. Primary care registries for chronic conditions 11. Perceived continuity of care
12. Team work and interdisciplinary care 13. Links with community organisations
Technical quality of prevention and clinical management
14. Physical activity counselling 15. Healthy eating counselling
16. Tobacco counselling 17. Influenza vaccination
18. Hypertension screening 19. Perceived technical quality of care
20. Clinical management of type 2 diabetes 21. Clinical management of coronary heart disease
22. Clinical management of chronic obstructive pulmonary disease (COPD) 23. Clinical management of heart failure
Interpersonal care
24. Self-care support 25. Patient participation in clinical decision making
26. Respect and empathy 27. Time available during the consultation
28. Trust toward primary care provider 29. Stress and responsibilities at work and at home
Outcomes
30. Fruit and vegetable consumption rate 31. Smoking rate
32. Physical activity rate 33. Blood pressure control
34. Perceived self-efficacy 35. Hospitalisation for ambulatory-care-sensitive conditions
36. Emergency room visit for ambulatory-care-sensitive conditions 37. Quality of life
Boivin et al . Implementation Science 2011, 6:45
/>Page 6 of 15
10. clarify the regional health authority’sexpecta-
tions toward indicator use.
Recruitment and randomisation of the participating sites
The local health authorities’ Chief Executive Officers
(CEOs) and GMF medical directors from all six terri-
tories of Abitibi-Témiscamingue agreed to participate in
the study (response rate = 100%). Site randomisation
will be done after the recruitment process of individual
participants is completed, using a random allocation
softwa re [77]. Randomisation will be carried out by one
of the researchers, with two independent observers pre-
sent, and will be concealed to the professionals in
charge of recruitment, the group facilitat or, and partici-
pants until the end of the step 1 meeting (see Control
section below).
Individual participants’ recruitment
Within each local health authority participating in the
study, we created recruitment teams who are responsi-
ble for identifying public representatives, clinicians, and
managers interested participating in the study. Each
local recruitment team includes a member of the CSSS
user committee, the manager in charge of the chronic
disease program, and the medical director of the family
medici ne group. Local health authorities’ CEOs will also
be solicited to identify the managers and clinicians who
will act as decision makers. Local recruitment teams will
identify potential participants by purposive sampling
and the snowballing technique, using our inclusion and
representation criteria described in Table 2[78]. We
seek to recruit clinicians and managers who are closer
to healthcare delivery to participate in the step 2
meeting (group recommendations) and senior-level
managers and professional council representatives for
step 3 (decision makers’ meeting), allowing for overlap
between both meetings.
For the purpose of our study, a public representative
can include any adult targeted by the regional chronic
disease prevention and management program who is
not a healthcare professional or employee. This includes
healthy adults, carers, and patients with chronic condi-
tions. Interested individual s will be g iven a written
description of the project and a ‘job profile’,explicitly
stating that we are looking for people who represent a
broad range of backgrounds and personal experiences
and who are willing to work collaboratively with other
public representatives, clinicians, and managers (Table
2). Identification of public representatives through local
recruitment teams allows us to reach public members
who have perceived legitimacy within their own com-
munity and who are interested in the issues discussed
[79]. A research assistant will contact potential partici-
pants, confirm their eligibility criteria and interest/avail-
ability for participating in the study, and collect basic
sociodemographic characteristics. The research team
will select participants based on the representation cri-
teria described in Table 2.
Description of the intervention
The intervention is composed of three one-day meetings
(step 1, step 2, and step 3) that aim at prioritizing local
quality indicators. The Regional Health Authority
exp ects that the selected indicators will be used to sup-
port continuous quality improvement of chronic disease
prevention and management (rather than for external
control or benchmarking), and each local health
Table 2 Inclusion and representation criteria
Category of
participant
Inclusion/exclusion criteria Representation criteria
Public
representatives
Steps 1, 2, 3
meetings
(Target: 90
participants)
1) Adult with or without a chronic condition
2) Be competent to share opinions with others
3) Not be currently or previously working as a
clinician or healthcare manager
Age, gender, employment, and health status (healthy adults without
chronic disease, patients with uncomplicated chronic disease, patients
with complex chronic conditions)
Clinicians and
managers
Step 2 meeting
(Target: 72
participants)
1) Work as a clinician or manager in relation with the
prevention or management of chronic diseases
2) Work within the catchment area of a participating
health authority
3) Be competent to share opinions with others
Include a minimum of two primary care physicians, one manager familiar
with the chronic disease program and existing information systems, and a
balanced mix of clinicians and managers involved in chronic disease
prevention and management
Clinicians and
managers
Step 3
decision makers’
meeting
(Target: 60
participants)
1) Be identified by the local health authority’s CEO to
advise him/her on the choice of quality indicator
2) Be a member of the board or professional council
of the local health authority or family medicine group
Include the CEO or his/her representative, as well as one physician; the
identification of other key decision makers is left to the CEO’s discretion
CEO = chief executive officer.
Boivin et al . Implementation Science 2011, 6:45
/>Page 7 of 15
authority will be allowed to select its own indicators.
The selected indicators will be integrated in the regional
accountability contracts signed with each local health
authority. Table 3 summarises the topics addressed in
each intervention meeting, and their content is
described in detail below.
Step 1: public representatives’ training and
recommendations
The step 1 meeting aims to train public representatives
and to collect their individual recommendations for
local quality improvement. Public representatives (target:
15 per site) will meet with the moderator for a one-day
meeting. Participants will be asked in turn to reflect and
share their experiences with and expectations toward
quality of care, will receive background information on
chronic disease and on existing prevention and manage-
ment services in their community, and will receive
explanations on the proposed quality indicators. At the
end of the meeting, public representatives will individu-
ally prioritise the quality indicators and identify five
indicators that they recommend as local targets for
improvement (public baseline recommendations).
Step 2: group recommendations
In the step 2 meeting, public representatives, clinicians,
and managers will deliberate together to agree on five
local group recommendations. We will aim to recruit a
total of 15 participants in each group (nine clinicians
and managers and six public representatives). We will
recruit public representatives from step 1 participants,
based on their availability, interest, and natural attrition.
If more people volunteer, the research team will select
candidates based on our representation criteria to
ensure a balanced representation of age, gender,
employment, and health status (Table 2).
Group rating and deliberation on quality-indicator prior-
itisation will be done in four steps: (1) participants priori-
tise indicators individually at the beginning of the day; (2)
feedback on indiv idual responses is given to the whole
group; (3) participants deliberate as a group on the indica-
tors’ pros and cons; (4) if consensus on group recommen-
dations cannot be reached, the moderator asks
participants to vote. At the end of the day, participants
will be asked to agree on five indicators that they recom-
mend using as targets for improvement in their territory
(group recommendation). They will also be asked to
record five indicators that they recommend individually.
We will explain to the participants that it is not necessary
for everybody to agree with the final group recommenda-
tions, as long as ever yone can ‘live with’ the com promise
or consensus reached by the group.
Step 3: decision makers’ meeting
In the step 3 meeting, decision makers identified by the
local health authority’ s CEO will choose which indica-
tors to use as local targets for improve ment and identify
actions to implement these indicators in clinical practice
and management. While step 1 and step 2 meetings will
be held locally within each participating site, we will
hold one semiregional step 3 meeting that will bring
together decision makers from all intervention sites, and
another semiregional meeting with all control site s. A
semiregional format will allow us to involve senior
Table 3 Intervention meetings’ content
Meetings Participants Content
Step 1: Public representatives’
training and recommendations
Public representatives (Target: 15/site) • Participants’ discussion on positive and negative
experience in relation to quality of care
• Information on chronic disease and local prevention
and management services
• Explanation of the indicator menu and data collection
on baseline public recommendations
Step 2: Group recommendation Clinicians and managers (Target: 9/site) and
public representatives (Target: 6/site)
• Individual baseline prioritisation
• Deliberation on indicator choice
○ Block 1 (Structure: access and integration)
○ Block 2 (Process: technical quality and
interpersonal care)
○ Block 3 (Outcome indicators)
• Final group recommendation and individual
recommendations
Step 3: Decision makers’ meeting Clinicians and managers (Target: 10/site) and
public representatives (Target: 2/site)
• Expectations from the Regional Health Authority on
quality-indicator choice and use
• Presentation of recommendations issued in step 1 and
step 2 meetings
• Deliberation on indicator choice and implementation
• CEOs summarise decisions and foresee actions for
each local health authority
CEO = chief executive officer.
Boivin et al . Implementation Science 2011, 6:45
/>Page 8 of 15
directors from the Regional Health Authority and send
consistent messages across all sites regarding the Regio-
nal Health Authority’s expectations.
Local and regional recommendations developed in
steps 1 and 2 meetings will be presented to decision
makers. Individual recommendations will be communi-
cated to decision makers by reporting the rank of each
indicator , calculated from the proportion of participants
who recommended each indicator. Group recommenda-
tions and individual recommendations will be color-
coded to facilitate their identification by decision
makers. Recommendations will be discussed in small-
group deliberation sessions within each site. At the end
of the meeting, each local health authority’s CEO will
summarise the decisions and actions proposed within
his/her own territory. A Regional Health Authority
representative (RL) will be present to explain the quality
indicator expected use, describe the professional and
technical resources that will be av ailable to support
quality-indicator implementation, and answer questions.
Public involvement in the step 3 meeting will combine
consultation and deliberation methods. Decision makers
will receive written feedback about individual recom-
mendations made by public representat ives in step 1
meetings (consultative c omponent). Public representa-
tives who participated in step 1 and step 2 meetings will
also be invited to attend the meeting (target: two partici-
pants/site) to answer decision makers’ questions and
assist them in their choice (participation component).
Moderator
A professional moderator (JL) with previo us experience
in communication and group facilitation will moderate
all step 1 and step 2 meetings and will also facilitate the
step 3 plenary sessions. In the step 3 meeting, two addi-
tional moderators will facilitate small-group deliberation
among decision makers from each site. All moderators
attended our pilot meetings and participated in a pre-
paration session to develop an animation grid, agree on
solutions to potential pitfalls, and develop prompts to
guide discussions. The moderators will be responsible
for welcoming participants, establishing ground rules
with them, ensure fair participation, and facilit ate delib-
eration and agreement on the proposed indicators and
actions. A member of the research team (AB) will attend
all meetings, present the project and the propose d indi-
cators, and answer technical questions.
Control
In control sites, quality-indicators prioritisation will be
done by clinicians and managers only, following the for-
mat described for the above step 2 and step 3 meetings.
Public representatives will not be involved in quality-
indicator prioritisation.
For research purposes, we will also conduct step 1
meetings in all control sites to collect data on local pub-
lic recommendations (see the Data Collection and Ana-
lysis sections below). The format and content of the
step 1 meeting will be identical in control and interv en-
tion sites. The moderator and participants will be
blinded to their allocation until the end of the meeting.
We will present the results of this public consultation to
control sites’ decision makers at the very end of the step
3 meeting, after we collect all trial outcome data on
quality-indicator choice and intended use.
The six participating sites are more than 100 km apart
from one another, clinicians and managers have rare
contact among themselves, and they serve rather captive
populations who receive most of their care within their
community, thus minimising the potential for contami-
nation across interve ntion and control groups. We will
ask all participants to respect the confidentiality of dis-
cussions and not to share any information in between
meetings. We will assess for potential contamination
among participants in all meetings.
Data collection
Table 4 describes the questionnaires that will be used
for data collection. Specific data collection instruments
are described in detail below. Research questionnaire s
were pretested with 21 persons, before being used in
our three pilot meetings (described above).
Quality-indicator prioritisation
Our primary outcome is the comparison of indicator
choice and agreement with public priorities between
intervention and control groups. Data on quality-indica-
tor prioritisation will be collected at baseline and at the
end of each meeting (Fig ure 3). In order to collect pub-
lic baseline priorities from all participating sites, we will
hold step 1 meetings with public representatives from
the six participating sites. Clinicians and managers’ base-
line priorities will be collected at the beginning of the
step 2 meeting. Postdeliberation priorities will be col-
lected at the end of the step 2 meeting. Decision
makers’ choice and final priorities will be collected at
the end of the step 3 meeting. We will also collect post-
consultation priorities from control site participants at
the end of the step 3 meeting, after we collect data on
decision makers’ choice and intention to use and pre-
sent results of public consultation. Postdelib eration and
postconsultation priorities will be used for process eva-
luation purposes to assess the contribution of each com-
ponent of the intervention.
The questionnaire on quality-indicator prioritisatio n
includes the menu item title, a description of the indica-
tor under each item (e.g., ‘percent of family physicians
who accept new patients’ ), as well as the source of
Boivin et al . Implementation Science 2011, 6:45
/>Page 9 of 15
information (patients’ charts, administrative data, or sur-
vey) and original reference (Additional File 1). At the
end of each questionnaire, participants are asked to
prioritise five quality indicators (’indicate the five indica-
tors that you believe are the most important to improve
chronic disease prevention and management in your ter-
ritory’ ) and to rank these five indicators in order of
importance [80].
In step 1 and step 2 meetings, a research team mem-
ber (AB) will read each item individually and answer
questions. Participants in these two meetings will be
asked to rate each indicator according to its perceived
importance and feasibility, using a Likert scale from 1 to
9 [2]. In step 3, participants will be sent the indicator by
mail before the meeting. Decision makers will be asked
to prioritise their five most important indicators after
Table 4 List of questionnaires
# Timing Respondents Data collected
Q1 Beginning of
step 1
Public Public representatives’ sociodemographic data (age, gender, ethnic group, language,
education, socioeconomic status, health status, health services use, prior attitude toward
public involvement)
Q2 End of step 1 Public Quality-indicators prioritisation (public baseline priorities)
Q3 End of step 1 Public Participants’ evaluation of the step 1 meeting
Q4 Step 2 and step
3 meetings
Clinicians and managers Clinicians and managers’ sociodemographic data (age, gender, ethnic group, language,
education, socioeconomic status, professional role, prior attitude toward public involvement)
Q5 Beginning of
step 2
Clinicians and managers Quality-indicator prioritisation (clinicians and managers’ baseline priorities)
Q6 End of step 2 Clinicians, managers, and
public representatives
Quality-indicator prioritisation (postdeliberation priorities)
Q7 End of step 2 Clinicians, managers, and
public representatives
Participants’ evaluation of the step 2 meeting
Q8 End of step 3 Clinicians, managers, and
public representatives
Quality-indicator prioritisation, attitude and intention to use the selected indicators for
quality improvement (decision makers’ choice and intention to use)
Q9 End of step 3 Clinicians and managers
(control sites only)
Quality-indicator prioritisation (postconsultation priorities); this questionnaire is completed
after we collect data on decision makers’ choice and intention to use, and after we present
results of public consultation to control sites
Q10 End of step 3 Clinicians, managers, and
public representatives
Participants’ evaluation of the step 3 meeting
Figure 3 Data collection on quality-indicator prioritisation. Participants’ priorities will be collected from each site at baseline and after each
meeting.
Boivin et al . Implementation Science 2011, 6:45
/>Page 10 of 15
they receive feedback on individual and group
recommendations.
Decision makers’ intention to use the selected indicators
Thequestionnaireondecisionmakers’ attitude and
intention toward indicator use will be completed by all
participants in the step 3 decision makers’ meeting, after
decision makers agree on which indicators they will
select as targets for improvem ent for their territory. We
have developed this que stionnaire from known predic-
tors and instruments used to measure the likely adop-
tion of quality indicators and heal th innovations
[75,81-85]. The questionnaire consists of 11 items cover-
ing decision makers’ attitude toward selected quality
indicators (importance, feasibility, credibility, group con-
sensus) and their intention to use and report on the
selected indicators for quality-improvement purposes.
Each item is scored on a 7-point Likert scale.
Cost analysis
In order to estimate the financial cost of publ ic involve-
ment in quality-indicator prioritisation, a cost analysis
will be conducted. In this ty pe of analysis, the costs of
an intervention are presented in a disaggregated form
[86]. We will adopt the perspective of the intervention
sponsor and report on the marginal financial costs of
public involvement, including the costs of public repre-
sentatives’ recruitment , training, financial compensation,
group facilitation, administrative support, meals, and
didactic material. The average costs per site will be esti-
mated based on actual project expenses.
Process evaluation
In the context of trials, process evaluation can be used
to explain the study’s results [87,88]. Our process e va-
luation will focus on understanding the effects of the
intervention and the mechanisms that underlie change.
A multiple case study will be used for this analysis, capi-
talising on natural intersite variations. Our analysis will
be guided by group process and deliberative theory to
explore how public involvement influences the content
of deliberation and the social interactions among partici-
pants [39,89-91]. Data collection will be carried out
using standardised questionnaires, direct observation of
all meetings by two independent nonparticipant obser-
vers, and video recording of all meetings. A group
debriefing session will be held with participants at the
end of each meeting. A standardised self-administered
evaluation questionnaire will also be distributed at the
end of each meeting, based on an existing deliberation
asse ssment questionnaire [92]. The evaluation question-
naire is composed of 22 items divided into five do mains
covering (1) roles, pro cedures, and objectives; (2) meet-
ing facilitation and support; (3) information received; (4)
participants’ interaction; and (5) overall satisfaction.
Each item is scored on a 7-point Likert scale. The
observers and moderators will hold a debriefing session
among themselves immediately after each meeting to
share observations.
Statistical analysis
Descriptive statistics will be used to summarise the
characteristics of the study population and assess the
comparability of intervention and control groups, as
well as to summarise data on quality-indicator choice,
intended use, and on the marginal costs of the
intervention.
We will descriptively report which quality indicators
are selected as targets for improvement within each site
at the end of the trial and calculate the proportion that
are in agreement with local public baseline priorities
(ranks 1 to 5). Individual quality-indicator priorities will
be analysed as a dichotomous measure by reporting the
proportion of participants who selected each indicator
as part of their five prior ities and by ca lculating its rank
(rank 1 = indicator selected by the greatest proportion
of participants). Agreement with pu blic priorities will be
analysed by calculating the correlation between profes-
sionals (clinicians and managers) and public priorities at
baseline and at the end of the trial (primary outcome).
Cluster randomisation leads to a reduction of effective
sample size and can give spurious statistical results if it
is not accounted for properly [93,94]. We will check the
data to assess the level of clusterisation within study
sites and use appropriate cluster -level analysis (e.g., mul-
tilevel modelling) if necessary. We will also compare
decision makers’ intenti on to use the selected indicators
and participants’ satisfaction between intervention and
control sites. Statistical significance will be assumed at p
< 0.05 (two-tailed test) for all tests.
Sample size
Our sample size calculation is based on pragmatic con-
siderations and takes into consideration the maximum
number of available sites/clusters in the region (n = 6
sites) and the maximum number of recommended parti-
cipants in small-group deliberation meeting s (n = 15
participants per meeting). We aim to recruit a total of n
= 90 public representatives, n = 72 clinicians and man-
agers for the step 2 meeting, and n = 60 senior man-
agers and professional council representatives for the
step 3 meeting. We will allow for overlap between clini-
cians and managers participating in step 2 and step 3
meetings.
Abelson and colleagues note that small sample sizes
are hard to overcome in studies of public participation
in healthcare as ‘deliberation decision-making dictates
small groups’ [13].Weexpectthatthepowerofour
Boivin et al . Implementation Science 2011, 6:45
/>Page 11 of 15
study will be further decreased by the cluster nature of
the trial, a lthough we are currently unable to estimate
the magnitude of this effect due to the absence of prior
trials of public involvement in quality-indicator prioriti-
sation and unknown intra-cluster coefficients for our
outcome of interest [93].
Integrated knowledge translation and postrandomisation
follow-up
We are following an integrated knowledge-translation
plan throughout the trial preparation and implementa-
tion,whereknowledgeusersaredirectlyinvolvedin
strategic aspects of research and knowledge productio n
[95]. This study is embedded in a larger implementation
strategy of the regional integrated chronic disease pre-
vention and management program [50]. Our team is
pursuing two core objectives in this project: (1) to sup-
port chr onic disease prevent ion and mana gement
through the selection and use of quality indicators that
will be used as local targets for improvement ( practice
component) and (2) to assess the impact of public invol-
vement on quality-indicator p rioritisation and intended
use (research component). Within this project, partner-
ship between decision makers and researchers will be an
ongoing process throughout the cycle of knowledge pro-
duction and use. At each stage of the intervention, we
will collaboratively (a) plan the initial ‘blueprint’ of the
intervention; (b) pilot test it; (c) ‘lock in’ the final format
of the intervention for its implementation in the trial;
and (d) collect, analyse, and communica te knowledge to
researchers and decision makers.
Our target knowledge users include clinicians, man-
agers, and public representatives from local health
authorities and the Regional Health Authority, as well
as provincial and national organisations involved in
indicator use and quality improvement. The principal
investigator (AB) will act both as a researcher (IQ
Healthcare) and as a medical advisor for the Regional
Health Authority (ASSSAT) and will be responsible for
facilitating the interaction between decision makers
and researchers on the project. A member of the
Regional Health Authority’s board of directors (RL)
has been included in all aspects of the study design
and research. Key aspects of the study protocol were
presented and discussed with the CEOs of all partici-
pating local health authorities, medical directors of
family medicine groups, the Regional Health Auth or-
ity’s board of directors, as well as with local and regio-
nal users’ committees and population forums. The
project was also presented to the Québec provincial
government in February 2010 [96]. Representatives
from AETMIS, a provincial organisation that has
received the mandate from the provincial Ministry of
Health to develop quality indicators for primary care
improvement, have also partnered with us on the
project.
Gibbens argues that research conducted in the con-
text of application has the potential to increase the
relevance and impact of the knowledge produced and
to foster its use and implementation in practice [97].
The Regional Health Authority of Abitibi-Témiscamin-
gue is c ommitted to supporting indicator implementa-
tion and use after the completion of the study to
support the improvement of chronic disease prevention
and management. Professional and t echnical resources
will be made available regionally to support indicator
use. Follow-up on quality-indicator use will be inte-
grated in the regional director-generals meeting, as
part of a statutory point on chronic disease prevention
and management.
Discussion
To the best of our knowledge, this study is the first trial
of public involvement in quality-indicator prioritisation
[14]. It tackles important knowledge gaps on how mem-
bers of the public, including patients and carers, can be
effectively involved in strategic aspects of quality
improvement. A strength of the study is the systematic
approach that was used to develop and refine the pub-
lic-involvement intervention, based on existing frame-
works for the development and testing of complex
health interventions. Our pilot project provided impor-
tant insights on how to engage public representatives
more effectively. The testing of this intervention in a
real-world prioritisation context has the potential to
increase the external validity of findings and test the fea-
sibility of the intervention in practice. A limitation of
the study is our small effective sample size, given t he
cluster nature of the trial and restrictions regarding the
maximum number of sites and individual participants
that can be recruited for a deliberative intervention. We
nonetheless expect that this trial will provide important
knowledge into the feasibility, process, and effectiveness
of public involvement in quality-indicator prioritisation,
thus fostering upst ream engagement of patients and the
public in clinical practice improvement.
Additional material
Additional file 1: Description of the quality indicators used in the
Target for Improvement Trial. Additional file 1 includes the detailed
description of the final 37-item ‘menu’ of quality indicators used in the
trial, with references to the original indicator sets.
Acknowledgements
This study is funded by an operating grant from the Canadian Health
Services Research Foundation and the Agence de la Santé et des Services
Sociaux de l’Abitibi-Témiscamingue (CHS-2160). AB is supported by a
Boivin et al . Implementation Science 2011, 6:45
/>Page 12 of 15
Clinician-Scientist Training Award from the Canadian Institutes of Health
Research. PL holds a Canada Research Chair on Health Innovations (2010-
2015).
The Agence de la Santé et des Services Sociaux de l’Abitibi-Témiscamingue
has supported this work in a very significant way. Celine Hubert, Sylvie
Bellot, and Mélanie Gauthier have worked with a lot of dedication and
expertise as research professionals on this project, along with Jolyne Lalonde
(Dery & Associés) who acts as our lead moderator and expert on group
facilitation. Lise St-Amour, Suzanne Chartier, Christiane Lacombe, Denise
Stewart, Gerald Letourneau, Nicole Desgagnés Chantal Pioch, Alain Couture,
François Desbiens, Paul St-Amand, Chantal Cusson, Lise Dubé, and Annie
Vienney assisted us in different parts of the project.
We thank Véronique Déry, Marie-Dominique Beaulieu, Robert Aubin, Lysane
St-Amour, Marie-Pascale Pomey, Suzette Poliquin (Agence d’évaluation des
technologies et des modes d’intervention en santé du Québec), Mary Nix
(Agency for Healthcare Research and Quality), Jean-Frédéric Levesque
(Université de Montréal), and Jeannie Haggerty (McGill University) for their
comments on the intervention and help in the identification of existing
quality indicators. Jean-Frédéric Gauvin (INSPQ) and Julia Abelson (McMaster
University) kindly agreed to share an unpublished version of their
questionnaire on deliberation evaluation. Reinier Akkermans (IQ Healthcare)
provided useful statistical advice in relation with the analysis of cluster data.
We would finally like to thank public representatives, clinicians, and
managers from the six participating sites of Abitibi-Témiscamingue for their
enthusiasm in supporting this project. We would also like to thank Dr
Laurent Marcoux, his team from the Agence de la Santé et des Services
Sociaux de Lanaudière, and all participants in the pilot meetings held in
Joliette.
Endnotes
1. We carried out two searches in the National Quality Measure
Clearinghouse for indicators published between 2005 and 2010. The first
search looked at all quality indicators listed under the domains ‘Access’ and
‘Structure’. The second used the MeSH terms ‘cardiovascular disease’,
‘diabetes mellitus’, and ‘lung diseases, obstructive’ with the filter terms (Care
setting: Ambulatory care OR Community health care) AND (IOM care needs:
Living with illness OR Staying healthy).
2. The search strategy was developed by two information specialists from
the Québec Agence d’Évaluation des Technologies et des modes
d’intervention en santé (AETMIS) for literature published between 2007 and
2010, using the keywords quality indicators/measures, per formance
indicators/measures, chronic diseases, diabetes, ischeamic heart disease, and
heart failure. References without an abstract were excluded.
Author details
1
Scientific Institute for Quality of Healthcare, Radboud University Nijmegen
Medical Centre, Nijmegen, The Netherlands.
2
Agence de la santé et des
services sociaux de l’Abitibi-Témiscamingue, Rouyn-Noranda, Canada.
3
Department of Health Administration, Institute of Public Health Research of
University of Montreal (IRSPUM), Montreal, Canada.
4
Département des
sciences de la santé, Université du Québec en Abitibi-Témiscamingue,
Rouyn-Noranda, Canada.
Authors’ contributions
AB, PL, RL, JB, and RG designed the study. AL contributed to the
development of the research questionnaires and the statistical analysis plan.
All authors revised the protocol critically for important intellectual content
and approved its final version for publication.
Declaration of competing interests
The authors declare that they have no competing interests.
Received: 22 January 2011 Accepted: 9 May 2011 Published: 9 May 2011
References
1. Braspenning J, Campbell S, Grol R: Measuring changes in patient care:
development and use of indicators. In Improving patient care: the
implementation of change in clinical practice. Volume iv. Edited by: Grol R,
Wensing M, Eccles M. New York City: Elsevier Butterworth Heinemann;
2005:290.
2. Campbell SM, Roland MO, Quayle JA, Buetow SA, Shekelle PG: Quality
indicators for general practice: which ones can general practitioners and
health authority managers agree are important and how useful are
they? J Public Health 1998, 20:414-421.
3. Campbell SM, Roland MO, Buetow SA: Defining quality of care. Soc Sci
Med 2000, 51:1611-1625.
4. Wensing M, Grol R, van Montfort P, Smits A: Indicators of the quality of
general practice care of patients with chronic illness: a step towards the
real involvement of patients in the assessment of the quality of care.
Qual Health Care 1996, 5:73-80.
5. Gagliardi AR, Lemieux-Charles L, Brown AD, Sullivan T, Goel V: Barriers to
patient involvement in health service planning and evaluation: An
exploratory study. Patient Education and Counseling 2008, 70:234-241.
6. de Koning J, Burgers J, Klazinga N: Appraisal of Indicators through
Research and Evaluation (AIRE). Amsterdam; 2007.
7. Reiter A, Fischer B, Kotting J, Geraedts M, Jackel WH, Barlag H, Dobler K:
QUALIFY: Instrument for the Assessment of Quality Indicators.
Dusseldorf: Bundes Geschafts Stelle Qualitats Sicherung; 2007.
8. Freeman T: Using performance indicators to improve health care quality
in the public sector: a review of the literature. Health Services
Management Research 2002, 15:126.
9. Dawda P, Jankins R, Varnam R: Quality improvement in general practice.
London: The King’s Fund; 2010, 30, pp. 30
10. Nolte E, McKee M: Caring for people with chronic conditions: A health system
perspective London: European Observatory on Health Systems and Policies;
2008.
11. Wagner EH, Austin BT, Davis C, Hindmarsh M, Schaefer J, Bonomi A:
Improving Chronic Illness Care: Translating Evidence Into Action. Health
Aff 2001, 20:64-78.
12. Boivin A, Currie K, Fervers Ba, Gracia J, James M, Marshall C, Sakala C,
Sanger S, Strid J, Thomas V, et al: Patient and public involvement in
clinical guidelines: international experiences and future perspectives.
Qual Saf Health Care 2010, 19:e22.
13. Abelson J, Forest PG, Eyles J, Smith P, Martin E, Gauvin FP: Deliberations
about deliberative methods: issues in the design and evaluation of
public participation processes. Soc Sci Med 2003, 57:239-251.
14. Mitton C, Smith N, Peacock S, Evoy B, Abelson J: Public participation in
health care priority setting: A scoping review. Health Policy 2009,
91:219-228.
15. Oliver S, Clarke-Jones L, Rees R, Milne R, Buchanan P, Gabbay J, Gyte G,
Oakley A, Stein K: Involving consumers in research and development
agenda setting for the NHS: developing an evidence-based approach.
Health Technology Assessment 2004, 8:1-148.
16. Lehoux P: The problem of health technology: policy implications for modern
health care systems London:
Routledge; 2006.
17. Lehoux P, Daudelin G, Demers-Payette O, Boivin A: Fostering deliberations
about health innovation: What do we want to know from publics? Soc
Sci Med 2009, 68:2002-2009.
18. Schunemann HJ, Fretheim A, Oxman AD: Improving the use of research
evidence in guideline development: 10. Integrating values and
consumer involvement. Health Res Policy Syst 2006, 4:22.
19. Davies C, Wetherell M, Barnett E: Citizens at the Centre: Deliberative
Participation in Healthcare Decisions Bristol: Policy Press; 2006.
20. Rowe G, Frewer LJ: A Typology of Public Engagement Mechanisms.
Science, Technology & Human Values 2005, 30:251.
21. Hibbard JH, Harris-Kojetin L, Mullin P, Lubalin J, Garfinkel S: Increasing the
impact of health plan report cards by addressing consumers’ concerns.
Health Aff 2000, 19:138-143.
22. Schneider EC, Epstein AM: Use of Public Performance Reports: A Survey
of Patients Undergoing Cardiac Surgery. JAMA 1998, 279:1638-1642.
23. Reilly T, Meyer G, Zema C, Crofton C, Larson D, Darby C, Crosson K:
Providing performance information for consumers: experience from the
United States. Measuring up: improving health system performance in OECD
countries Paris: OECD; 2002, 97-116.
24. O’Connor AM, Bennett CL, Stacey D, Barry M, Col NF, Eden KB, Entwistle VA,
Fiset V, Holmes-Rovner M, Khangura S, et al: Decision aids for people
facing health treatment or screening decisions. Cochrane Database Syst
Rev 2009, CD001431.
25. Elwyn G, Buetow S, Hibbard J, Wensing M: Measuring quality through
performance. Respecting the subjective: quality measurement from the
patient’s perspective. BMJ 2007, 335:1021-1022.
Boivin et al . Implementation Science 2011, 6:45
/>Page 13 of 15
26. Wensing M, Jung HP, Mainz J, Olesen F, Grol R: A systematic review of the
literature on patient priorities for general practice care. Part 1:
Description of the research domain. Soc Sci Med 1998, 47:1573-1588.
27. Wensing M, Elwyn G: Research on patients’ views in the evaluation
and improvement of quality of care. Qua l Saf Health Care 2002,
11:153-157.
28. Grol R, Wensing M, Mainz J, Jung HP, Ferreira P, Hearnshaw H, Hjortdahl P,
Olesen F, Reis S, Ribacke M, Szecsenyi J: Patients in Europe evaluate
general practice care: an international comparison. Br J Gen Pract 2000,
50:882-887.
29. Glasgow RE, Wagner EH, Schaefer J, Mahoney LD, Reid RJ, Greene SM:
Development and validation of the Patient Assessment of Chronic
Illness Care (PACIC). Med Care 2005, 43:436-444.
30. Schoen C, Osborn R, How SK, Doty MM, Peugh J: In chronic condition:
experiences of patients with complex health care needs, in eight
countries, 2008. Health Aff (Millwood) 2009, 28:w1-16.
31. Coulter A, Cleary P: Measuring and improving patients’ experiences: how
can we make health care systems work for patients? Measuring up:
improving health system performance in OECD countries Paris: OECD; 2002,
211-224.
32. Jeacocke D, Heller R, Smith J, Anthony D, Williams JS, Dugdale A:
Combining quantitative and qualitative research to engage stakeholders
in developing quality indicators in general practice. Aust Health Rev 2002,
25:12-18.
33. The Commonwealth Fund: First Report and Recommendations of the
Commonwealth Fund’s International Working Group on Quality
Indicators. 2004.
34. Canadian Institute for Health Information: National Consensus Conference
on Population Health Indicators. Ottawa: CIHI; 1999, 7, pp. 7.
35. Haddad S, Roberge D, Pineault R: Comprendre la qualité: en reconnaître
la complexité. Ruptures, revue transdisciplinaire en santé 1997, 4:59-78.
36. Blumenthal D: Quality of Care – What is It?- Part One of Six. N Engl J Med
1996, 335:891-894.
37. Lomas J, Culyer T, McCutcheon C, McAuley L, Law S: Conceptualizing and
Combining Evidence for Health System Guidance. Ottawa: Canadian
Health Services Research Foundation; 2005.
38. Petts J: Barriers to participation and deliberation in risk decisions:
evidence from waste management. J Risk Res 2004, 7:115-133.
39. Bohman J: Public Deliberation: Pluralism, Complexity, and Democracy MIT
Press; 1996.
40. Dowie J: Decision analysis and the evaluation of decision technologies.
Qual Saf Health Care 2001, 10:1-2.
41. Elwyn G, Frosch D, Rollnick S: Dual
equipose shared decision making:
definitions for decision and behaviour support interventions. Implement
Sci (Accepted for publication) 2009.
42. Crawford MJ, Rutter D, Manley C, Weaver T, Bhui K, Fulop N, Tyrer P:
Systematic review of involving patients in the planning and
development of health care. BMJ 2002, 325:1263.
43. Nilsen ES, Myrhaug HT, Johansen M, Oliver S, Oxman AD: Methods of
consumer involvement in developing healthcare policy and research,
clinical practice guidelines and patient information material. Cochrane
Database Syst Rev 2006.
44. Abelson J, Gauvin FP: Assessing the Impacts of Public Participation:
Concepts, Evidence and Policy Implications. Research report P06 Canadian
Policy research Networks; 2006.
45. Legare F, Boivin A, van der Weijden T, Packenham C, Burgers J, St-
Jacques S, Gagnon S: Patient and public involvement in clinical practice
guidelines: a knowledge synthesis of existing programs. Medical Decision
Making 2011.
46. Bellot S, Blanchette L, Collini M, Beaudry A, Grenier V: Tableau de bord de
l’Abitibi-Témiscamingue: Indicateurs et faits saillants. Observatoire de
l’Abitibi-Témiscamingue; 2010.
47. The Québec Health and Social Services System in Brief. [http://www.
msss.gouv.qc.ca/sujets/organisation/ssss_enbref], Accessed on March 23,
2010
48. Racicot MJ: Réflexion sur l’organisation des soins et services pour les
patients atteints de maladies chroniques et leurs proches. Module 1:
modèle d’organisation. (l’Abitibi-Témiscamingue AdSedSSd ed. Rouyn-
Noranda; 2005.
49. A Framework for a Provincial Chronic Disease Prevention Initiative.
[], Accessed on June 15, 2008.
50. Boivin A, Pioch C, Lehoux P: Santé de la population, santé du système:
l’Abitibi-Témiscamingue à l’heure de la lutte aux maladies chroniques.
Rapport d’évaluation d’implantation du modèle régional. Rouyn-Noranda:
Agence de la santé et des services sociaux de l’Abitibi-Témiscamingue;
2010, 52, pp. 52.
51. World Health Organization: Preventing chronic diseases. A vital
investment: WHO global report. Geneva: World Health Organization; 2005,
200, pp. 200.
52. Arah OA, Westert GP, Hurst J, Klazinga NS: A conceptual framework for
the OECD Health Care Quality Indicators Project. Int J Qual Health Care
2006, 18(Suppl 1):5-13.
53. World Health Organization: The world health report 2000 - Health
Systems: Improving Performance. Geneva: WHO; 2000.
54. Institute of Medicine: Crossing the quality chasm: a new health system for the
21st century Washington: National Academy Press; 2001.
55. Canadian Institute for Health Information: Pan-Canadian Primary Health
Care Indicator Development Project. Ottawa; 2006
2.
56.
Donabedian A: Evaluating the quality of medical care. Milbank Quarterly
1966, 44:166-206.
57. National Quality Measures Clearinghouse. [litymeasures.
ahrq.gov], Accessed on December 15, 2009
58. Bodenheimer T, Wagner EH, Grumbach K: Improving Primary Care for
Patients With Chronic Illness. JAMA 2002, 288:1775-1779.
59. Haggerty J, Burge F, Levesque JF, Gass D, Pineault R, Beaulieu MD,
Santor D: Operational definitions of attributes of primary health care:
consensus among Canadian experts. Annals Of Family Medicine 2007,
5:336-344.
60. Canadian Diabetes Association Clinical Practice Guidelines Expert
Committee: Canadian Diabetes Association 2008 Clinical Practice
Guidelines for the Prevention and Management of Diabetes in Canada.
Can J Diabetes 2008, 32(suppl 1):S1-S201.
61. Canadian Thoracic Society: Recommendations for the management of
chronic obstructive pulmonary disease (COPD) 2008 update. Ottawa:
Canadian Thoracic Society; 2008, 2, pp. 2
62. Canadian Cardiovascular Society: Canadian Cardiovascular Society
Consensus Conference Recommendations on Heart Failure: Diagnosis
and Management. 2007, 132, pp. 132.
63. Feig D, Palda V, Lipscombe L, with The Canadian Task Force on Preventive
Health Care: Screening for type 2 diabetes mellitus to prevent vascular
complications: updated recommendations from the Canadian Task Force
on Preventive Health Care. CMAJ 2005, 172:177-180.
64. Hemmelgarn BR, Zarnke KB, Campbell NR, Feldman RD, McKay DW,
McAlister FA, Khan N, Schiffrin EL, Myers MG, Bolli P, et al: The 2004
Canadian Hypertension Education Program recommendations for the
management of hypertension: Part I–Blood pressure measurement,
diagnosis and assessment of risk. Can J Cardiol 2004, 20:31-40.
65. Direction geéneérale de la santeé publique: Programme national de santé
publique 2003-2012, mise à jour 2008. Québec: Ministeère de la Santeé et
des Services sociaux; 2008, 103, pp. 103
66. Pan-Canadian Primary Health Care Indicator Project: Pan-Canadian Primary
Health Care Indicator Labels. Canadian Institute for Health Information;
2006.
67. Safran D, Kosinski M, Tarlov A, Rogers W, Taira D, Lieberman N, Ware J: The
Primary Care Assessment Survey: tests of data quality and measurement
performance. Medical Care 1998, 36:728-739.
68. Campbell M, Fitzpatrick R, Haines A, Kinmonth AL, Sandercock P,
Spiegelhalter D, Tyrer P: Framework for design and evaluation of complex
interventions to improve health. Bmj 2000, 321:694-696.
69. Gauvin FP, Abelson J: Primer on Public Involvement. Taking the pulse
Toronto: Health Council of Canada; 2006.
70. Telford R, Boote JD, Cooper CL: What does it mean to involve consumers
successfully in NHS research? A consensus study. Health Expect 2004,
7:209-220.
71. Slokum N: Participatory
methods toolkit: A practitioner’s manual. King
Baudouin Foundation; 2003.
72. Boivin A, Green J, van der Meulen J, Légaré F, Nolte E: Why consider
patients’ preferences? A discourse analysis of clinical practice guideline
developers. Medical Care 2009, 47:908-915.
73. Eccles M, Grimshaw J, Campbell M, Ramsay C: Research designs for
studies evaluating the effectiveness of change and improvement
strategies. Qual Saf Health Care 2003, 12:47-52.
Boivin et al . Implementation Science 2011, 6:45
/>Page 14 of 15
74. Pencheon D: The Good Indicators Guide: understanding how to use and
choose indicators. London: NHS Institute for Innovation and Improvement;
2007, 1-38, pp. 1-38.
75. McGlynn EA, Asch SM: Developing a clinical performance measure. Am J
Prev Med 1998, 14:14-21.
76. Campbell SM, Braspenning J, Hutchinson A, Marshall MN: Research
methods used in developing and applying quality indicators in primary
care. BMJ 2003, 326:816-819.
77. Research Randomizer v. 4.0. [], Accessed on
April 1st, 2010
78. Murphy E, Dingwall R, Greatbatch D, Parker S, Watson P: Qualitative
Research Methods in Health Technology Assessment Health Technology
Assessment 2 (16). Southampton, National Co-ordinating Centre for Health
Technology Assessment 1998.
79. Burns T, O’Connor D, Stocklmayer S: Science communication: a
contemporary definition. Public Understanding of Science 2003, 12:2.
80. Abelson J, Lomas J, Eyles J, Birch S, Veenstra G: Does the community want
devolved authority? Results of deliberative polling in Ontario. CMAJ:
Canadian Medical Association Journal = Journal De L’association Medicale
Canadienne 1995, 153:403-412.
81. Grilli R, Penna A, Zola P, Liberati A: Physicians’ view of practice guidelines.
A survey of Italian physicians. Social Science & Medicine (1982) 1996,
43:1283-1287.
82. Graham ID, Evans WK, Logan D, O’Connor A, Palda V, McAuley L,
Brouwers M, Harrison MB: Canadian oncologists and clinical practice
guidelines: a national survey of attitudes and reported use. Provincial
Lung Disease Site Group of Cancer Care Ontario. Oncology 2000,
59:283-290.
83. Graham ID, Brouwers M, Davies C, Tetroe J: Ontario doctors’ attitudes
toward and use of clinical practice guidelines in oncology. Journal Of
Evaluation In Clinical Practice 2007, 13:607-615.
84. Saturno P, Palmer R, Gascon J: Physician attitudes, self-estimated
performance and actual compliance with locally peer-defined quality
evaluation criteria. Int J Qual Health Care 1999, 11:487-496.
85. Fickel J, Thrush C: Policymaker use of quality of care information.
International Journal for Quality in Health Care 2005, 17:497.
86. Johnston K, Buxton M, Jones D, Fitzpatrick R: Assessing the costs of
healthcare technologies in clinical trials. Health technology assessment
(Winchester, England) 1999, 3:1.
87. Oakley A, Strange V, Bonell C, Allen E, Stephenson J:
Process evaluation in
randomised controlled trials of complex interventions. Bmj 2006,
332:413-416.
88. Francis J, Eccles M, Johnston M, Whitty P, Grimshaw J, Kaner E, Smith L,
Walker A: Explaining the effects of an intervention designed to promote
evidence-based diabetes care: a theory-based process evaluation of a
pragmatic cluster randomised controlled trial. Implementation Science
2008, 3:50.
89. Lehoux P, Poland B, Daudelin G: Focus group research and “the patient’s
view”. Soc Sci Med 2006, 63:2091-2104.
90. Rowe G, Frewer LJ: Public Participation Methods: A Framework for
Evaluation. Science, Technology & Human Values 2000, 25:3.
91. Webler T: “Right” discourse in citizen participation: An evaluative
yardstick. In Fairness and competence in citizen participation: Evaluating
models for environmental discourse. Edited by: Renn O, T. Webler, P.
Wiedemann. Dordrecht: Kluwer Academic; 1995:.
92. Martin E, Gauvin FP, Abelson J: Evaluating deliberative forums: The case
of the consultation forum of Quebec’s Commissaire à la santé et au
bien-être. Annual conference of the Canadian Association for Health Services
and Policy Research 2009, May 12, 2009; Calgary
93. Donner A, Klar N: Design and analysis of cluster randomization trials in health
research London: Arnold; 2000.
94. Donner A, Klar N: Pitfalls of and Controversies in Cluster Randomization
Trial. Am J Public Health 2004, 94:416-422.
95. Graham ID, Logan J, Harrison MB, Straus SE, Tetroe J, Caswell W,
Robinson N: Lost in knowledge translation: Time for a map? J Contin
Educ Health Prof 2006, 26:13-24.
96. Boivin A: Santé de la population, santé du système: l’Abitibi-
Témiscamingue à l’heure de la lutte aux maladies chroniques.
Commission de la santé et des services sociaux Quebec: Assemblée Nationale
du Québec. 39e legislature, 1ere session; 2010.
97. Gibbons M, Limoges CHN: Introduction. In The New Production of
Knowledge: the Dynamics of Science and Research in Contemporary Societies.
Edited by: al. Ge. London: Sage Publications Ltd; 1994:1-16.
doi:10.1186/1748-5908-6-45
Cite this article as: Boivin et al.: Target for improvement: a cluster
randomised trial of public involvement in quality-indicator prioritisation
(intervention development and study protocol). Implementation Science
2011 6:45.
Submit your next manuscript to BioMed Central
and take full advantage of:
• Convenient online submission
• Thorough peer review
• No space constraints or color figure charges
• Immediate publication on acceptance
• Inclusion in PubMed, CAS, Scopus and Google Scholar
• Research which is freely available for redistribution
Submit your manuscript at
www.biomedcentral.com/submit
Boivin et al . Implementation Science 2011, 6:45
/>Page 15 of 15