Composites Manufacturing - Materials, Product, and Process Engineering Part 12 doc
Bạn đang xem bản rút gọn của tài liệu. Xem và tải ngay bản đầy đủ của tài liệu tại đây (113.57 KB, 2 trang )
© 2002 by CRC Press LLC
The temperature distributions and resin flows were determined by models
using the same cure temperature and pressures as employed during the test.
The results of the models are shown as solid lines in Figures 7.25 to 7.28. It
is evident from the figures that the calculated and measured temperatures
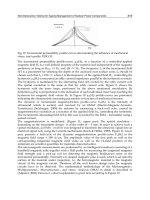
FIGURE 7.25
Theoretical and experimental plots of temperature as a function of time at three positions inside
a 64-ply composite. The temperature cure cycle is shown in Figure 7.29. The cure and bleeder
pressures were constant at 586 kPa (85 psi) and 101 kPa (14.7 psi), respectively. (Reprinted from
Loos, A.C. and Springer, G.S., J. Composite Mater., 17, 135, 1983. With permission from Technomic
Publishing Company.)
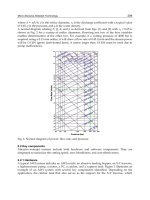
FIGURE 7.26
The mass loss, normal to the tool plate (bottom), parallel to the tool plate (center), and the total
mass loss (top) as a function of time for a 64-ply composite. The temperature cure cycle is
shown in Figure 7.29. The bleeder pressure was constant at 101 kPa (14.7 psi). The initial resin
content was 42%. (Reprinted from Loos, A.C. and Springer, G.S., J. Composite Mater., 17, 135,
1983. With permission from Technomic Publishing Company, Inc.)
© 2002 by CRC Press LLC
The temperature distributions and resin flows were determined by models
using the same cure temperature and pressures as employed during the test.
The results of the models are shown as solid lines in Figures 7.25 to 7.28. It
is evident from the figures that the calculated and measured temperatures
FIGURE 7.25
Theoretical and experimental plots of temperature as a function of time at three positions inside
a 64-ply composite. The temperature cure cycle is shown in Figure 7.29. The cure and bleeder
pressures were constant at 586 kPa (85 psi) and 101 kPa (14.7 psi), respectively. (Reprinted from
Loos, A.C. and Springer, G.S., J. Composite Mater., 17, 135, 1983. With permission from Technomic
Publishing Company.)
FIGURE 7.26
The mass loss, normal to the tool plate (bottom), parallel to the tool plate (center), and the total
mass loss (top) as a function of time for a 64-ply composite. The temperature cure cycle is
shown in Figure 7.29. The bleeder pressure was constant at 101 kPa (14.7 psi). The initial resin
content was 42%. (Reprinted from Loos, A.C. and Springer, G.S., J. Composite Mater., 17, 135,
1983. With permission from Technomic Publishing Company, Inc.)