Conductive Polymers and Plastics in Industrial Applications Part 9 docx
Bạn đang xem bản rút gọn của tài liệu. Xem và tải ngay bản đầy đủ của tài liệu tại đây (386.83 KB, 20 trang )
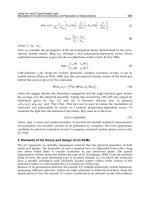
SEM or in the micro-
graph, which indicates
that the polymerization
technique effectively iso-
lated the conductive poly-
mer within the dense
polymer phase. That was
also confirmed by the ab-
sence of marking when
the conductive foams
were rubbed upon a piece
of white paper (neat PPy is black and readily marks paper). The PPy had a granular texture
with a grain size of about 0.5
µ
m. EDAX spectra showed three distinct emission peaks: Si K
α
(2.3 keV), Cl K
α
(2.6 keV) and Fe K
α
(6.4 keV). The Si was due to the surfactant used in prep-
aration of the foam. The strong Cl K
α
peak was mostly due to Cl
-
dopant ions for the PPy and
the weak Fe K
α
peak was either from dopant ions in the form of FeC
l
4
-
or residual FeCl
2
by-
product that was not removed during washing of the product.
THERMAL STABILITY AND MECHANICAL PROPERTIES
TGA thermograms of neat PU foam and the PPy/PU composites were similar between
0-400
o
C, which indicates that the in situ polymerization process did not affect the thermal sta-
bility of the PU foam. The mechanical properties of a 6.0 % PPy/PU composite and the parent
PU foam are compared in Table 1. Although, the mechanical data are limited, they do demon-
strate that incorporation of low concentrations of PPy into the foam was not deleterious to the
foam mechanical properties. In addition, the resilience of the composite foam was qualita-
tively similar to that of the neat PU foam.
CONCLUSIONS
A process was developed for producing conductive elastomeric foams by polymerizing con-
ductive polypyrrole or copolymers of pyrrole and N-methyl pyrrole in the cell walls and struts
of a preformed polyurethane foam. The process consisted of first diffusing an oxidant into the
dense polymer phase of a solvent-swollen foam and then diffusing a vapor of pyrrole and
N-methyl pyrrole into the dried foam. An in situ chemical oxidative polymerization of con-
ductive polymer or copolymer occurred where the oxidant was present. Because the conduc-
tive polymer was confined to the dense polymer phase, conductivity of the foam composites
was achieved at relatively low concentrations of the conductive polymer concentration, ca. 5
wt%. The conductivity of the composite foam was reproducibly controlled between 10
-7
-10
-1
Conductive Elastomer Foams 165
Table 1. Comparison of mechanical properties of PU
and PPy/PU foams
Properties PU 6.0% PPy/PU
Tensile strength, 10
5
N/m
2
8.1 8.3
Elongation at break, % 143 160
Tear strength, 10
3
N/m 1.8 3.2
Compression set, % 3.5 3.7
Conductivity, S/cm <10
-10
10
-5
S/cm by varying either the amount of oxidant used, which controls the amount of conductive
polymer produced, and/or the copolymer composition. The conductivity decreases as the
concentration of N-methyl pyrrole in the copolymer increases. Preliminary experiments us-
ing ferric tosylate as the oxidant and dopant suggested that 1-2 orders of magnitude greater
conductivity could be attained at an equivalent PPy concentration compared with using
FeCl
3
.
ACKNOWLEDGMENT
We gratefully acknowledge financial support from Connecticut Innovations, Inc.
REFERENCES
1 D.Moon, A. B. Padias, H. K. Hall, T. Huntoon and P. D. Calvert, Macromolecules, 28, 6205 (1995).
2 H. Masuda, S. Tanaka and K. Kaeriyama, J. Polym. Sci., Polym. Chem. Ed., 28, 1831 (1990).
3 T Kim and R. L. Elsenbaumer, Synth. Met., 84(13), 157 (1997).
4 M. Ribo, M. C. Anglada, J. M. Tura and N. Ferrer-Anglada, Synth. Met., 72, 173 ( 1995).
5 M. Salmon, A. F. Diaz, A. J. Logan, M. Krounbi and J. Bargon, Mol. Cryst. Liq. Cryst., 83, 265 (1982).
6 K. K. Kanazawa, A. F. Diaz, M. T. Krounbi and G. B. Street, Synth. Met., 4, 119 (1981).
7 J. R. Reynolds, P. A. Poropatic and R. L. Toyooka, Macromolecules, 20, 958 (1987).
8 M. S. Kiani and G. R. Mitchell, Synth. Met., 46, 293 (1992).
9 P. Novak and W. Vielstich, J. Electroanal. Chem., 300, 99 (1991).
10 M. Nishizawa, T. Sawaguchi, T. Matsue, and 1. Uchida, Synth. Met., 45, 241 (1991).
11 M. C. DeJesus, Y. Fu and R. A. Weiss, Polym. Eng. Sci., in press.
12 H. Scher and R. J. Zallen, J. Chem. Phys., 53, 3759 (1970).
166 Conductive Polymers and Plastics
Neocapacitor. New Tantalum Capacitor with
Conducting Polymer
Atsushi Kobayashi, Yoshihiko Saiki
Energy Devices Division, NEC Corporation
Kazuo Watanabe
NEC Toyama Ltd.
INTRODUCTION
Electrolytic capacitors have been widely used in various circuits as one of the key electronic
components. There are two electrolytic capacitors: aluminum capacitors and tantalum capac-
itors. Aluminum capacitors are the most common capacitors today because they are inexpen-
sive. The other electrolytic capacitor is tantalum capacitor. It has many advantages over
aluminum capacitors: chemically stable Ta
2
O
5
as dielectric film, superior temperature char-
acteristics, lower leakage current and excellent volume efficiency. Therefore, tantalum ca-
pacitors have been widely used in highly reliable equipment and portable electronic
equipment.
In the last decade, portable electronic equipment has been miniaturized and its energy
consumption has been lowered remarkably. This requires much lower noise on power supply
line of electronic equipment and lower ESR on capacitors in the line. To meet this demand,
NEC has recently developed new tantalum capacitor, NEOCAPACITOR,
1
which uses PPy as
its electrolyte (Figure 1). Because of much higher electrical conductivity than that of MnO
2
,
which is used in conventional tantalum capacitors, PPy provides lower ESR to
NEOCAPACITOR (Figure 2). Moreover, thermally degrading property at over 300
o
C pro-
vides healing function to the new capacitor. If a micro defect exists on the dielectric, the
current flows at this point. This current generates heat and the heat degrades PPy at the point.
Therefore, insulated polymer stops current flow and prevents the capacitor from
short-circuiting. In fact, the decrease in leakage current in load life tests has been observed for
the new capacitor. This is thought as one of examples of healing function of conducting poly-
mer.
However, clearer results and mechanism for the healing function have not shown yet.
This paper provides ripple current loading tests and the GC-MS analysis of the polymer.
EXPERIMENT
100uF/10V NEOCAPACITOR (Part No. PSMD1A107M) and R series (Part No.
NRD107M010) were examined. They were applied with 10 kHz sign wave ripple voltage.
The ripple voltage was generated by Yokogawa Synthesized Function Generator FC110, am-
plified by Yokogawa Power Amplifier 7058, and monitored with Yokogawa Digital Oscillo-
scope DL1100. The values of voltage were 1.0, 2.0, 3.0, 3.5 and 4.0V (peak to peak). The
temperatures of capacitors were monitored by the thermocouple on the surface of samples.
There is no heat-sinking material on the capacitors.
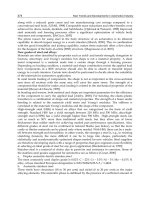
RESULTS
Figure 3 shows the surface temperature of NEOCAPACITOR ripple voltages were applied.
The temperature gradually increased and approached the constant values within 100 seconds
when ripple voltages were 1.0, 2.0 and 3.0 V. However, the constant value and equilibrium
time became larger according to the ripple voltage. In case of 3.5 V, the temperature rapidly
increased to 160
o
C in the first 30 seconds but remarkably decreased and reached the constant
168 Conductive Polymers and Plastics
Figure 1. Structure of NEOCAPACITOR. Figure 2. Typical ESR curve for NEOCAPACITOR and
conventional tantalum capacitor. (a) NEOCAPACITOR and (b)
conventional tantalum capacitor.
value around 100
o
C. Similar result was observed for 4.0 V. The temperature reached 350
o
C
and it rapidly decreased to 100
o
C within 50 seconds.
The surface temperatures of conventional capacitors were similar (Figure 4) when the
voltages were 1.0 and 2.0 V. The temperature increased gradually and reached the plateau.
However, the plateau values for conventional ones were higher than that of
NEOCAPACITOR. Moreover, 3.0, 3.5 and 4.0 V ripple voltages significantly increased the
temperature and destroyed capacitors catastrophically.
DISCUSSION
As widely know, heat generated by ripple voltages is proportional to square ESR and ripple
voltage. The results in the Figure 3 and Figure 4 show the difference in the healing ability.
MnO
2
is known that it is decomposed to insulating Mn
2
O
3
at over 520
o
C. However, this tem-
perature is much higher than that of PPy. Its insulating temperature is 300
o
C or over. There-
fore, PPy has superior healing function than MnO
2
. However, the process of insulation of PPy
has not clearly shown yet. To clarify this process, mass spectrometry (MS) of PPy was mea-
sured over the range of m/z from 29 to 650, on a VG-TR10-01 instrument equipped with
hand-made temperature controller for the gasses generated from the samples at elevated tem-
perature. PPy has been synthesized as in the literature.
2
Initial temperature was 50
o
C and the
Neocapacitor. New Tantalum Capacitor 169
Figure 3. Surface temperature of 10 kHz ripple voltages
applied to NEOCAPACITOR. (a) 1.0 V, (b) 2.0 V, (c) 3.0 V,
(d) 3.5 V, and (e) 4.0 V.
Figure 4. Surface temperature of 10 kHz ripple voltages applied
to conventional tantalum capacitor. (a) 1.0 V, (b) 2.0 V, (c) 3.0
V, (d) 3.5 V, and (e) 4.0 V.
temperature was increased by 10
o
C/min.
The generated gasses were also analyzed by
gas chromatography-mass spectrometry
(GC-MS). Figure 5 shows the results of total
ion chromatography (TIC) for GC-MS of
PPy. There are a clear peak at 480
o
C and a
shoulder peak at 380
o
C. Figure 6 and 7
shows the mass spectrum of the peaks at
380
o
C and 480
o
C, respectively. Since PPy
was doped with sulfonic compound anion,
the 48 and 64 m/z in the Figure 6 would be
SO and SO
2
. In Figure 7, these two are also
observed. Moreover, pyrrole, which molecu-
lar weight is 67, is detected in Figure 7.
These results support that heating PPy de-
composes doped anion consisting of sulfonic
compound at around 380
o
C and then poly-
mer backbone at around 480
o
C.
170 Conductive Polymers and Plastics
Figure 5. TIC for GC-MS of PPy. Figure 6. Mass spectrum of PPy at 380
o
C.
figure 7. Mass spectrum of PPy at 480
o
C.
CONCLUSIONS
NEOCAPACITOR has superior self-healing function than that of conventional tantalum ca-
pacitor. This function comes from insulation of PPy through two-step decomposition. At first,
doped anion and then the polymer backbone are decomposed.
ACKNOWLEDGMENT
The authors wish to express appreciation to Dr. Masaharu Satoh, Principal Researcher, Func-
tional Devices Laboratories, NEC for GC-MS analysis.
REFERENCES
1 Atsushi Kobayashi, et al., Denshi Tokyo, 33, 153-157, 1994.
2 Masaharu Satoh, et al., Synthetic Metals, 72, 98-105, 1996
.
Neocapacitor. New Tantalum Capacitor 171
Conductive Polymer-Based Transducers as
Vapor-Phase Detectors
Frederick G. Yamagishi, Thomas B. Stanford, Camille I. van Ast, Paul O. Braatz and
Leroy J. Miller
Hughes Research Laboratories, 3011 Malibu Canyon Road, Malibu, CA 90265
Harold C. Gilbert
Hughes Aircraft Company Naval and Maritime Systems Business Unit, 1901 W. Malvern
Avenue, Fullerton, CA 92634
INTRODUCTION
Conductive polymers have been reported as the active transducer in a number of chemical
sensors. They have been used to demonstrate the detection of materials in the vapor state,
1-3
or
in aqueous solutions.
4,5
Further, conductive polymer sensors have been reported to detect acid
and/or water in nonaqueous and nonpolar media.
6,7
We have developed conductive poly-
mer-based transducers for the detection of volatile organic compounds (VOCs) and other gas-
eous pollutants for application in environmental monitoring.
8,9
Our development was through two approaches: 1) to use a composite of two components
where one is an attractant material which detects the presence of the substance of interest, and
the other is a conductive material to carry the electrical current to the associated electronics,
and 2) to vary the counterion associated with the oxidized form of the conductive polymer. In
each approach it was felt that one of the components in the transducer (i.e., the attractant poly-
mer or the counterion) would selectively absorb the pollutant of interest while having less
attraction for other vapors. With the associated electronics, these sensors are components of a
multi-sensor array capable of VOC speciation.
Polyaniline (PANI) and derivatives of polythiophene were chosen as the conductive
polymers for these transducers. We believe that the detection of certain chemically inactive
pollutants (i.e., those pollutants incapable of oxidizing or reducing the conductive polymer) is
a result of a structural perturbation in the conductive polymer caused either by a direct inter-
action of the conductive polymer with the pollutant, or because of a structural change in the
attractant polymer in which the conductive polymer is embedded (e.g., polymer swelling).
It was also found that appropriate combinations of silane surface coupling agents, sur-
factants, conductive polymer counterions and employing advanced signal processing
techniques, sensitivity thresholds of <10 ppm were observed. This combination of transducer
components also enhanced the stability and reversibility of these sensors.
EXPERIMENTAL
The sensors were prepared by coating a set of gold interdigitated electrodes with a conductive
polymer or a conductive composite film of sufficient thickness to bridge the gap between the
sets of digits. The conductivity (or more properly the current flow) was determined by apply-
ing a small voltage across the digits (generally 0.200 VDC) and measuring the current.
PANI was prepared both chemically and electrochemically with various conjugate bases
(counterions) derived from various acids. The poly(3-alkylthiophenes) were used undoped or
doped with anhydrous ferric chloride.
Since some of the conductive polymers used in these tests were not soluble in common
organic solvents, cast films were prepared from slurries containing the conductive polymer
which has been mixed with a solution of the attractant polymer (e.g., polyisobutylene, PIB) in
an appropriate solvent such as N-methylpyrrolidinone. In cases where the conductive poly-
mer was soluble, films were spin-coated from xylene or chloroform solutions.
In some cases, a thin film of a silane coupling agent (e.g., octadecyltrichlorosilane,
ODTCS; methacryloxypropyltrimethoxysilane, MTS; or phenylaminopropyltrimeth-
oxysilane, Sylquest Y-9669) was deposited by dip or spin coating from solutions ranging in
concentration from 0.1% to 1%. These films were baked for about 30 min at 120°C and were
spin coated with solutions containing soluble PANI complexed with dodecylbenzenesulfonic
acid (DBSA). Poly(3-hexylthiophene) (PHT) doped with FeCl
3
or with undoped regioregular
PHT (Rieke Metals, Inc.) were also tested but without silane coupling agent undercoating. In
some cases the PANI•DBSA solutions contained a one-to two-part excess of DBSA. Thick-
ness of these composite films was about 500Å.
Sensor testing was done in three different ways: 1) exposure of the sensor in the
headspace above the challenge vapor at room temperature; 2) exposure of the sensor to quan-
tities of the challenge vapor in a closed system of known volume; and 3) exposure of the
sensor to known quantities of challenge vapor diluted with air or nitrogen at constant humid-
ity, flow and temperature. Thus, measurements were taken at concentrations levels ranging
from sub-ppm levels to several percent. Signal processing was done by data detrending and
principal component analysis.
174 Conductive Polymers and Plastics
RESULTS AND DISCUSSION
SENSITIVITY OF TRANSDUCERS TO CHALLENGE VAPORS
Figure of Merit
For a given test run the sensors were exposed sequentially to increasing concentrations of
challenge vapor under flow conditions. In the process of this test data was collected as the cur-
rent response of the sensor versus the total elapsed time of the run. In certain cases, such as the
example shown in Figure 1, the data appeared well-behaved, and could be displayed in a man-
ner that would be expected. However, since each exposure has a different starting baseline, it
is difficult to compare the response of the sensor as a function of concentration. We therefore
developed a figure of merit (FOM) based on the slope of the response curve, which was plot-
ted as the sensor response versus dosage [(concentration) (time)].
A plot of normalized sensor response versus dosage yielded generally a straight line
whose slope is proportional to the response time of the sensor and its sensitivity toward the
challenge gas at that concentration. An example of this type of data treatment is shown in Fig-
ure 2. In this case, NO
2
is detected rapidly by the sensor and the response is effectively
immediate. The slope of this line is the FOM for sensors that showed such a first order de-
pendence.
Conductive Polymer-Based Transducers 175
Figure 1. Sensor response vs. time for electrochemically-
prepared PANI•TSA, 10.4
µ
m thick, NO
2
.
Figure 2. Figure of merit (FOM) derived from the normalized
response of a PANI•TSA sensor to 14 ppm of NO
2
.
Nitrogen Dioxide
Of the challenge vapors tested, NO
2
showed the greatest and broadest response under a vari-
ety of test conditions, and varying physical characteristics of the transducer. Sensors derived
from polyaniline complexed with p-toluenesulfonic acid (PANI
•
TSA) were the most sensi-
tive but other sulfonic acid conjugate bases were also very effective. From FOM results, the
following observations could be summarized:
• Very high sensitivity to NO
2
concentrations of <140 ppb are detectable;
• Generally, electrochemically-prepared films are more sensitive than cast films, but
the cast composite films also respond, and in fact the highest sensitivity was ob-
served with a cast composite film of PANI
•
TSA in PIB Cast films of PANI with
any of the counterions were generally not sensitive;
We suspect that NO
2
is interacting chemically with the transducer, either the polyaniline
backbone, or the counterion. If the former is true than the electron withdrawing nature of the
NO
2
moiety would significantly modify the band structure of the conductive polymer and
would account for the remarkable sensitivity. If the latter is true, the spatial distribution of the
counterion would be expected to be significantly modified which would affect the morphol-
ogy of the conducting chain and modulate the conductivity. Also, the conductivity of the
sensor did not return to its original value following the removal of NO
2
vapor around the sen-
sor. This further suggests that the structure of the conductive polymer has been chemically
modified to one that has a different physical and electronic structure than the original mate-
rial.
SILANE COUPLING AGENTS
During the course of this work a need to monitor ketones, esters and aromatic hydrocarbons
was defined with concentration levels between 100 ppm to about 1 ppm.
The sensor elements described above were found to be inadequate to meet this need.
However, initial testing of sensors composed of PANI complexed with DBSA or
polythiophene suggested that these materials showed promise. Further, we found that films
composed of PANI
•
DBSA which contained excess DBSA were much more sensitive to these
target challenge vapors than PANI
•
DBSA alone. However, this new composition lacked long
term stability necessary for the desired application.
In an effort to change the surface free energy of the glass substrate surface we coated the
interdigitated electrode substrate with three different silanes [e.g., octadecyltrichlorosilane,
ODTCS (nonpolar), methacryloxypropyltrimethoxysilane (somewhat polar) and
phenylaminopropyltrimethoxysilane, Sylquest Y-9669 (more polar)]. It was anticipated that
these agents would enhance the adhesion of the conductive polymer film to the substrate and
thereby increase long term stability of the composite. It was found that uniform films of PANI
176 Conductive Polymers and Plastics
•
DBSA, which is partially charged and
therefore slightly polar, could only be pre-
pared on surfaces treated with ODTCS.
Substrates treated with the more polar agents
MTS and Sylquest Y9669 yielded
PANI
•
DBSA films that were usable for fur-
ther testing but were not nearly as uniform.
PANI
•
DBSA sensors prepared with very
thin films of silane agents showed essen-
tially the same properties as sensors
prepared without the surface treatment.
However, when thicker coupling agent films
were deposited (from higher concentration
solutions) followed by
depositing a
PANI
•
DBSA layer,
high sensitivity to tolu-
ene was observed, with
rapid return to the orig-
inal baseline following
removal of the chal-
lenge vapor. Figure 3
shows the response of
the sensors, listed in
Table 1, tested against
varying concentrations
of methyl isoamyl
ketone. Sensitivities of
<52 ppm are demon-
strated routinely. Later
results have shown that
this sensitivity thresh-
old is actually well below 10 ppm for methyl isoamyl ketone and butyl acetate.
The roles of the excess DBSA on the sensitivity and of ODTCS on the reversibility and
stability are unknown at this time. However, since the mechanism of detection relies on the
physical movement of the conductive polymer morphology, we hypothesize that these excess
agents provide a “mobile” phase which facilitates this change in morphology during exposure
Conductive Polymer-Based Transducers 177
Figure 3. Array response to methyl isoamyl ketone at various
concentrations (20% relative humidity).
Table 1. Summary of sensor devices
Sensor
number
Conductive
polymer
Surfactant/
attractant
Dopant
Preparation
method
1 PANI-DBSA DBSA DBSA Spin coated
2 PANI-DBSA HDSA DBSA Spin coated
3 PHT (NR) None FeCl3 Cast
4 PHT (NR) PiB FeCl3 Cast
5 PHT (Rieke) None None Spin coated
6 PANI-dNNSA Bu Cellos EtOH Spin coated
7 PANI-dNNSA Bu Cellos 2-MeOEtOH Spin coated
8 PANI-H2SO4 None H2SO4 E-Chem
9 PANI-DBSA 2DBSA DBSA Spin coated
HDSA - hexadecanesulfonic acid, NR - nonregioregular, Rieke - from Rieke Metals Co.,
regioregular material, dNNSA - dinonylnaphthelenesulfonic acid (PANI-dNNA obtained
from Monsanto Co.), PiB - polyisobutylene, Bu Cellos - butyl cellosolve, E-Chem - film
deposited electrochemically
to the challenge vapor and allows it to relax back to its original structure once the challenge is
removed.
SIGNAL PROCESSING OF SENSOR ARRAYS
In an effort to determine whether our sensors could classify VOC vapors, an array of
nine sensors were exposed to each of the vapors of interest at 2 L/min in concentrations rang-
ing from about 500 ppm to about 1 ppm at 20
o
C and relative humidities of 0.2% to 20%. The
active transducers were PANI and PHT with varying counterions, and they were combined
with various attractant materials, as shown in Table 1. It was found that each of the nine sen-
sors showed a characteristic response to each vapor. Thus a characteristic signature for that
vapor could be generated for that particular array of sensors, as shown in Figure 3.
The sensor response for each individual run to each test condition was analyzed. The raw
data was processed to remove obvious bogus data points (outliers) and the resulting data set
was normalized with respect to their magnitude. This data set was detrended (removal of
background noise) with a simple FIR high-pass filter designed to preserve the frequency
components of signal energy while attenuating the low frequency drift in sensor response.
Application of this processing technique allowed for the observation of low challenge levels,
whereas the raw data appears almost non-variant. An example of the sensitivity of one sensor
178 Conductive Polymers and Plastics
Figure 4. Raw and detrended data for a PANI•DBSA sensor
exposed to methyl isoamyl ketone between 8.2 and 0.9 ppm at
20% relative humidity.
Figure 5. VOC Principal Component Linear Classifier at 20%
RH.
to about 8 ppm of MIAK is shown in Figure 4, where both the raw data and detrended data are
shown superimposed. Exposures down to 0.9 ppm were also done in this run, but the re-
sponses were largely obscured by systematic noise. Principal component analysis, as shown
in Figure 5, done on data from these array tests demonstrate that the three classes of VOC
challenge vapors can be speciated clearly.
CONCLUSIONS
Highly sensitive sensor elements derived from PANI were demonstrated for NO
2
and other
VOCs. A figure of merit was defined to allow comparison of the response of different sensors
to particular challenge vapors at various concentrations. The use of excess silane coupling
agents to modify the surface of our sensor substrates in combination with excess of a sulfonic
acid used to convert PANI to its conductive state results in highly sensitive, stable and revers-
ible VOC sensors, along with some polythiophene derivatives, for the detection of ketones,
esters and aromatic hydrocarbons. The role of these excess materials is not known at this
time, but they may act synergistically to attract VOCs and provide a medium in which the
morphology of the conductive polymer chains can be more easily modified. This explanation
would account for the increased sensitivity with excess DBSA and for the enhanced revers-
ibility with ODTCS. Individual sensors show different sensitivities to each class of VOC used
in this study so that an array of these sensors generated a characteristic signature for each
class demonstrating selectivity and classification. These effects can be clearly extracted from
the raw data using signal processing techniques.
ACKNOWLEDGMENTS
The authors gratefully acknowledge Mr. L.A. Schatzmann and Dr. J.A. Wurzbach of the Na-
val and Maritime Systems Division of Hughes Aircraft Company, Prof. Alan G. MacDiarmid
of the University of Pennsylvania, Dr. Anthony Guiseppi-Elie of ABTECH Scientific for
helpful discussions, Ms. A.M. Lackner and Ms. E. Sherman for assistance in data manipula-
tion, Dr. S.M. Flank, Mr. E.M. Carapezza and Dr. I. Skurnick of DARPA, Drs. D.L. Venezky
and S.L. Rose-Pehrsson of the Naval Research Laboratory, Dr. Harold Guard of the Office of
Naval Research and Mr. E.M. Monachino of Science and Technology Associates for assis-
tance in contract monitoring. This work was partially supported by DARPA/NRL under Con-
tract No. N66001-94-C-6028 and by DARPA/ONR Technology Reinvestment Project under
Agreement No. N00014-95-2-0008.
REFERENCES
1 P.N. Bartlett, P.B.M. Archer and S.K. Ling-Chung, Sensors and Actuators, 19, 125 (1989).
2 P.N. Bartlett and S.K. Ling-Chung, Ibid., 19, 141 (1989).
Conductive Polymer-Based Transducers 179
3 P.N. Bartlett and S.K. Ling-Chung, Ibid., 20, 287 (1989).
4 A. Boyle, E.M. Genies and M. Lapkowski, Synth. Met., 28, C769 (1989).
5 L.D. Couves and S.J. Porter, Ibid., 28, C761 (1989).
6 F.G. Yamagishi, L.J. Miller and C.I. van Ast, Proc. of the Amer. Chem. Soc. Div. of Polym. Mater.: Sci. and Engineering,
Symp. on Transducer-Active Polymers: Components in Sensors and Actuators, Washington DC, 71, 656, August 21-26,
1994.
7 F.G. Yamagishi, L.J. Miller and C.I. van Ast, Proc. Sensors Expo, Symp. on New Innovations in Automotive Sensors,
Cleveland, OH, 509, September 20- 22, 1994.
8 F.G. Yamagishi, J. Stanford, Thomas B., C.I. van Ast, L.J. Miller and H.C. Gilbert, Proc. of the Symp. on Chemical and
Biological Sensors and Analytical Electrochemical Methods, 1997 Joint International Meeting of the Electrochem. Soc.
and The Intern. Soc. of Electrochem., 97-19, 103, August 31 - September 5, 1997.
9 F.G. Yamagishi, T.B. Stanford, C.I. van Ast and L.J. Miller, Abs. of the Electrochem. Soc., San Antonio, TX, 96-2, 1151,
October 6-11, 1996.
180 Conductive Polymers and Plastics
Conductive Polyphenylene Ether/Polyamide Blends
For Electrostatic Painting Applications
J.J. Scobbo, Jr.
INTRODUCTION
Electrostatic painting provides numerous advantages over traditional high pressure, low vol-
ume paint processes. These include improved paint transfer efficiency, which translates into
lower paint usage. This can prove to be an important economic incentive when one considers
that exterior automotive finishes can often cost in excess of $100/gallon.
Electrostatic painting requires that the part which is to be painted is electrically
grounded. This is not an issue when one is painting metallic parts. However, many of the au-
tomotive exterior trim components are made of engineering resins, which are electrical
insulators. In order to take advantage of the efficiencies of electrostatic painting, a plastic part
must first be sprayed with a coating of a conductive primer. The particulate metallic constitu-
ents of the coating allow it to be grounded, thereby allowing for electrostatic base coat and
clear coat deposition. Even with the additional step of conductive priming, there are signifi-
cant incentives in terms of economics and surface quality/consistency, for electrostatic
painting of plastics to be desirable.
An ideal electrostatic painting situation would be to combine the benefits of engineering
resins (such as the ability to form parts of complex geometry, economically through injection
molding), with the benefits of metallic parts (intrinsic conductivity, precluding the need to
deal with a conductive priming step). The solution would be to make an intrinsically conduc-
tive thermoplastic resin, that could be injection molded, and would maintain a
physical/mechanical performance profile similar to other engineering resins used for the ap-
plication in question.
To this end, a polyphenylene ether/polyamide engineering resin blend has been recently
introduced and is currently in use for electrostatically painted mirror shells. The resin makes
use of a graphite nanotube additive to provide sufficient conductivity to allow for electrostatic
painting.
1,2
This paper will discuss the
base resin, the benefits of the conduc-
tive additive, and impact on the painting
process.
ELECTROSTATIC PAINTING
There are significant advantages to
electrostatic painting over traditional
paint processes, and even further ad-
vantages to the electrostatic painting of
intrinsically conductive plastics. These
advantages are shown graphically in
Figure 1. These advantages include:
• Elimination of conductive priming
reduced labor
reduced materials
reduced number of process steps
reduced volatile organic compound emissions
• Improved paint transfer efficiency
reduced materials (base and clear coats)
• Improvement in first pass yield
greater paint wrap
uniform coverage
The challenge in resin development is to combine a base resin technology with a conduc-
tive technology such that an appropriate balance is struck for economic viability.
PPE/PA BLEND TECHNOLOGY
Polymer blends are formulated to provide a material with an appropriate balance of thermal
performance, processability, and toughness, among other properties, that cannot be met with
single polymers. Melt compounding, or extrusion, is used to mix the two resins to form the al-
loy or blend. Because most polymer blend pairs are immiscible and incompatible, they form a
two phase system. Furthermore, the phase morphology is unstable and tends toward gross
phase separation This makes processing difficult and often results in delamination in injec-
tion molded parts. The phase separation also results in poor physical performance.
To circumvent the difficulties encountered in producing useful immiscible blends, gen-
eration of compatibilizer molecules by can be achieved during the compounding operation.
182 Conductive Polymers and Plastics
Figure 1. Approximate normalized paint usage for various painting
technologies.
These compatibilizers act as
macromolecular surfactants,
stabilizing the melt phase mor-
phology against coalescence,
and provide mechanical adhe-
sion between the dissimilar
phases. In this instance, the
melt mixing unit operation is
combined with that of a chemi-
cal reactor. Use of this
technology has been applied
for many years to the commer-
cial production of
polyphenylene ether/polyam-
ide blends (PPE/PA).
The base resin is a
compatibilized, impact modi-
fied blend of polyphenylene
ether (PPE) and polyamide 6,6
(PA). By blending PPE and PA,
it is possible to gather the bene-
fits of each, while mitigating
the deficiencies. PPE, an amor-
phous resin with glass
transition of about 210
o
C,
brings the following advan-
tages:
• improved dimensional stability (less warp, less shrink, less moisture absorption)
• ease of impact modification
• reduction in density
PA, a semicrystalline resin with glass transition of about 65
o
C and melting transition of
about 260
o
C, has these benefits:
• chemical resistance
• ease of processability, low melt viscosity
• paintability
Conductive PPE/PA Blends 183
Figure 2. Schematic representation of PPE/PA blend phase morphology.
Figure 3. Modulus advantage of PPE/PA over PA at elevated temperature.
Figure 2 shows a dia-
gram of the phase
morphology of a typical
PPE/PA alloy. PPE is a dis-
persed phase on the order of
a few microns in diameter
in the PA matrix. Typically,
there is an impact modifier
within the PPE phase.
A significant advan-
tage of PPE/PA blends over
typical nylon materials is
the ability of the material to
withstand the elevated temperature
of paint bake ovens. This can be
seen conceptually as a modulus ad-
vantage at elevated temperature, as
shown in Figure 3. Or similarly, it
is seen in higher heat distortion
temperature (HDT, ASTM D648).
In the past mirror shell appli-
cations have used mineral filled
nylon. The reduced sensitivity to
moisture of PPE/PA provide bene-
fits in property retention as a
function of environmental condi-
tioning, as seen in Figure 4.
GRAPHITE NANOTUBE TECHNOLOGY
The challenge has been to find a conductive additive technology that can be used in a PPE/PA
resin system without reducing or eliminating the advantages elucidated above. For example,
typical graphite fibers can be used. However the loadings required to achieve conductive per-
colation are so high that embrittlement of the composition occurs. A further complication is
the anisotropy that is experienced due to flow fields in injection molding. A second technol-
ogy worthy of consideration is that of conductive carbon black. In this instance, the loading
required for conductivity is significantly less than that for graphite fibers, and isotropy is es-
sentially eliminated. However, mechanical performance can be compromised.
184 Conductive Polymers and Plastics
Figure 4. Property retention, conditioned vs. dry as molded (DAM), of mineral filler PA
vs. PPE/PA.
Figure 5. Schematic diagram of graphite nanotube structure.
The next level in conductive additives is graphite nanotubes. These nanotubes are grown
catalytically using hydrocarbon gas. A schematic diagram is shown in Figure 5. Figure 6 is a
transmission electron micrograph of the “bird’s nest” aggregate structure of the nanotubes,
which depicts the neat, uncompounded structure. Features of these structures include:
• hollow core, typically 3-5 nanometer diameter
• tubes are concentric layers of rolled-up graphite sheets
• graphite basal plane parallel to cylindrical axis
• 10 to 20 nanometers in diameter
• 2 to 10 microns long
Conductive PPE/PA Blends 185
Figure 6. "Bird's nest" aggregate structure of nanotubes as
observed by transmission electron microscopy.
Figure 7. Typical bulk resistivity values required for various
applications.
Figure 8. "Percolation behavior" below the electrostatic paintability below the electrostatic paintability threshold.