Corrosion of Ceramic and Composite Materials Part 4 pptx
Bạn đang xem bản rút gọn của tài liệu. Xem và tải ngay bản đầy đủ của tài liệu tại đây (241.77 KB, 24 trang )
76 Chapter 2
that the dihedral angle between like grains was smaller than
that between unlike grains, indicating that the penetration of
liquid between unlike grains should be less than between like
grains.
The nature of the bonding type of the solid being attacked
compared to that of the attacking medium often can give an
indication as to the extent of wetting that may take place. For
example, transition metal borides, carbides, and nitrides, which
contain some metallic bond character, are wet much better by
molten metals than are oxides, which have ionic bond character
[2.116]. Various impurities, especially oxygen, dissolved in the
molten metal can have a significant effect upon the interfacial
surface energies. For example, Messier [2.117] reported that
silicon wet silicon nitride at 1500°C in vacuum but did not
spread due to oxygen contamination. In most cases, it is the
nature of the grain boundary or secondary phases that is the
controlling factor.
Puyane and Trojer [2.118] examined the possibility of
altering the wettability of alumina by using additives to their
glass composition. They found that V
2
O
5
and CeO
2
additions
changed the surface tension of the glass in opposite directions,
with V
2
O
5
decreasing it and CeO
2
increasing it. They concluded
that the glass characteristics were more important than the
solid parameters in corrosion.
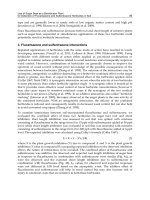
TABLE 2.6 Effects of Composition upon the Dihedral Angle
a
Substitution for MgO in an 85% MgO-15% CMS composition.
Source: Ref. 2.115.
Copyright © 2004 by Marcel Dekker, Inc.
Fundamentals 77
2.6 ACID/BASE EFFECTS
The chemical species present in the liquid will determine whether
it is of an acidic or basic character. Ceramics with an acid/base
character similar to the liquid will tend to resist corrosion the
best. In some cases, the secondary phases of a ceramic may be
of a slightly different acid/base character than the major
component, and thus whether the major phase or the secondary
bonding phase corrodes first will depend upon the acid/base
character of the environment.
Several acid-base reaction theories have been proposed. The
Brönsted and Lowry theory may be sufficient to explain those
reactions in aqueous media where the acid/base character of a
surface is determined by its zero point of charge (zpc) or the
pH where the immersed surface has a zero net surface charge.
In nonaqueous media, the Lewis theory is probably more
appropriate when acids are defined as those species that accept
a pair of electrons thus forming a covalent bond with the donor,
and bases are defined as those species that donate a pair of
electrons thus forming a covalent bond with the acid. Ionization
may follow formation of the covalent bonds. Those species
that can both accept or donate electrons depending upon the
character of its partner are called amphoteric. Thus a particular
species may act as an acid toward one partner but as a base
toward another. Oxidizing agents are similar to acids since
they tend to accept electrons; however, they keep the electrons
to themselves rather than share them.
Carre et al. [2.119] have devised a simple approach to
calculations of the zpc from ionization potentials of the metallic
elements contained in pure oxides. Those values differ very
little from those determined by Parks [2.45]. They used an
additive method to calculate the zpc of multicomponent glasses.
The importance of the zpc in corrosion is that it is the pH of
maximum durability. The approach of Carre et al. is
fundamentally very similar to that of Lewis since oxide acidity
depends upon the electron affinity of the metal, whereas O
2
-
anions act as the basic component.
Copyright © 2004 by Marcel Dekker, Inc.
78 Chapter 2
According to Carre et al., abrading or grinding the surface
of various glasses increases the zpc (e.g., soda-lime glass zpc
increased from about 8.0 to 12.0) supposedly by increasing
the alkalinity at the surface. Acid washing produces just the
opposite effect, decreasing zpc caused by leaching the alkali
from the surface.
2.7 THERMODYNAMICS
The driving force for corrosion is the reduction in free energy
of the system. The reaction path is unimportant in
thermodynamics, only the initial and final states are of concern.
In practice, intermediate or metastable phases are often found
when equilibrium does not exist and/or the reaction kinetics
are very slow. In general, a reaction may occur if the free energy
of the reaction is negative. Although the sign of the enthalpy
(or heat) of reaction may be negative, it is not sufficient to
determine if the reaction will proceed. The spontaneity of a
reaction depends upon more than just the heat of reaction.
There are many endothermic reactions that are spontaneous.
To predict stability, therefore, one must consider the entropy.
Spontaneous, irreversible processes are ones where the entropy
of the universe increases. Reversible processes, on the other
hand, are those where the entropy of the universe does not
change. At low temperatures, exothermic reactions are likely
to be spontaneous because any decrease in entropy of the
mixture is more than balanced by a large increase in the entropy
of the thermal surroundings. At high temperatures, dissociative
reactions are likely to be spontaneous, despite generally being
endothermic, because any decrease in the thermal entropy of
the surroundings is more than balanced by an increase in the
entropy of the reacting mixture.
In the selection of materials, an engineer wishes to select
those materials that are thermodynamically stable in the
environment of service. Since this is a very difficult task,
knowledge of thermodynamics and kinetics is required so that
materials can be selected that have slow reaction rates and/or
Copyright © 2004 by Marcel Dekker, Inc.
Fundamentals 79
harmless reactions. Thermodynamics provides a means for the
engineer to understand and predict the chemical reactions that
take place. The reader is referred to any of the numerous books
on thermodynamics for a more detailed discussion of the topic
[2.120–2.122].
2.7.1 Mathematical Representation
The enthalpy and entropy are related through the free energy.
The change in free energy of an isothermal reaction at constant
pressure is given by:
(2.49)
where:
G = Gibbs free energy
H = enthalpy or heat of formation
T = absolute temperature
S = entropy of reaction
The change in free energy of an isothermal reaction at constant
volume is given by:
(2.50)
where:
F = Helmholtz free energy
E = internal energy
From Eqs. (2.49) and (2.50), it is obvious that the importance
of the entropy term increases with temperature. The reactions
of concern involving ceramic materials are predominately those
at temperatures where the entropy term may have considerable
effect on the reactions. In particular, species with high entropy
values have a greater effect at higher temperatures.
Gibbs free energy is a more useful term in the case of solids
since the external pressure of a system is much easier to control
than the volume. The change in free energy is easy to calculate
at any temperature if the enthalpy and entropy are known.
Copyright © 2004 by Marcel Dekker, Inc.
80 Chapter 2
Evaluation of Eq. (2.49) will determine whether or not a reaction
is spontaneous. If the reaction is spontaneous, the change in
free energy is negative, whereas if the reaction is in equilibrium,
the free energy change is equal to zero.
The free energy change for a particular reaction can be
calculated easily from tabulated data, such as the JANAF Tables
[2.123], by subtracting the free energy of formation of the
reactants from the free energy of formation of the products.
An example of the comparison of free energy of reaction and
the enthalpy of reaction at several temperatures is given below
for the reaction of alumina and silica to form mullite:
(2.51)
Using the following equations to calculate the enthalpy and
free energy change from enthalpy and free energy of formation
data given in the JANAF tables, assuming unit activity for all
reactants and products, one can easily determine if the
formation of mullite is a spontaneous reaction at the
temperature in question:
(2.52)
(2.53)
Using the values from Table 2.7, one then calculates:
It can be seen that although the enthalpy of reaction is positive,
the free energy of reaction is negative and the reaction is
spontaneous at 1400 K and mullite is the stable phase, allowing
one to predict that alumina will react with silica at that
temperature.
Tabulations of the standard free energy, ∆G°, at 1 bar and
298 K, as a function of temperature are available for the more
common reactions [2.123,2.124]. For less-common reactions,
Copyright © 2004 by Marcel Dekker, Inc.
82 Chapter 2
aqueous solutions has been established for a long time and has
now been extended to nonaqueous electrolytes such as molten
salt mixtures. According to Brenner [2.128], who reported
average errors of 32% between calorimetric and emf
measurements, the use of Eq. (2.54) is not accurate and it should
be modified as required for each galvanic cell evaluated.
Although industrial process gas streams are generally not
in thermodynamic equilibrium, their compositions are shifting
toward equilibrium at the high temperatures normally
encountered. Using equilibrated gas mixtures for laboratory
studies then is a basis for predicting corrosion but is not
necessarily accurate. Which reaction products form at solid/
gas interfaces can be predicted from free energy calculations
using the following equation:
(2.55)
where p=partial pressure of each component of the reaction
(2.56)
The bracketed expression inside the logarithm in Eq. (2.55) is
the equilibrium constant for the reaction, thus:
(2.57)
When pure solids are involved in reactions with one or more
nonideal gaseous species, it is more relevant to work with
activities rather than compositions or pressures. Therefore the
equilibrium constant can be expressed in terms of activities:
(2.58)
where the subscripts a and b denote reactants and c and d denote
the products. The activity is the product of an activity coefficient
and the concentration for a solute that does not dissociate. The
Copyright © 2004 by Marcel Dekker, Inc.
Fundamentals 83
solute activity coefficient is taken as approaching unity at infinite
dilution. If the solute were an electrolyte that is completely
dissociated in solution, the expression for the activity would be
more complicated. A few assumptions that are made in the use
of Eqs. (2.55) and (2.58) are that the gases behave as ideal gas
mixtures, that the activity of pure solids is equal to 1, and the
gas mixture is in equilibrium. In those cases where the ideal gas
law is not obeyed, the fugacity is used in place of the activity to
maintain generality. The assumption that the gases are ideal is
not bad since one is generally concerned with low pressures.
The assumption of unity for the activity of solids is true as long
as only simple compounds are involved with no crystalline
solution. The assumption of equilibrium is reasonable near
surfaces since hot surfaces catalyze reactions.
If one is interested in the dissociation pressure of an oxide,
Eq. (2.57) can be used where the equilibrium constant is
replaced with the partial pressure of oxygen (pO
2
) since, for
ideal gas behavior, the activity is approximately equal to the
partial pressure. If the oxide dissociates into its elements, the
measured vapor pressure is equal to the calculated dissociation
pressure. If the oxide dissociates into a lower oxide of the metal
forming a stable gas molecule, the vapor pressure measured is
greater than the calculated dissociation pressure. A compilation
of dissociation pressures was given by Livey and Murray
[2.129]. At moderate to high temperatures and atmospheric
pressure, however, the fugacity and partial pressure are almost
equal. Thus for most ceramic systems, the partial pressure of
the gas is used, assuming ideality.
An example where a pure solid reacts to form another pure
solid and a gas is that of calcite forming lime and carbon
dioxide. The equilibrium constant is then independent of the
amount of solid as long as it is present at equilibrium.
(2.59)
(2.60)
Copyright © 2004 by Marcel Dekker, Inc.
84 Chapter 2
rearranging:
(2.61)
or:
(2.62)
At constant temperature, if the partial pressure of CO
2
over
CaCO
3
is maintained at a value less than k
p
, all the CaCO
3
is
converted to CaO. If the partial pressure of CO
2
is maintained
greater than k
p
, then all the CaO will react to form CaCO
3
.
This type of equilibrium, involving pure solids, is different from
other chemical equilibria that would progress to a new
equilibrium position and not progress to completion.
An example, similar to the above description for Eq. (2.57),
for a reaction when both the reactants and products are all
solid phases was given by Luthra [2.130] for the reaction of
an alumina matrix with SiC reinforcement fibers. The following
equation depicts this reaction:
(2.63)
where the silica activity is dependent upon the alumina activity,
assuming the activities of both SiC and A
4
C3 are unity. This
is given by:
(2.64)
If the silica activity in the matrix is greater than the equilibrium
silica activity, no reaction will occur between the matrix and
the fiber. Since the activities of both silica and alumina are
very small, minor additions of silica to the alumina matrix
will prevent matrix/fiber reaction. Thus the use of small mullite
additions prevents this reaction.
Since the corrosion of ceramics in service may never reach
an equilibrium state, thermodynamic calculations cannot be
strictly applied because these calculations are for systems in
Copyright © 2004 by Marcel Dekker, Inc.
l
Fundamentals 85
equilibrium. Many reactions, however, closely approach
equilibrium, and thus the condition of equilibrium should be
considered only as a limitation, not as a barrier to interpretation
of the data.
2.7.2 Graphical Representation
The thermodynamics of reactions between ceramics and their
environments can be best represented by one of several different
types of stability diagrams. Graphs provide the same
information as the mathematical equations; however, they can
display unexpected relationships that provide new insight into
emphasize different aspects of the information and thus are
well suited only to a specific problem. Fig. 2.13 is a schematic
representation for each of the various types of diagrams that
one may find in the literature. Probably the most common
type of graphical representation of thermodynamic data is the
equilibrium phase diagram [2.1]. These are based upon the
Gibbs Phase Rule, which relates the physical state of a mixture
with the number of substances or components that make up
the mixture and with the environmental conditions of
temperature and/or pressure. The region above the solidus is
of greatest importance in most corrosion studies. The liquidus
lines or the boundary curves between the region of 100% liquid
and the region of liquid plus solid determine the amount of
solid that can be dissolved into the liquid (i.e., saturation
composition) at any temperature. For this reason, these curves
are also called solubility or saturation curves. Thus, these curves
give the mole fraction (or weight fraction) at saturation as a
function of temperature. To obtain concentrations, one must
also know the density of the compositions in question.
Another type of diagram is a graphical representation of
the standard free energy of formation of the product between
a metal and 1 mol of oxygen as a function of temperature at a
constant total pressure. These are called Ellingham diagrams
[2.131]. Richardson and Jeffes [2.132] added an oxygen
Copyright © 2004 by Marcel Dekker, Inc.
solving a problem. Various types of graphical representations
Fundamentals 87
nomograph scale to the Ellingham diagram so that one could
also determine the reaction for a certain partial pressure of
oxygen in addition to the temperature. Since CO/CO
2
and H
2
/
H
2
O ratios are often used in practice to obtain various partial
pressures of oxygen (especially the very low values), Darken
and Gurry [2.133] added nomograph scales for these ratios.
These diagrams now can be found in many places containing
various numbers of oxidation/reduction reactions and have
been referred to as Ellingham, Ellingham-Richardson, Darken
and Gurry, or modified Ellingham diagrams. On these plots
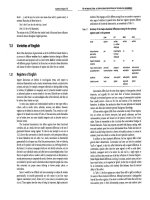
(Fig. 2.14), the intercept at T=0 K is equal to ∆H° and the
slope is equal to -∆S°.
To use the diagram shown in Fig. 2.14, one needs only to
connect the point representing zero free energy at the absolute
zero of temperature (e.g., the point labeled O to the left of the
diagram) and the point of intersection of the reaction and
temperature in question. As an example, for alumina at 1400°C,
this line intersects the pO
2
scale at about 10
-
24
atm, the
equilibrium partial pressure of oxygen for the oxidation of
aluminum metal to alumina. Any pressure lower than this will
cause alumina to be reduced to the metal. This leads to the
general tendency for oxides to be reduced at higher
temperatures at constant oxygen partial pressures. One should
also be aware that any metal will reduce any oxide above it in
this diagram.
One should remember that all condensed phases of the
reactions plotted in Fig. 2.14 are assumed to be pure phases
and therefore at unit activity. Deviations from unit activity are
encountered in most practical reactions. The correction that is
applied is proportional to the activities of the products to that
of the reactants by use of Eqs. (2.55) and (2.58). As an example
for the manufacture of glass containing nickel, the NiO activity
is less than unity due to its solution in the glass. The correction
term would then be negative and the free energy plot would be
rotated clockwise. This change in slope can considerably affect
the equilibrium partial pressure of oxygen required to maintain
the nickel in the oxidized state. In this case, the lower activity
Copyright © 2004 by Marcel Dekker, Inc.
Fundamentals 89
is beneficial since the nickel will remain in the oxidized state at
lower partial pressures of oxygen at any given temperature.
Many reactions that do or do not occur based upon
examination of Fig. 2.14 can be explained by nonunit activities.
Since greater values of negative ∆G° indicate greater stability
of an oxide with respect to its elements, Ellingham diagrams
are excellent for determining the relative stability of oxides in
contact with metals; however, they contain no information about
the various vapor species that may form. Lou et al. [2.134]
have described a modified Ellingham diagram containing vapor
pressure information. They have combined the information of
volatility diagrams (isothermal plots of partial pressure
relationships between two gaseous species in equilibrium with
the condensed phases) with that of Ellingham-type information
to derive a diagram for the free energy changes vs. temperature
at various vapor pressures for individual oxides. The example
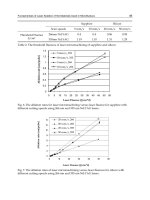
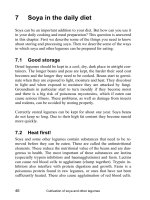
for aluminum is shown in Fig. 2.15. This diagram is a plot of
pO
2
(actually, RT In pO
2
) and temperature for various pAlO
x
values. Line 6 is the boundary for the transition from Al solid
or liquid to Al
2
O
3
solid or liquid; line 7 is the boundary for
transition of the principal vapors from Al to AlO
2
. The vapor
pressure of Al over solid Al
2
O
3
is shown as a series of lines
sloping toward the right in the center portion of the diagram.
The upper dashed line is the isomolar line that defines the
maximum pAl over Al
2
O
3
in a nonreactive system (i.e., vacuum
or inert gas). The lower dashed line is constructed from isobaric
points that represent the maximum Al vapor pressure allowed
for any hydrogen pressure at a particular temperature (based
upon the reaction Al
2
O
3
+3H
2
→2Al
(g)
+3H
2
O
(g)
). For example,
at 1800°C, the maximum predicted vapor pressure of Al over
solid Al
2
O
3
would be 10
–3
Pa and the maximum pO
2
would be
10
–3.3
Pa.
The free energy is also related to the dissociation pressure of
the product; thus other types of graphical representations are
also available in the literature. These are generally isothermal
plots of the gaseous partial pressures in equilibrium with the
condensed phases and have been called volatility diagrams,
Copyright © 2004 by Marcel Dekker, Inc.
Fundamentals 91
When more than one gaseous species is involved in the reaction,
volatility diagrams are more appropriate.
Many cases of corrosion of ceramic materials take place in
an aqueous media (e.g., weathering of window glass). In these
cases, the pH of the system becomes important. Pourbaix [2.73]
first suggested the use of redox potential (E) vs. pH plots to
predict direction of reaction and the phases present. These plots,
now called Pourbaix diagrams, are graphical representations
of thermodynamic and electrochemical equilibria in aqueous
systems. Fig. 2.16 is a Pourbaix diagram of the system
aluminum—water at 25°C. The two dashed lines labeled a
and b in Fig. 2.16 enclose the region where water is stable. At
any potential and pH above the top line (b), water decomposes
evolving oxygen. At any potential and pH below the lower
line (a), water decomposes evolving hydrogen. These diagrams
delineate three major regions of interest. The first is the region
where no reaction occurs to the metal (i.e., the region of
immunity), generally the lower portion of the diagram. The
second is the region of corrosion where the metal reacts to
form an ion, generally the upper left region of the diagram.
This second region is the one of most interest to the ceramist
studying corrosion. The third is the region of passivity where
the metal reacts to form an insoluble species that may be
protective (generally an oxide), generally the upper right portion
of the diagram. Garrels and Christ [2.74] have extensively
developed Pourbaix’s concept for use in describing the action
of water upon soils. These diagrams, related to soil-water
systems, have been called Garrels and Christ diagrams. In
aqueous dissolution studies, it is also convenient to plot the
pH of the solution vs. the logarithm of the concentration of
the species dissolved (solubility diagrams).
2.8 KINETICS
It is normally expected that materials will corrode, and thus it
is important to know the kinetics of the reaction so that
predictions of service life can be made. Thus the most important
Copyright © 2004 by Marcel Dekker, Inc.
Fundamentals 93
parameter of corrosion from the engineering viewpoint is the
reaction rate. Systems can often exist for extended periods of
time in a state that is not the equilibrium state or the state of
lowest free energy. These states are called metastable states
and may occur for many reasons. One case is where a surface
reaction forms a diffusion barrier that blocks or drastically
diminishes further reaction. In another more important case,
for the reaction to proceed to the lowest free energy state, it
must first pass through an intermediate state where the energy
is higher than either the initial or final states. The energy
required to overcome this barrier is called the activation energy
and the net energy released is the heat of reaction. This is
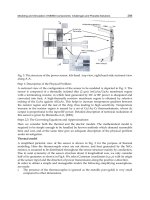
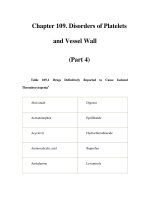
depicted in Fig. 2.17 where the movement of an atom from an
initial metastable state (a) to the final stable state (c) requires
passage through the higher energy unstable state (b). The
reaction is exothermic in going from (a) to (c) and endothermic
in the reverse direction. The activation energy for the reverse
direction obviously must be greater than for the forward
direction. The speed of the reaction is dependent upon the total
number of atoms in the metastable state, the vibration
frequency of the atoms, and the probability that an atom during
vibration will have the necessary energy to overcome the barrier.
If sufficient energy is not acquired to overcome the activation
FIGURE 2.17 Energy barrier diagram (Q=activation energy and
H=heat of reaction).
Copyright © 2004 by Marcel Dekker, Inc.
94 Chapter 2
energy barrier, the system will remain indefinitely in the
metastable state. The number of atoms that pass over the barrier
is then the rate of the reaction and is given by:
(2.65)
where A is a constant containing the frequency term and Q is
the activation energy. Expressing this equation in logarithmic
form, one obtains:
(2.66)
A plot of In(rate) vs. reciprocal temperature yields Q/R as the
slope and the intercept at 1/T=0 yields A.
The effect of temperature upon the reaction rate can be seen
by the following example. Suppose that Q=45 kcal/mol, a
number not unreasonable for many ceramic reactions, and that
R=2.0 cal/mol K. Calculation of the exponential term yields a
rate that is approximately 10
23
times as fast at 1000 K as it is
at 300 K. Thus if a reaction takes 1 sec at 1000 K, it takes on
the order of 10
12
years at room temperature. This is the basis
of quenching and allows one to examine reactions at room
temperature that have occurred at high temperature.
Quite often, a plot of the logarithm of the corrosion rate vs.
the inverse temperature yields a straight line, indicating that
corrosion is an activated process. Attempting to correlate
various ceramic material properties to these activation energies,
however, can be very misleading. Generally, the range of
activation energies experimentally observed for different
materials is very large and any interpretation is difficult since
diffusion coefficients depend upon the composition and
structure of the material through which diffusion occurs. Since
the interface composition generally changes with temperature,
the driving force for diffusion also changes with temperature,
neither of which has any relationship to an activated process.
When a substance increases the reaction rate but is not itself
consumed in the reaction, it is called a catalyst. Catalysts
operate by many different mechanisms, but all essentially go
through a cycle where they are used and then regenerated. When
Copyright © 2004 by Marcel Dekker, Inc.
Fundamentals 95
a catalyst occurs in solution as a molecule or ion, it operates
through a process called homogeneous catalysis; when the
reaction occurs on a surface, the process is called heterogeneous
catalysis. The reaction path provided by the catalyst is one of
lower activation energy and/or higher frequency factors. If the
products of the reaction act as a catalyst, the reaction is said to
be autocatalytic.
Reaction rates for condensed-phase processes normally
involve the transport of products away from the boundary.
Thus the rate of the overall process is determined by the rate
of each individual step and on the reaction rate constant and
concentration of reactants for that step. The reaction with the
lowest rate determines the overall rate of the corrosion process.
Some of the more important factors that may influence the
rate of reaction are diffusion rates, viscosity, particle size, heat
transfer, and the degree of contact or mixing.
The stoichiometric chemical equation of the overall process
does not reveal the mechanism of the reaction. To determine
the overall reaction rate, one must determine all the
intermediate steps of the process. Prediction or identification
of the reaction mechanism is never certain since other
mechanisms could account for the experimental data.
The rate of the reaction expressed as the rate of change of
concentration, dc/dt, depends upon the concentration of the
reactants. Rates may also depend upon the concentrations of
other substances not involved in the stoichiometric equation.
The rate equation as a function of concentration of each
substance that affects the rate is called the rate law for the
reaction. When the rate equation contains powers of the
concentration, the order of the reaction equals the exponent.
Rate laws can be determined only experimentally and cannot
be predicted from the chemical equation.
The first-order rate equation is given by:
(2.67)
where:
k = rate constant
Copyright © 2004 by Marcel Dekker, Inc.
96 Chapter 2
c = concentration of reacting species
n = reaction order=1 for first order
t = time
If log c is plotted against time, a straight line is obtained for a
first-order reaction. If the reaction is one of the first order, it
will take twice as long for three-fourths to react as it will for
one-half to react. A discussion of the order of reactions and
the various equations can be found in any book on kinetics
[2.136].
Integration of Eq. (2.67) between concentration limits of c
1
and c
2
at time limits of t
1
and t
2
yields:
(2.68)
Thus it should be apparent from this equation that to determine
k, it is necessary to evaluate only the ratio of the concentrations
at the two times. This can make analysis easier since one can
substitute any measurable property that is proportional to the
concentration. Changes in properties such as volume, partial
pressure of gases, light absorption, and electrical conductivity
are often used.
Equation (2.67) is often written in a form relating the
fraction of product formed to the reaction time:
(2.69)
where α is now the total amount of product formed. According
to Sharp et al. [2.137], when n=1/2 or 2/3, the equations
represent phase-boundary-controlled reactions for circular
disks (or cylinders) or spheres, respectively.
Diffusion-controlled reactions have been represented by
various functions of the amount of product formed given by
the general equation:
(2.70)
The frequently cited article by Sharp et al. gives numerical data
that allows one to evaluate F(α) from experimental data for the
Copyright © 2004 by Marcel Dekker, Inc.
Fundamentals 97
commonly used equations, which are given in Table 2.8. Since
these equations have been derived for specific geometric mono-
sized shapes, which are seldom present in actual cases, Sharp
et al. concluded that considerable experimental accuracy was
required to distinguish among the various possibilities.
It should be realized that the solutions to the kinetic equations
discussed by Sharp et al. are only approximate. Frade and Cable
[2.138] pointed out that the deviation observed between
experimental data and theoretical models is often due only to
the approximations that were made in the original theoretical
analysis. Frade and Cable reexamined the basic theoretical model
for the kinetics of solid state reactions by considering spherical
particles, moving reaction boundaries, and changes in volume.
The discrepancies between the experimental data and the
theoretical models are often due to nonspherical particles, a range
Source: Ref. 2.137.
TABLE 2.8 Kinetic Equations
Copyright © 2004 by Marcel Dekker, Inc.
98 Chapter 2
in sizes, poor contact between reactants, formation of multiple
products, and the dependency of the diffusion coefficient upon
composition. The commonly used Jander equation was originally
derived for reactions between flat slabs and is therefore
inappropriate for use with spherical particles, although the Jander
model fits reasonably well for low values of conversion.
Many reactions are not simply zero-, first-, second-, or third-
order reactions since they proceed by a multistep mechanism.
Multistep reactions may, however, behave as zero-, first-, etc.
order reactions. Some of the complexities that may be
encountered are parallel steps, consecutive steps, and reversible
steps or may even be other types of steps. Many times, a
complex reaction may appear to be zero-, first-, second-, or
third-order only because the rate-limiting step is of that order
and all other steps are very fast.
Nonisothermal thermogravimetry (TG) has been used by
many investigators over the past 30 years to study the kinetics
of decomposition reactions. The amount of data that can be
collected by dynamic methods is considerably more than by
isothermal methods, which has led investigators to rely more
heavily upon the dynamic method. The convenience today is
so great with modern computerized thermal analyzers that one
need only scan a sample at several different heating rates, and
then push the appropriate buttons to obtain the kinetic data!
One must be extremely careful in collecting kinetic data in this
fashion. A thorough understanding of the various effects that
the sample characteristics, machine operation, etc. have upon
the kinetics is important along with all the various assumptions
that may have been made by the software programmer to use
that data to calculate the kinetic parameters. Too often, these
psuedokinetic data are published in the technical literature and
can be misleading to the unwary reader.
Although many advantages exist for the use of
nonisothermal studies over isothermal studies, the main
disadvantage is that the reaction mechanism usually cannot
be determined, which leads to uncertainties in the activation
energy, order of reaction, and frequency factor. There must be
Copyright © 2004 by Marcel Dekker, Inc.
Fundamentals 99
at least two dozen different methods and variations reported in
the literature to calculate kinetic parameters from dynamic
thermogravimetric studies. The most widely used is that of
Freeman and Carroll [2.139]. Sestak [2.140] performed a
comparison of five methods and found a variation of
approximately 10% in the calculated values of the activation
energy. Arnold et al. [2.141] concluded that dynamic
thermogravimetric studies provide insufficient data for
calculation of reaction kinetics, that the data are influenced by
the experimental procedures, and that the results are uncertain.
Differential thermal analysis (DTA) and differential scanning
calorimetry (DSC) have also been used to study reaction
kinetics. The equation to evaluate the rate depends on the
mechanism, and thus the mechanism must be known before
these methods can be used. The rate of heat generation must
also be proportional to the rate of reaction for these methods
to be valid. A recent review of the use of DTA to determine
reaction kinetics has been given by Sestak [2.142].
Probably the most important parameter that is uncertain in
nonisothermal studies is the temperature of the sample. The
enthalpy of the reaction is often sufficient to raise or lower the
sample temperature by as much as 1000°C. This fact is
overlooked or unavailable if one uses nonisothermal
thermogravimetry, which is most often the case. DTA or DSC
may be more appropriate than TG since these techniques either
determine the sample temperature or maintain the sample at a
constant temperature relative to a reference material. Generally,
the temperature range studied in thermal analysis to evaluate
the kinetics of a reaction is on the order of 100–150°C. This
range covers only about 10–20% of the total reaction and leads
to excessive scatter in the calculated values of the activation
energy and the preexponential term of the Arrhenius equation.
For corrosion rates to be useful to practicing engineers, it is
best that they be expressed in a useful manner. In most cases,
the engineer is involved with the amount of material corroded
away during a specified time period or the depth of penetration
per unit time. In the literature, corrosion rates are often given as
Copyright © 2004 by Marcel Dekker, Inc.
100 Chapter 2
the mass of material reacted per unit area for a unit time. These
can easily be converted to the depth of penetration per unit time
by dividing by the density of the material as shown below:
(2.71)
where:
P = depth of penetration
M = mass loss
ρ
= density
A = area of exposure
t = time of exposure
In using the above equation to calculate corrosion rates from
laboratory experiments, one must be very conscious of the total
surface area exposed to corrosion. This will include a
determination of the open porosity of the specimen. Many
investigators have attempted to compare corrosion resistance
of various materials incorrectly by omitting the porosity of their
samples. Omitting the porosity, although not giving a true
representation of the material’s corrosion, will give a reasonable
idea of the corrosion of the as-manufactured material.
2.9 DIFFUSION
When the transport of ions or molecules occurs in the absence
of bulk flow, it is called diffusion. Substances will spontaneously
diffuse toward the region of lower chemical potential. This
transport or flux of matter is represented by Fick’s first law
and is proportional to the concentration gradient. This is
represented by:
(2.72)
where:
J
ix
= flux of component i in the x direction
D = diffusion coefficient
c
i
= concentration of component i
Copyright © 2004 by Marcel Dekker, Inc.
Fundamentals 101
The How of material is thus proportional to the concentration
gradient and is directed from the region of high concentration
to one of low concentration.
Fick’s second law describes the nonstationary state of flow
where the concentration of a fixed region varies with time:
(2.73)
Since diffusion is directional, one must be aware of anisotropic
effects. The rate of diffusion may be very different in different
crystalline directions. In isometric crystals, the diffusion
coefficient is isotropic, as it is in polycrystalline materials as
long as no preferred orientation exists. The second-order
tensor defined by the equations for the flux, J, in each of the
x, y, and z directions, contains a set of nine diffusion
coefficients designated D
ij
. Due to the effects of the various
symmetry operations in the tetragonal, hexagonal,
orthorhombic, and cubic crystal classes, only a few of these
D
ij
have nonzero values. All the off-diagonal D
ij
(i=j) are equal
to zero. Thus only the three diagonal values are of any
consequence; however, symmetry again causes some of these
to be equivalent. In the remaining two crystal classes, the
number of independent coefficients increases; however, the
total number is decreased somewhat since D
ij
=D
ji
. The possible
nonzero diffusion coefficients for each of the crystal classes
are shown in Table 2.9.
A solution of Eq. (2.73) for nonsteady-state diffusion in a
semi-infinite medium (D is independent of concentration) is:
(2.74)
where:
C(x,t) = concentration after time t
C
o
= initial concentration in the medium
Copyright © 2004 by Marcel Dekker, Inc.
Fundamentals 103
thus approximates the distance over which the concentration
will change during diffusion. The use of error functions (erf)
in evaluating diffusion is relatively easy by use of published
tables [2.143] for various values of erf(z).
Most of the solutions to Fick’s equations assume that D is
constant; however, in most real cases, the diffusion coefficient
can vary with time, temperature [see Eq. (2.40)], composition,
or position along the sample, or any combination of these. If
these are included in the equation, the mathematics become
very difficult if not impossible; thus the equations used to
describe diffusion generally assume constant D. See Table 2.10
for some typical values of diffusion coefficients.
TABLE 2.10 Diffusion Coefficients for Some Typical Ceramics
Copyright © 2004 by Marcel Dekker, Inc.
104 Chapter 2
Several mechanisms for diffusion have been hypothesized
and investigated. One of the more important in ceramic
materials is diffusion by vacancy movement in
nonstoichiometric materials. Another mechanism involves
diffusion by movement from one interstitial site to another.
The ease with which this mechanism can occur, however, is
not as great as that by vacancy movement. Other mechanisms
that provide high-diffusivity paths include diffusion aided by
dislocations, free surfaces, or grain boundaries.
Permeability constants as a function of temperature give an
indication of the ease of diffusion of a species through a
material. Silica has the lowest permeability to oxygen. This
has been attributed to the difference in mechanism of transport
among silica and most other materials. Transport in silica is
by molecular species, whereas in other materials, it is by ionic
species [2.144]. For this reason, silica-forming reactions are
the most desirable for protection against oxygen diffusion
[2.145].
Since many applications of ceramics involve thermal
gradients, some mention of thermal diffusion should be made.
Based upon studies in liquids, this has been called the Sorét
effect. To evaluate the effect using Fick’s first law, an additional
term must be added to Eq. (2.72) that involves the temperature
gradient. The flux is then given by:
(2.76)
where ß
i
is a constant independent of the thermal gradient for
component i and may be positive or negative depending upon
whether diffusion is down or up the thermal gradient,
respectively. This constant is proportional to D and is given by:
(2.77)
where Q
i
* is an empirical parameter that describes the sign
and magnitude of the thermal diffusion effect. It has also been
called the heat of transport. One interesting phenomenon that
Copyright © 2004 by Marcel Dekker, Inc.
Fundamentals 105
comes from an analysis of thermal diffusion is that a diffusion
flux will set up a thermal gradient in an isothermal system.
When an elastic stress gradient is present along with a
concentration gradient, a potential term must be included in
the equation for total flux, just as was necessary for the thermal
gradient. Thus the total flux of atoms in a particular direction
is increased (or decreased) over that due only to concentration
differences. This effect is called stress-assisted diffusion.
Diffusion is probably the most important rate-controlling
step when one is evaluating the kinetics of a reaction by thermal
analysis. Diffusion in the gas phase is about 10
4
times greater
than that in the liquid phase. For a more complete description
of diffusion, the reader is referred to any one of the texts on
diffusion [2.154, 2.155].
2.10 SUMMARY OF IMPORTANT CONCEPTS
1. It is the total surface area exposed to attack that is
important.
2. Grain boundary diffusion is more important at low
temperatures, and bulk diffusion is more important
at high temperatures.
3. One need not have data on a specific material,
chemically, but only on one of identical structure to
estimate its dissolution characteristics.
4. One must remember that it is not the total porosity that
is important, but the surface area of the total porosity.
5. If sufficient flow of a transpiring gas along a thermal
gradient is present, dilution of the corrosive gas at
the hot face may lower the corrosion rate to an
acceptable level.
6. The characteristics of the corroding glass are more
important than the solid parameters in corrosion.
7. Ceramics with an acid/base character similar to the
liquid will tend to resist corrosion the best.
8. The importance of the zero point of charge (zpc) in
corrosion is that it is the pH of maximum durability.
Copyright © 2004 by Marcel Dekker, Inc.