Handbook of Analytical Methods for Materials Part 2 ppt
Bạn đang xem bản rút gọn của tài liệu. Xem và tải ngay bản đầy đủ của tài liệu tại đây (119.59 KB, 10 trang )
Handbook of Analytical Methods for Materials Copyright © 2001 by Materials Evaluation and Engineering, Inc.
11
AUGER ELECTRON SPECTROSCOPY
DESCRIPTION OF TECHNIQUE
Auger Electron Spectroscopy (AES) provides information about the chemical composition of the
outermost material comprising a solid surface or interface. The principal advantages of AES over
other surface analysis methods are excellent spatial resolution (< 1 µm), surface sensitivity (~20 Å),
and detection of light elements. Detection limits for most elements range from about 0.01 to 0.1 at%.
AES uses a primary electron beam to excite the sample surface. When an inner-shell electron is
ejected from a sample atom by the interaction with a primary electron, an electron from an outer shell
fills the vacancy. To compensate for the energy change from this transition, an Auger electron or an x-
ray is emitted. For light elements, the prob-
ability is greatest for the emission of an Auger
electron, which accounts for the light-element
sensitivity for this technique.
The energy of the emitted Auger electron is
characteristic of the element from which it was
emitted. Detection and energy analysis of the
emitted Auger electrons produces a spectrum
of Auger electron energy versus the relative
abundance of electrons. Peaks in the spec-
trum identify the elemental composition of the
sample surface. In some cases, the chemical
state of the surface atoms can also be deter-
mined from energy shifts and peak shapes.
Auger electrons have relatively low kinetic
energy, which limits their escape depth. Any Auger electrons emitted from an interaction below the
surface will lose energy through additional scattering reactions along its path to the surface. Auger
electrons emitted at a depth greater than about 2 - 3 nm will not have sufficient energy to escape the
surface and reach the detector. Thus, the analysis volume for AES extends only to a depth of about 2
nm. Analysis depth is not affected by the energy of the primary electron energy.
The AES instrumentation can include a tungsten filament or field emission electron gun for the primary
electron beam. The instruments are equipped for secondary electron imaging (SEM) to facilitate
location of selected analysis areas, and micrographs of the sample surface can be obtained. The
sample chamber is maintained at ultrahigh vacuum to minimize interception of the Auger electrons by
gas molecules between the sample and the detector. Some instruments include special stages for
fracturing samples to examine interfaces that have been freshly exposed within the vacuum chamber.
A computer is used for acquisition, analysis, and display of the AES data.
AES Spectrum for Passivated Stainless Steel
Handbook of Analytical Methods for Materials Copyright © 2001 by Materials Evaluation and Engineering, Inc.
12
ANALYTICAL INFORMATION
Survey Scan - The position of the peaks in the AES
spectrum obtained in a survey scan identifies the
elemental composition of the uppermost 20 Å of the
analyzed surface.
Multiplex Scan - A higher resolution analysis of the
Auger spectrum in the region around a characteristic
peak is used for determination of the atomic concen-
tration of the elements identified in the survey scans
and, in some cases, chemical state information.
Quantitation - The AES analysis results can be
quantified without standards by using the area under the peaks in the AES spectrum and corrections
based on elemental sensitivity factors.
Mapping and Line Scans - These are imaging techniques that measure the lateral distribution of
elements on the surface. The electron beam is scanned across the sample surface, either along a fixed
line (line scan) or across a given area (mapping) while the AES signal is analyzed for specific energy
channels. The AES signal intensity is a function of the relative concentration of the element(s) corre-
sponding to the selected energy channel(s). Spatial resolution is approximately 0.3 µm.
Depth Profile - Material is removed from the surface by sputtering with an energetic ion beam concurrent
with successive AES analyses. This process measures the elemental distribution as a function of depth into
the sample. Depth resolution of < 100 Å is possible.
TYPICAL APPLICATIONS
• Microscopic particle identification
• Passive oxide film thickness
• Contamination on integrated circuits
• Quantitation of light element surface films
• Mapping spatial distribution of surface
constituents
SAMPLE REQUIREMENTS
Samples should be no larger than approximately 3/4 in. by 1/2 in. (18 mm by 12 mm). Height of
samples should not exceed 1/2 in. (12mm). Samples must be conductive or area of interest must be
properly grounded. Insulating samples, including thick insulating films (>300 Å), cannot be analyzed.
Samples must also be compatible with a high vacuum environment (<1x10
-9
Torr).
AUGER ELECTRON SPECTROSCOPY
Auger maps of defect in glass coating (250x250 mm)
Composition Profile for Ni-Ti Alloy
Handbook of Analytical Methods for Materials Copyright © 2001 by Materials Evaluation and Engineering, Inc.
13
ENERGY DISPERSIVE X-RAY SPECTROSCOPY
DESCRIPTION OF TECHNIQUE
Energy Dispersive X-Ray Spectroscopy (EDS or EDX) is a chemical microanalysis technique used in
conjunction with scanning electron microscopy (SEM). (See Handbook section on SEM.)The EDS
technique detects x-rays emitted from the sample during bombardment by an electron beam to
characterize the elemental composition of the analyzed volume.
Features or phases as small as 1 µm or less can be analyzed.
When the sample is bombarded by the SEM's electron beam,
electrons are ejected from the atoms comprising the sample's
surface. The resulting electron vacancies are filled by electrons
from a higher state, and an x-ray is emitted to balance the
energy difference between the two electrons' states. The x-ray
energy is characteristic of the element from which it was emitted.
The EDS x-ray detector measures the relative abundance of
emitted x-rays versus their energy. The detector is typically a lithium-drifted silicon, solid-state device.
When an incident x-ray strikes the detector, it creates a charge pulse that is proportional to the energy
of the x-ray. The charge pulse is converted to a voltage pulse (which remains proportional to the x-
ray energy) by a charge-sensitive preamplifier. The signal is then sent to a multichannel analyzer where
the pulses are sorted by voltage. The energy, as determined from the voltage measurement, for each
incident x-ray is sent to a computer for display and further data evaluation. The spectrum of x-ray
energy versus counts is evaluated to determine the elemental composition of the sampled volume.
ANALYTICAL INFORMATION
Qualitative Analysis - The sample x-ray energy values from the EDS spectrum are compared with
known characteristic x-ray energy values to determine the presence of an element in the sample.
Elements with atomic numbers ranging
from that of beryllium to uranium can be
detected. The minimum detection limits
vary from approximately 0.1 to a few
atom percent, depending on the element
and the sample matrix.
Quantitative Analysis - Quantitative
results can be obtained from the relative
x-ray counts at the characteristic energy
EDS Spectrum for Alloy MP35N
Elemental Map for the Microstructure of a White Iron Casting
Handbook of Analytical Methods for Materials Copyright © 2001 by Materials Evaluation and Engineering, Inc.
14
levels for the sample constituents. Semi-quantitative results are readily available without standards by
using mathematical corrections based on the analysis parameters and the sample composition. The
accuracy of standardless analysis depends on the sample composition. Greater accuracy is obtained
using known standards with similar structure and composition to that of the unknown sample.
Elemental Mapping - Characteristic x-ray intensity is measured relative to lateral position on the
sample. Variations in x-ray intensity at any characteristic energy value indicate the relative concentra-
tion for the applicable element across the surface. One or more maps are recorded simultaneously
using image brightness intensity as a function of the local relative concentration of the element(s)
present. About 1 µm lateral resolution is possible.
Line Profile Analysis - The SEM electron beam is
scanned along a preselected line across the sample while
x-rays are detected for discrete positions along the line.
Analysis of the x-ray energy spectrum at each position
provides plots of the relative elemental concentration for
each element versus position along the line.
TYPICAL APPLICATIONS
• Foreign material analysis
• Corrosion evaluation
• Coating composition analysis
• Rapid material alloy identification
• Small component material analysis
• Phase identification and distribution
SAMPLE REQUIREMENTS
Samples up to 8 in. (200 mm) in diameter can be readily analyzed in the SEM. Larger samples, up to
approximately 12 in. (300 mm) in diameter, can be loaded with limited stage movement. A maximum
sample height of approximately 2 in. (50 mm) can be accommodated. Samples must also be compat-
ible with a moderate vacuum atmosphere (pressures of 2 Torr or less).
ENERGY DISPERSIVE X-RAY SPECTROSCOPY
EDS Linescan Across Plated PCB Layers
Handbook of Analytical Methods for Materials Copyright © 2001 by Materials Evaluation and Engineering, Inc.
15
FOURIER TRANSFORM-INFRARED SPECTROSCOPY
DESCRIPTION OF TECHNIQUE
Fourier Transform-Infrared Spectroscopy (FTIR) is an analytical technique used to identify organic
(and in some cases inorganic) materials. This technique measures the absorption of infrared radiation
by the sample material versus wavelength. The infrared absorption bands identify molecular compo-
nents and structures.
When a material is irradiated with infrared radiation, absorbed IR radiation usually excites molecules
into a higher vibrational state. The wavelength of light absorbed by a particular molecule is a function
of the energy difference between the at-rest and excited vibrational states. The wavelengths that are
absorbed by the sample are characteristic of its molecular structure.
The FTIR spectrometer uses an interferometer to modulate the wavelength from a broadband infra-
red source. A detector measures the intensity of transmitted or reflected light as a function of its
wavelength. The signal obtained from the detector is an interferogram, which must be analyzed with a
computer using Fourier transforms to obtain a single-beam infrared spectrum. The FTIR spectra are
usually presented as plots of intensity versus wavenumber (in cm
-1
). Wavenumber is the reciprocal of
the wavelength. The intensity can be plotted as the percentage of light transmittance or absorbance at
each wavenumber.
ANALYTICAL INFORMATION
Qualitative Material Identification - To identify the material being analyzed, the unknown IR
absorption spectrum is compared with standard spectra in computer databases or with a spectrum
obtained from a known material. Spectrum matches identify the polymer or other constituent(s) in the
sample. Absorption bands in the range of 4000 - 1500 wavenumbers are typically due to functional
groups (e.g., -OH, C=O, N-H, CH
3,
etc.). The
region from 1500 - 400 wavenumbers is
referred to as the fingerprint region. Absorption
bands in this region are generally due to in-
tramolecular phenomena and are highly specific
to each material. The specificity of these bands
allows computerized data searches within
reference libraries to identify a material.
Quantitation - Quantitative concentration of a
compound can be determined from the area
under the curve in characteristic regions of the
FTIR Spectrum for Paint Analysis
Handbook of Analytical Methods for Materials Copyright © 2001 by Materials Evaluation and Engineering, Inc.
16
FOURIER TRANSFORM-INFRARED SPECTROSCOPY
IR spectrum. Concentration calibration is obtained by establishing a standard curve from spectra for
known concentrations.
TYPICAL APPLICATIONS
• Identification of foreign materials
- Particulates
- Fibers
- Residues
• Identification of bulk material compounds
• Identification of constituents in multilayered materials
• Quantitation of silicone, esters, etc., as contamination on various materials
SAMPLE REQUIREMENTS
Sample requirements vary depending on the sample form and instrument. Samples may be in liquid,
solid or gaseous form. When using a microscope attachment on the spectrometer, the analysis area
can be as small as 10 µm. Thin organic films on a reflective surface (e.g., gold) can be analyzed in situ
using the microscope's reflectance mode. The outer 1-10 µm of a material can be analyzed using
attenuated total reflectance (ATR).
Handbook of Analytical Methods for Materials Copyright © 2001 by Materials Evaluation and Engineering, Inc.
17
GAS CHROMATOGRAPHY / MASS SPECTROSCOPY
DESCRIPTION OF TECHNIQUE
Gas chromatography / mass spectrometry (GC/MS) is the marriage of two analytical methods into a
versatile technique for the identification of complex volatile materials. Gas chromatography (GC)
effectively separates the different constituents of the sample for subsequent analysis and identification
by mass spectrometry (MS).
The chromatographic separation relies on the interaction of the sample with a mobile phase and a
stationary phase within the GC instrument column. The sample is carried through the column by the
mobile phase, typically an inert gas. However, the sample is slowed in its travel through the column as
the sample molecules repeatedly adsorb and desorb from the stationary phase in the column. The
affinity of a particular molecule for the stationary phase determines the retention time of that constitu-
ent in the column. The molecules for each component of
the sample will travel through the column at nearly the
same rate and exit (elute) from the column within a
narrow time band that is specific to that component.
Thus, compounds with different retention times in the
column are physically separated for presentation to a
detector and analyzer.
The typical GC capillary column consists of a small-
diameter tube with a thin film of a high-molecular-
weight polymer coated on the inside. The polymer is the
stationary phase for the chromatographic process. The
mobile phase can be any inert gas, but is typically
helium. The instrument also includes a heated injection
port to vaporize all volatile constituents of the sample and an oven to keep the constituents in gas
form as they pass through the column.
As a sample constituent elutes from the GC column, it enters the ionization chamber of the mass
spectrometer where the molecules are ionized, typically by electron impact. When an electron impact
with a sample molecule results in the loss of an electron from the molecule, a positive ion is formed.
Some of the molecular ions are further fragmented into daughter ions and neutral fragments. The
positive ions are then repelled out of the ionization chamber by a small positive charge within the
chamber. Negative ions are also formed by the electron impact, but are not analyzed.
The positive ions are separated according to their mass by a mass analyzer. The mass analyzer most
commonly used in GC/MS is the quadrapole filter, in which the ions pass by four hyperbolic magnetic
poles created by a radio frequency field. The magnetic poles separate the ions by their mass/charge
ratio, successively focusing ions with increasing mass onto a detector for counting. The analyzer scans
step-wise through a set range of mass values to evaluate the relative abundance of ions at each mass
value. The quadrapole filter can perform a complete mass scan within the duration of a single GC
elution band.
Total Ion Chromatogram for Two Vegetable Oils
Handbook of Analytical Methods for Materials Copyright © 2001 by Materials Evaluation and Engineering, Inc.
18
ANALYTICAL INFORMATION
Material Identification - The first result from the compiled data is a total-ion chromatogram (TIC),
which is a plot of the total mass eluting from the GC and detected by MS as a function of time. Each
peak or band in the chromatogram represents a discrete chemical compound, or a mixture of com-
pounds with identical retention times. The reten-
tion times in the chromatogram provide the first
indication of the sample constituents.
More specific identification of the compound(s)
for each band can then be made from the mass
spectrum corresponding to the band. Com-
pounds are identified from the mass spectrum by
their unique ion fragmentation patterns. This
compound identification analysis is performed by
a computerized comparison of the mass spectra
for the sample with spectra library for known
compounds.
Quantitation - The analysis results can be quantified using the data from the chromatogram. The
area under each peak in the chromatogram is proportional to the concentration of the compounds
represented by that peak. The concentration for each compound in the sample is calculated from a
standard curve of known concentrations established for that compound. The analysis sensitivity can
be as low as a few nanograms.
TYPICAL APPLICATIONS
• Identification of foreign material contamination
• Analysis of outgassing products for disk drive components
• Identification of polymer additives
• Analysis of polymer cure by-products
SAMPLE REQUIREMENTS
The samples for GC/MS can be gases, liquids, or solids. However, only those constituents that are
gaseous and stable at the analysis temperature can be analyzed. Gases and liquids can be injected
directly into the sample injector. Volatile compounds from solid materials are collected using a
headspace sampler. The sample from a headspace attachment can be collected and injected at one
time (static headspace), or the sample can be collected and analyzed continuously over a set time
period (dynamic headspace).
GAS CHROMATOGRAPHY/MASS SPECTROSCOPY
Chromotagram for Outgassing Compounds from Two Epoxies
Handbook of Analytical Methods for Materials Copyright © 2001 by Materials Evaluation and Engineering, Inc.
19
ION CHROMATOGRAPHY
DESCRIPTION OF TECHNIQUE
Ion chromatography (IC) is the separation and quantitative analysis of anions and cations in an ionic
solution using the ion exchange method of liquid chromatography (LC). The chromatographic process
separates the different ions within the sample. The amount of an anion/cation is measured by the
change in conductivity as the species passes through the detector.
The ions in the sample solution are carried through the system by an ionic solution, or eluent (mobile
phase). The different ions in the eluent are separated in a column packed with an ion exchange resin
(stationary phase). The resin has a thin surface layer of
active material with limited ion exchange sites. If anions are
to be analyzed, the active sites will have a fixed positive
charge to attract the anions. Resins for cation analysis will
have a negative charge. Individual ions attach and detach
from the resins at a rate depending on the affinity of the
specific ion to the active sites. Ions with greater affinity for
the stationary phase are retained in the column for a longer
time than those with less affinity for the stationary phase.
Thus, the ions of particular chemical species in the solution
exit or elute from the column within a narrow time band
specific to that ion. The detector at the end of the column
continuously measures the conductivity of the eluent to determine the quantity of the eluting ions as a
function of time. The data from the detector are compiled into a plot of ion abundance versus time,
referred to as a chromatogram. The position of a peak in the chromatogram is characteristic of a
specific ion. The peak size is a function of the concentration for the ion represented by that peak.
ANALYTICAL INFORMATION
Material Identification - The presence of specific anions and cations in the sample can be
determined through comparison of the sample chromatograms against results for known refer-
ence materials.
Quantitation - Anion and cation concentrations can be quantified by establishing a standard curve of
known concentrations for each species. The peak height or the area under the peak in the chromato-
gram for each anion or cation is compared to the standardization curve to determine the concentration
of the ion the sample.
Sensitivity - Minimum concentration detection limits can be as low as a few parts per billion (ppb).
Ion Chromatogram
Handbook of Analytical Methods for Materials Copyright © 2001 by Materials Evaluation and Engineering, Inc.
20
TYPICAL APPLICATIONS
• Determination of ionic species in plating baths
• Determination of acidic thermal decomposition products of polymer materials
• Determination of ionic contamination on critical components
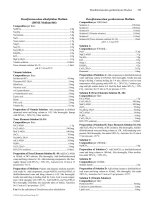
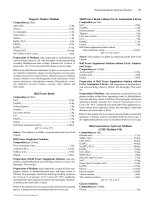
MINIMUM DETECTION LIMITS FOR IC
SAMPLE REQUIREMENTS
Samples must be immersible in a solution that is compatible with the LC system, or the components
of interest must be extractable from the sample. Components must cause a change in the conductivity
of the solution to be detected.
ION CHROMATOGRAPHY
SPECIES MDL SPECIES MDL
ANIONS CATIONS
Fluoride (F
-
) 4 ppb Lithium (Li
+
)1 ppb
Chloride (Cl
-
) 20 ppb Sodium (Na
+
)5 ppb
Nitrite (NO
2
-
) 20 ppb Ammonium (NH4
+
)5 ppb
Bromide (Br
-
) 20 ppb Potassium (K
+
)8 ppb
Nitrate (N0
3
-
) 20 ppb Magnesium (Mg
+2
)7 ppb
Phosphate (PO
4
-2
) 20 ppb Calcium (Ca
+2
)7 ppb
Sulfate (SO
4
-2
)20 ppb