Coefficient of consolidation from the linear
Bạn đang xem bản rút gọn của tài liệu. Xem và tải ngay bản đầy đủ của tài liệu tại đây (21.9 KB, 2 trang )
DISCUSSION
Coefficient of consolidation from the linear
segment of the t
1/2
curve: Reply
1
Tao-Wei Feng and Yi-Jiuan Lee
The discussion is appreciated and replied to as follows.
The discussed paper has included a review of the
discussers’ early log t method for determining the coefficient
of consolidation. Apparatus deformation, sometimes called
machine deflection, is only responsible for part of the mea
-
sured instantaneous deformation. Therefore, the correction
of apparatus deformation does not improve the shape of the
measured consolidation curve, but it does improve the com
-
pression curve (i.e., void ratio – effective stress relationship).
The most widely used apparatus for conventional oedometer
tests does not provide a mean to saturate the specimen. In
other words, the oedometer test is usually run without back-
pressure. In this case, it has been commonly observed that
the initial segment of the measured compression versus loga-
rithmic of time curve is not parabolic. However, like what is
done by Casagrande and Fadum (1940), the discussers still
assume that the initial segment of the measured compression
time curve is parabolic. The discussers are therefore still us-
ing the directly measured consolidation curve to determine
0% consolidation. Different 0% consolidation may be ob-
tained using different pairs of time of t
1
and t
2
with t
2
=4t
1
.
Therefore, the initial compression would still affect the use
of the early log t method proposed by the discussers. It is
suggested in the discussed paper that the effect of initial
compression may become insignificant when U > 20%. The
question is whether or not t
1
corresponds to U > 20%?
The comments from the discussers on the proposed t
1/2
method are based on the partial differentiation of the theoret
-
ical U–T
1/2
relationship. It may be noted that the variable in
the denominator of the discussers’ eq. [2] should be T
1/2
.A
partial differentiation of the theoretical U–T
1/2
relationship at
U = 60% gives the slope of the tangent at that point. But, it
should be noted that eq. [5] of the discussed paper is based
on eq. [4] of the same paper. That means eq. [5] actually cal
-
culates the total differentiation of eq. [4]. Thus it would have
been better if eq. [5] were written as (dU/dT
1/2
)
60
= 1.128.
On the other hand, the t
1/2
curve fitting method (Taylor 1948)
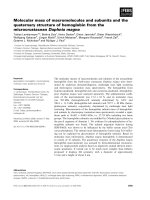
is actually doing the total differentiation graphically. Figure
D1 shows the variation of the total differentiation with the
average degree of consolidation U. It can be seen from Fig. D1
that the value of the total differentiation for U < 45% is
equal to 1.128 and for U = 60% it is equal to 1.122. The ra
-
tio between 1.122 and 1.128 is equal to 0.995, which is only
slightly less than 1. This slight difference is necessary in ap
-
plying the curve fitting method by hand to discern a point at
which the measured consolidation curve deviates from the
straight segment. Figure D1 also shows that the value of
dU/dT
1/2
increases rapidly with increasing values of U for U >
60%. Thus, it is believed that the characteristic point deter
-
mined by using the proposed t
1/2
curve fitting method is in
fact near or at U = 60%. Identification of this characteristic
Can. Geotech. J. 39: 1002–1003 (2002) DOI: 10.1139/T02-044 © 2002 NRC Canada
1002
Received 10 January 2002. Accepted 11 January 2002. Published on the NRC Research Press Web site at on
27 July 2002.
T.-W. Feng
2
and Y.-J. Lee Department of Civil Engineering, Chung Yuan Christian University, Chung-li, Taiwan, Republic of
China.
1
Discussion by R.G. Robinson and M.M. Allam. This issue. Canadian Geotechnical Journal, 39: 1000–1001.
2
Corresponding author (e-mail: ).
Average Degree of Consolidation, U (%)
0 20406080100
Total Differentiation, dU/dT
1/2
0.7
0.8
0.9
1.0
1.1
1.2
U = 60%
dU/dT
1/2
= 1.128
dU/dT
1/2
= 1.122
Fig. D1. Variation of the total differentiation of the theoretical
U–T
1/2
relationship dU/dT
1/2
with the average degree of consoli-
dation U.
I:\cgj\Cgj39\Cgj-04\T02-044.vp
Thursday, July 25, 2002 8:31:56 AM
Color profile: Disabled
Composite Default screen
point from the U–T
1/2
plot in Fig. 1 of the discussed paper is
not as difficult as that implied by the discussers.
References
Casagrande, A., and Fadum, R.E. 1940. Notes on soil testing for
engineering purposes. Harvard University Graduate School En
-
gineering Publication, No. 8, Cambridge, MA.
Taylor, D.W. 1948. Fundamentals of soil mechanics. John Wiley &
Sons, New York. 700 pp.
Feng and Lee
© 2002 NRC Canada
Feng and Lee 1003
I:\cgj\Cgj39\Cgj-04\T02-044.vp
Thursday, July 25, 2002 8:31:56 AM
Color profile: Disabled
Composite Default screen