Volume 08 - Mechanical Testing and Evaluation Part 11 docx
Bạn đang xem bản rút gọn của tài liệu. Xem và tải ngay bản đầy đủ của tài liệu tại đây (2.97 MB, 150 trang )
27. “Standard Test Method for J-Integral Characterization of Fracture Toughness,” ASTM E 1737, Annual
Book of Standards, Vol 03.01, ASTM, 1996
28. J.D. Landes and J.A. Begley, in Fracture Toughness, ASTM STP 560, 1974, p 170
29. S. Hashemi and J.G. Williams, Plast. Rubber Process. Appl., Vol 6, 1986, p 363
30. M L. Lu and F C. Chang, Polymer, Vol 36, 1995, p 2541
31. Z. Zhou, J.D. Landes, and D.D. Huang, Polym. Eng. Sci., Vol 34, 1994, p 128
32. M L. Lu, C B. Lee, and F C. Chang, Polym. Eng. Sci., Vol 35, 1995, p 1433
33. J.W. Hutchinson and P.C. Paris, in Elastic-Plastic Fracture, ASTM STP 668, 1979, p 37
34. I. Narisawa and M.T. Takemori, Polym. Eng. Sci., Vol 29, 1989, p 671
35. H. Swei, B. Crist, and S.H. Carr, Polymer, Vol 32, 1991, p 1440
36. C B. Lee, M L. Lu, and F C. Chang, J. Appl. Polym. Sci., Vol 47, 1993, p 1867
37. M L. Lu and F C. Chang, J. Appl. Polym. Sci., Vol 56, 1995, p 1065
38. B.M. Rimnac, T.W. Wright, and R.W. Klein, Polym. Eng. Sci., Vol 28, 1988, p 1586
39. B.D. Huang, in Toughened Plastics I: Science and Enginering, C.K. Riew and A.J. Kinloch, Ed., Vol
233, p 39, ACS Advances in Chemistry Series,, American Chemical Society, 1993
40. M L. Lu, K C. Chiou, and F C. Chang, Polymer, Vol 37, 1996, p 4289
41. K.J. Pascoe, in Failure of Plastics, W. Brostow and R.D. Corneliussen, Ed., Hanser Publishers, 1989, p
119
42. M L. Lu, K C. Chiou, and F C. Chang, Polym. Eng. Sci., Vol 36, 1996, p 2289
Fracture Resistance Testing of Plastics
Kevin M. Kit and Paul J. Phillips, University of Tennessee, Knoxville
References
1. N.G. McCrum, B.E. Read, and G. Williams, Anelastic and Dielectric Effects in Polymeric Solids,
Wiley, 1967
2. I.M. Ward, Mechanical Properties of Solid Polymers, Wiley, 1983, p 15
3. E.H. Andrews, Cracking and Crazing in Polymeric Glasses, The Physics of Glassy Polymers, R.N.
Haward, Ed., Wiley, 1973, p 394
4. R. Natarajan and P.E. Reed, J. Polym. Sci. A, Polym. Chem., Vol 2 (No. 10), 1972, p 585
5. G.A. Bernier and R.P. Kambour, Macromolecules, Vol 1, 1968, p 393
6. E.H. Andrews, G.M. Levy and J. Willis, J. Mater. Sci., Vol 8, 1973, p 1000
7. L.E. Weber, The Chemistry of Rubber Manufacture, Griffin, London, 1926, p 336
8. K. Memmler, The Science of Rubber, R.F. Dunbrook and V.N. Morris, Ed., Reinhold, 1934, p 523
9. G.R. Irwin, in Encyclopaedia of Physics, Vol 6, Springer Verlag, 1958
10. N.G. McCrum, C.P. Buckley, and C.B. Bucknall, Principles of Polymer Engineering, Oxford University
Press, 1997, p 201
11. A.A. Griffith, Phil. Trans. R. Soc. (London) A, Vol 221, 1921, p 163
12. R.S. Rivlin and A.G. Thomas, J. Polym. Sci., Vol 10, 1953, p 291
13. R.P. Kambour, Appl. Polym. Symp., Vol 7, John Wiley & Sons, 1968, p 215
14. J.P. Berry, J. Polym. Sci. A, Polym. Chem., Vol 2, 1964, p 4069
15. E.H. Andrews, J. Mater. Sci., Vol 9, 1974, p 887
16. J.R. Rice, J. Appl. Mech. (Trans. ASME), Vol 35, 1968, p 379
17. J.R. Rice, Fracture, Vol 2, 1968, p 191
18. J.A. Begley and J.D. Landes, in Fracture Toughness, ASTM STP 514, 1972, p 1
19. J.D. Landes and J.E. Begley, in Fracture Toughness, ASTM STP 514, 1972, p 24
20. J.M. Hodgkinson and J.G. Williams, J. Mater. Sci., Vol 16, 1981, p 50
21. S. Hashemi and J.D. Williams, Polym. Eng. Sci., Vol 26, 1986, p 760
22. Y.W. Mai and P. Powell, J. Polym. Sci. B, Polym. Phys., Vol 29, 1991, p 785
23. M. Ouederni and P.J. Phillips, J. Polym. Sci. B., Polym. Phys., Vol 33, 1995, p 1313
24. “Standard Test Methods for Plane Strain Fracture Toughness and Strain Energy Release Rate of Plastic
Materials,” ASTM D 5045, Annual Book of Standards, Vol 08.03, ASTM, 1996
25. “Standard Test Method for Determining J-R Curves of Plastic Materials,” ASTM D 6068, Annual Book
of Standards, Vol 08.03, ASTM, 1996
26. “Standard Test Method for J
Ic
, A Measure of Fracture Toughness,” ASTM E 813, Annual Book of
Standards, Vol 03.01, ASTM, 1989
27. “Standard Test Method for J-Integral Characterization of Fracture Toughness,” ASTM E 1737, Annual
Book of Standards, Vol 03.01, ASTM, 1996
28. J.D. Landes and J.A. Begley, in Fracture Toughness, ASTM STP 560, 1974, p 170
29. S. Hashemi and J.G. Williams, Plast. Rubber Process. Appl., Vol 6, 1986, p 363
30. M L. Lu and F C. Chang, Polymer, Vol 36, 1995, p 2541
31. Z. Zhou, J.D. Landes, and D.D. Huang, Polym. Eng. Sci., Vol 34, 1994, p 128
32. M L. Lu, C B. Lee, and F C. Chang, Polym. Eng. Sci., Vol 35, 1995, p 1433
33. J.W. Hutchinson and P.C. Paris, in Elastic-Plastic Fracture, ASTM STP 668, 1979, p 37
34. I. Narisawa and M.T. Takemori, Polym. Eng. Sci., Vol 29, 1989, p 671
35. H. Swei, B. Crist, and S.H. Carr, Polymer, Vol 32, 1991, p 1440
36. C B. Lee, M L. Lu, and F C. Chang, J. Appl. Polym. Sci., Vol 47, 1993, p 1867
37. M L. Lu and F C. Chang, J. Appl. Polym. Sci., Vol 56, 1995, p 1065
38. B.M. Rimnac, T.W. Wright, and R.W. Klein, Polym. Eng. Sci., Vol 28, 1988, p 1586
39. B.D. Huang, in Toughened Plastics I: Science and Enginering, C.K. Riew and A.J. Kinloch, Ed., Vol
233, p 39, ACS Advances in Chemistry Series,, American Chemical Society, 1993
40. M L. Lu, K C. Chiou, and F C. Chang, Polymer, Vol 37, 1996, p 4289
41. K.J. Pascoe, in Failure of Plastics, W. Brostow and R.D. Corneliussen, Ed., Hanser Publishers, 1989, p
119
42. M L. Lu, K C. Chiou, and F C. Chang, Polym. Eng. Sci., Vol 36, 1996, p 2289
Fracture Toughness of Ceramics and Ceramic
Matrix Composites
J.H. Miller, Oak Ridge National Laboratory P.K. Liaw, The University of Tennessee, Knoxville
Introduction
CERAMICS are lightweight structural materials with much higher resistance to high temperatures and
aggressive environments than other conventional engineering materials. These characteristics of ceramics hold
promise in various applications for gas turbines, heat exchangers, combustors and boiler components in the
power generation systems, first-wall and high-heat-flux surfaces in fusion reactors, and structural components
in the aerospace industry (Ref 1, 2, 3, 4, 5, 6, 7, 8, 9, 10, 11, 12, 13, 14, 15, 16, 17, 18, 19, 20, 21, 22, 23, 24,
and 25). However, most of these engineering applications require high reliability and the improvement of
ceramic fracture toughness.
Monolithic ceramics are inherently brittle, making them highly sensitive to process- and service-related flaws.
Due to their low toughness, monolithic ceramics are prone to catastrophic failure and, thus, may be unsuitable
for engineering applications that require high reliability. Ceramic matrix composites (CMCs), however, can
provide significant improvement in fracture toughness and the avoidance of catastrophic failure (Ref 1, 2, 3, 4,
5, 6, 7, 8, 9, 10, 11, 12, 13, 14, 15, 16, 17, 18, 19, 20, 21, 22, 23, 24, 25, 26, 27, 28, 29, 30, 31, 32, 33, 34, 35,
36, 37, 38, 39, 40, and 41). The fracture mechanisms in CMCs are identical to those found in monolithic
ceramics (brittle), but “plastic-like” behavior occurs in CMCs because of the toughening mechanisms of crack
bridging, branching, and deflection. The reinforcing particles, whiskers, or fibers that are present in the ceramic
matrix allow the bulk composite material to avoid unstable crack growth and the resulting catastrophic failure.
The toughness of CMCs comes from the fact that the reinforcement can provide crack bridges and cause cracks
to branch, deflect, or arrest. These issues are quite complicated, and they demonstrate the critical need for the
understanding of the fracture properties of ceramics and CMCs.
Much work has been done to develop methods for evaluating the fracture toughness of ceramic materials (Ref
42, 43, 44, 45, 46, 47, 48, 49, and 50). The concepts of both linear-elastic fracture mechanics (LEFM) and
elastic-plastic fracture mechanics (EPFM) are both of interest in regard to ceramic materials. Monolithic
ceramics, due to their brittle nature, behave in a linear-elastic manner. This fact has lead to the successful use of
LEFM methods for monolithic ceramics. Many CMCs, on the other hand, have an elastic-plastic fracture
behavior. This fact has lead researchers to attempt to use EPFM methods to evaluate the fracture toughness of
CMCs.
This article briefly introduces LEFM and EPFM concepts and methods that have been developed or adapted for
the evaluation of the fracture behavior of monolithic ceramics and CMCs. The general concepts of LEFM and
EPFM are briefly reviewed, and test methods are described for fracture toughness testing of monolithic
ceramics and CMCs. More detailed information on the fracture resistance testing of monolithic ceramics is also
contained in the article “Fracture Resistance Testing of Brittle Solids” in this Volume, while this article places
emphasis on the fracture toughness testing of cmcs. Measuring the fracture toughness of CMCs is not as
developed as toughness testing of monolithic ceramics. The toughening mechanisms of microcracking, crack
bridging, and crack branching cause CMCs to behave in an elastic-plastic-like manner, which makes EPFM
methods attractive. LEFM and EPFM methods have both been used to evaluate the toughness of CMCs, but
because the level of understanding of the complex fracture mechanisms present in CMCs is not well developed,
no connection has been made between the macroscopic toughness, either elastic or elastic-plastic, and the
fracture mechanisms. As a result, evaluation of the fracture toughness of CMCs has been limited. However, as
the cracking mechanisms become better understood, LEFM and EPFM methods will become better adapted for
use in the evaluation of CMC fracture toughness behavior.
References cited in this section
1. T.M. Besmann, B.W. Sheldon, R.A. Lowden, and D.P. Stinton, Vapor Phase Fabrication and Properties
of Continuous-Filament Ceramic Composites, Science, Vol 253, 1991, p 1104
2. M. Bouquet, J.M. Bribis, and J.M. Quenisset, Toughness Assessment of Ceramic Matrix Composites,
Compos. Sci. Technol., Vol 37, 1990, p 223–248
3. C.H. Hsueh, P.F. Becher, and P. Angelini, Effects of Interfacial Films on Thermal Stresses in Whisker-
Reinforced Ceramics, J. Am. Ceram. Soc., Vol 71 (No. 11), 1988, p 929–933
4. D.P. Stinton, A.J. Caputo, and R.A. Lowden, Synthesis of Fiber-Reinforced SiC Composites by
Chemical Vapor Infiltration, Am. Ceram. Soc. Bull., Vol 65 (No. 2), 1986, p 347–350
5. D.P. Stinton, W.J. Lackey, R.J. Lauf, and T.M. Besmann, Fabrication of Ceramic-Ceramic Composites
by Chemical Vapor Deposition, Ceram. Eng. Sci. Proc., Vol 5, 1984, p 668–676
6. J.H. Miller, R.A. Lowden, and P.K. Liaw, Fiber Coatings and the Fracture Behavior of a Continuous
Fiber Ceramic Composite, Symposium on Ceramic Matrix Composites—Advanced High-Temperature
Structural Materials, R.A. Lowden, M.K. Ferber, J.R. Hellmann, K.K. Chawla, and S.G. DiPietro, Ed.,
Vol 365, Materials Research Society, 1995, p 403–410
7. M.A. Borst, W.Y. Lee, Y. Zhang, and P.K. Liaw, Preparation and Characterization of Chemically Vapor
Deposited ZrO
2
Coating on Nickel and Ceramic Fiber Substrates, J. Am. Ceram. Soc., Vol 80 (No. 6),
1997, p 1591–1594
8. N. Miriyala, P.K. Liaw, C.J. McHargue, L.L. Snead, and J.A. Morrison, The Monotonic and Fatigue
Behavior of a Nicalon/Alumina Composite at Ambient and Elevated Temperatures, American Ceramic
Society Meeting, Ceram. Eng. Sci. Proc., Vol 18 (No. 3), 1997, p 747–756
9. W. Zhao, P.K. Liaw, and N. Yu, Effects of Lamina Stacking Sequence on the In-Plane Elastic Stress
Distribution of a Plain-Weave Nicalon Fiber-Reinforced SiC Laminated Composite with a Lay-Up of
[0/30/60], American Ceramic Society Meeting, Ceram. Eng. Sci. Proc., Vol 18 (No. 3), 1997, p 401–
408
10. W. Zhao, P.K. Liaw, and D.C. Joy, Microstructural Characterization of a 2-D Woven Nicalon/SiC
Ceramic Composite by Scanning Electron Microscopy Line-Scan Technique, American Ceramic
Society Meeting, Ceram. Eng. Sci. Proc., Vol 18 (No. 3), 1997, p 295–302
11. J.G. Kim, P.K. Liaw, D.K. Hsu, and D.J. McGuire, Nondestructive Evaluation of Continuous Nicalon
Fiber Reinforced SiC Composites, American Ceramic Society Meeting, Ceram. Eng. Sci. Proc., Vol 18
(No. 4), 1997, p 287–296
12. N. Miriyala, P.K. Liaw, C.J. McHargue, and L.L. Snead, The Monotonic and Fatigue Behavior of a
Nicalon/Alumina Composite at Ambient and Elevated Temperatures, Ceram. Eng. Sci. Proc., Vol 18
(No. 3), 1997, p 747–756
13. W. Zhao, P.K. Liaw, N. Yu, E.R. Kupp, D.P. Stinton, and T.M. Besmann, Computation of the Lamina
Stacking Sequence Effect on the Elastic Moduli of a Plain-Weave Nicalon Fiber Reinforced SiC
Laminated Composite with a Lay-Up of [0/30/60], J. Nucl. Mater., Vol 253, 1998, p 10–19
14. N. Miriyala, P.K. Liaw, C.J. McHargue, and L.L. Snead, “The Mechanical Behavior of A Nicalon/SiC
Composite at Ambient Temperature and 1000 °C”, J. Nucl. Mater., Vol 253, 1998, p 1–9
15. W.Y. Lee, Y. Zhang, I.G. Wright, B.A. Pint, and P.K. Liaw, Effects of Sulfur Impurity on the Scale
Adhesion Behavior of a Desulfurized Ni-Based Superalloy Aluminized by Chemical Vapor Deposition,
Metall. Mater. Trans. A, Vol 29, 1998, p 833
16. P.K. Liaw, Understanding Fatigue Failure in Structural Materials, JOM, Vol 49 (No. 7), 1997, p 42
17. N. Miriyala and P.K. Liaw, CFCC (Continuous-Fiber-Reinforced Ceramic Matrix Composites) Fatigue:
A Literature Review, JOM, Vol 49 (No. 7), 1997, p 59–66, 82
18. N. Miriyala and P.K. Liaw, Specimen Size Effects on the Flexural Strength of CFCCs, American
Ceramic Society Meeting, Ceram. Eng. Sci. Proc., Vol 19, 1998
19. W. Zhao, P.K. Liaw, and N. Yu, Computer-Aided Prediction of the First Matrix Cracking Stress for a
Plain-Weave Nicalon/SiC Composite with Lay-Ups of [0/20/60] and [0/40/60], Ceram. Eng. Sci. Proc.,
Vol 19, 1998, p 3
20. W. Zhao, P.K. Liaw, and N. Yu, Computer-Aided Prediction of the Effective Moduli for a Plain-Weave
Nicalon/SiC Composite with Lay-Ups of [0/20/60] and [0/40/60], Ceram. Eng. Sci. Proc., Vol 19, 1998
21. N. Miriyala, P.K. Liaw, C.J. McHargue, A. Selvarathinam, and L.L. Snead, The Effect of Fabric
Orientation on the Flexural Behavior of CFCCs: Experiment and Theory, The 100th Annual American
Ceramic Society Meeting, 3–6 May 1998 (Cincinnati), in press
22. N. Miriyala, P.K. Liaw, C.J. McHargue, and L.L. Snead, Fatigue Behavior of Continuous Fiber-
Reinforced Ceramic-Matrix Composites (CFCCs) at Ambient and Elevated Temperatures, invited paper
presented at symposium proceedings in honor of Professor Paul C. Paris, High Cycle Fatigue of
Structural Materials, W.O. Soboyejo and T.S. Srivatsan, Ed., The Minerals, Metals, and Materials
Society, 1997, p 533–552
23. W. Zhao, P.K. Liaw, and N. Yu, The Reliability of Evaluating the Mechanical Performance of
Continuous Fiber-Reinforced Ceramic Composites by Flexural Testing, Int. Conf. on Maintenance and
Reliability, 1997, p 6-1 to 6-15
24. P.K. Liaw, J. Kim, N. Miriyala, D.K. Hsu, N. Yu, D.J. McGuire, and W.A. Simpson, Jr., Nondestructive
Evaluation of Woven Fabric Reinforced Ceramic Composites, Symposium on Nondestructive
Evaluation of Ceramics, C. Schilling, J.N. Gray, R. Gerhardt, and T. Watkins, Ed., Vol 89, 1998, p 121–
135
25. M.E. Fine and P.K. Liaw, Commentary on the Paris Equation, invited paper presented at symposium
proceedings in honor of Professor Paul C. Paris, High Cycle Fatigue of Structural Materials, High Cycle
Fatigue of Structural Materials, W.O. Soboyejo and T.S. Srivatsan, Ed., The Minerals, Metals, and
Materials Society, 1997, p 25–40
26. W. Zhao, P.K. Liaw, D.C. Joy, and C.R. Brooks, Effects of Oxidation, Porosity and Fabric Stacking
Sequence on Flexural Strength of a SiC/SiC Ceramic Composite, Processing and Properties of
Advanced Materials: Modeling, Design and Properties, B.Q. Li, Ed., The Minerals, Metals, and
Materials Society, 1998, p 283–294
27. W. Zhao, P.K. Liaw, and N. Yu, Computer Modeling of the Fabric Stacking Sequence Effects on
Mechanical Properties of a Plain-Weave SiC/SiC Ceramic Composite, Proc. on Processing and
Properties of Advanced Materials: Modeling, Design and Properties, B.Q. Li, Ed., The Minerals,
Metals, and Materials Society, 1998, p 149–160
28. J. Kim and P.K. Liaw, The Nondestructive Evaluation of Advanced Ceramics and Ceramic-Matrix
Composites, JOM, Vol 50 (No. 11), 1998
29. N. Yu and P.K. Liaw, Ceramic-Matrix Composites: An Integrated Interdisciplinary Curriculum, J. Eng.
Ed., supplement, 1998, p 539–544
30. P.K. Liaw, Continuous Fiber Reinforced Ceramic Composites, J. Chin. Inst. Eng., Vol 21 (No. 6), 1998,
p 701–718
31. N. Yu and P.K. Liaw, “Ceramic-Matrix Composites: Web-Based Courseware and More,” paper
presented at the 1998 ASEE annual conference and exposition, June 28–July 1, 1998 (Seattle)
32. N. Yu and P.K. Liaw, “Ceramic-Matrix Composites,”
33. P.K. Liaw. O. Buck, R.J. Arsenault, and R.E. Green, Jr., Ed., Nondestructive Evaluation and Materials
Properties III, The Minerals, Metals, and Materials Society, 1997
34. W.M. Matlin, T.M. Besmann, and P.K. Liaw, Optimization of Bundle Infiltration in the Forced
Chemical Vapor Infiltration (FCVI) Process, Symposium on Ceramic Matrix Composites—Advanced
High-Temperature Structural Materials, R.A. Lowden, M.K. Ferber, J.R. Hellmann, K.K. Chawla, and
S.G. DiPietro, Ed., Vol 365, Materials Research Society, 1995, p 309–315
35. P.K. Liaw, D.K. Hsu, N. Yu, N. Miriyala, V. Saini, and H. Jeong, Measurement and Prediction of
Composite Stiffness Moduli, Symposium on High Performance Composites: Commonalty of
Phenomena, K.K. Chawla, P.K. Liaw, and S.G. Fishman, Ed., The Minerals, Metals, and Materials
Society, 1994, p 377–395
36. N. Chawla, P.K. Liaw, E. Lara-Curzio, R.A. Lowden, and M.K. Ferber, Effect of Fiber Fabric
Orientation on the Monotonic and Fatigue Behavior of a Continuous Fiber Ceramic Composite,
Symposium on High Performance Composites, K.K. Chawla, P.K. Liaw, and S.G. Fishman, Ed., The
Minerals, Metals and Materials Society, 1994, p 291–304
37. P.K. Liaw, D.K. Hsu, N. Yu, N. Miriyala, V. Saini, and H. Jeong, Modulus Investigation of Metal and
Ceramic Matrix Composites: Experiment and Theory, Acta Metall. Mater., Vol 44 (No. 5), 1996, p
2101–2113
38. P.K. Liaw, N. Yu, D.K. Hsu, N. Miriyala, V. Saini, L.L. Snead, C.J. McHargue, and R.A. Lowden,
Moduli Determination of Continuous Fiber Ceramic Composites (CFCCs), J. Nucl. Mater., Vol 219,
1995, p 93–100
39. P.K. Liaw, book review on Ceramic Matrix Composites by K.K. Chawla, MRS Bull., Vol 19, 1994, p 78
40. D.K. Hsu, P.K. Liaw, N. Yu, V. Saini, N. Miriyala, L.L. Snead, R.A. Lowden, and C.J. McHargue,
Nondestructive Characterization of Woven Fabric Ceramic Composites, Symposium on Ceramic Matrix
Composites—Advanced High-Temperature Structural Materials, R.A. Lowden, M.K. Ferber, J.R.
Hellmann, K.K. Chawla, and S.G. DiPietro, Ed., Vol 365, Materials Research Society, 1995, 203–208
41. S. Shanmugham, D.P. Stinton, F. Rebillat, A. Bleier, E. Lara-Curzio, T.M. Besmann, and P.K. Liaw,
Oxidation-Resistant Interfacial Coatings for Continuous Fiber Ceramic Composites, S. Shanmugham,
D.P. Stinton, F. Rebillat, A. Bleier, T.M. Besmann, E. Lara-Curzio, and P.K. Liaw, Ceram. Eng. Sci.
Proc., Vol 16 (No. 4), 1995, p 389–399
42. C.B. Thomas, “Processing, Mechanical Behavior, and Microstructural Characterization of Liquid Phase
Sintered Intermetallic-Bonded Ceramic Composites,” M.S. Thesis, The University of Tennessee,
Knoxville, 1996
43. J.H. Miller, “Fiber Coatings and The Fracture Behavior of a Woven Continuous Fiber Fabric-
Reinforced Ceramic Composite,” M.S. Thesis, The University of Tennessee, Knoxville, 1995
44. I.E. Reimonds, A Review of Issues in the Fracture of Interfacial Ceramics and Ceramic Composites,
Materials Science and Engineering A, Vol 237 (No. 2), 1997, p 159–167
45. D.L. Davidson, Ceramic Matrix Composites Fatigue and Fracture, JOM, Vol 47 (No. 10), 1995, p 46–
50, 81, 82
46. J.C. McNulty and F.W. Zok, Application of Weakest-Link Fracture Statistics to Fiber-Reinforced
Ceramic-Matrix Composites, J. Am. Ceram. Soc., Vol 80 (No. 6), 1997, p 1535–1543
47. Z.G. Li, M. Taya, M.L. Dunn, and R. Watanbe, Experimental-Study of the Fracture-Toughness of a
Ceramic/Ceramic-Matrix Composite Sandwich Structure, J. Am. Ceram. Soc., Vol 78 (No. 6), 1995, p
1633–1639
48. A. Ishida, M. Miyayama, and H. Yanagida, Prediction of Fracture and Detection of Fatigue in Ceramic
Composites from Electrical-Resistivity Measurements, J. Am. Ceram. Soc., Vol 77 (No. 4), 1994, p
1057–1061
49. M. Sakai and H. Ichikawa, Work of Fracture of Brittle Materials with Microcracking and Crack
Bridging, Int. J. Fract., Vol 55 (No. 1), 1992, p 65–79
50. J.B. Quinn and G.D. Quinn, “Indentation Brittleness of Ceramics: A Fresh Approach,” J. Mater. Sci.,
Vol 32 (No. 16), 1997, p 4331–4346
Fracture Toughness of Ceramics and Ceramic Matrix Composites
J.H. Miller, Oak Ridge National Laboratory P.K. Liaw, The University of Tennessee, Knoxville
An Overview of Fracture Mechanics
Fracture mechanics involves the stress analysis of cracking in structures or bodies with cracks or flaws. Most of
the work in this field has concentrated on the cracking behavior of metals, so this brief overview introduces the
concepts and ideas of LEFM and EPFM for metals (Ref 51, 52, and 53). This is followed by a description of the
use of LEFM and EPFM methods in the evaluation of monolithic ceramic and CMCs, respectively.
Linear-Elastic Fracture Mechanics
The use of LEFM is applicable under two conditions:
• The applied load deforms a cracked body in a linear-elastic manner.
• The flaw or crack is assumed to be a sharp crack with a tip radius near zero.
The stresses required for cracking under these two conditions can be analyzed according to LEFM by two
parameters: the energy release rate and the stress intensity factor.
The energy release rate, G, is the amount of stored energy that is available for an increment of crack extension:
(Eq 1)
where Π is the stored potential energy and A is the crack surface area that is created as the crack grows. In other
words, G is the amount of store elastic energy that is converted to surface energy as the crack grows. Because
the body behaves in an elastic manner, all of the energy available is used to create the crack surfaces (Ref 51,
52, and 53).
Expressions for the energy release rate can be derived based on the geometry of the crack and the loading
conditions. Two basic types of configurations are shown in Fig. 1 and 2 for an edge crack and a central through-
thickness crack, respectively, for Mode I (tensile opening) loads. In this case, crack length is defined by typical
convention as a for an edge crack (Fig. 1) and as a 2a for a central through-thickness crack (Fig. 2). With this
convention, then the value of G for a wide plate (plate width >> a) in plane stress is as follows (Ref 51, 52, and
53):
(Eq 2)
where σ is the applied stress, E is Young's modulus, and a is either the total length of an edge crack (Fig. 1) or
half the length of center crack (2a in Fig. 2). Equation 2 thus applies to both of these basic configurations in
Fig. 1 and 2 with the appropriate definition for a as shown.
Fig. 1 Schematic illustration of an edge-notched specimen. (a) Crack length, a, and general coordinate
system for crack tip stresses in Mode I loading.
Fig. 2 Schematic illustration stress distributions near the tip of a through-thickness crack an infinitely
wide plate (plate width >> than the crack length, 2a)
The stress intensity factor, K, is a measure of stress intensity in the entire elastic stress field around the crack
tip. It is derived based on the analysis of the stress field near the tip of a sharp crack, rather than an energy
consideration, as in the case of the energy release rate. The stress intensity factor can be related to the local
stress at the crack tip as:
(Eq 3)
where σ
YY
is the local stress near the tip of the crack, K
I
is the stress intensity factor with a Mode I (tensile
opening) load, and r is the distance in front of the crack tip (with θ = 0) (Fig. 1). The stress intensity factor in
Mode I loading can also be related to the applied or nominal stress as (Ref 51, 52, 53):
K
I
= σ
nom
Y
(Eq 4)
where σ
nom
is the nominal or applied stress and Y is a geometrical factor that is specific to a particular loading
condition and crack configuration. As in the case of Eq 2, the crack length, a, in Eq 4 is defined either as the
length of an edge crack (a in Fig. 1) or as one-half the length of a through-thickness crack (2a in Fig. 2). With
these definitions for a, Eq 4 applies for both an edge crack and a center crack configuration.
Figure 3 shows a schematic plot of the stress normal to the crack plane as a function of the distance, r, from the
crack tip for both σ
YY
and σ
nom
(Ref 51, 52, and 53). According to Eq 3 and Fig. 3, there is a singularity in the
stress field at the tip of the crack. This fact is the reason why elastic action is an important assumption in
LEFM. If significant plasticity occurred, the crack would be blunted by the plastic flow, and the stress intensity
solution would no longer be valid.
Fig. 3 Schematic plot of the stress field around a crack. Source: Ref 52
With Eq 4, it is possible to relate the magnitude of the single parameter, K, to the applied stress and crack size.
This is the basis for most common applications of LEFM. Through the use of published expressions for the
geometry factor, Y, many common loading conditions and structures can be analyzed. The published
expressions for K
I
that include the proper Y for specific loading and cracking conditions are commonly called
K-calibrations. The calculated stress intensity factor from the K-calibration and the loading level can be
compared to a critical stress intensity value to determine the safety of the structure (Ref 51, 52, and 53).
The energy release rate is related to the stress intensity factor by the equation:
(Eq 5)
where E′ = E (Young's modulus) for plane stress conditions, or where:
(Eq 6)
where ν is Poisson's ratio for plane strain conditions.
Critical Crack Growth. Crack extension can either be stable or unstable depending on material properties and
specimen geometry. Therefore, an important issue in LEFM is the definition of critical conditions that lead to
unstable crack growth. Critical conditions for unstable crack growth can be expressed as either a critical energy
release rate or a critical stress intensity factor. The critical value is the value of G or K at the instant when
unstable crack extension occurs, that is, when the crack propagates through the specimen and thus causes the
specimen to break in two. The critical energy release rate, G
c
, or the critical stress intensity factor, K
c
, are thus
defined as the values of G and K at the instant of unstable crack extension that leads to fracture. Under these
conditions, either parameter can be defined as the fracture toughness of the material. Usually K
c
is the chosen
parameter to express the fracture toughness. If the fracture toughness is not a function of specimen size or
geometry then this fracture toughness value can be considered a material property. Otherwise, the fracture
toughness result is only valid under the conditions it was measured (Ref 51, 52, 53, and 54).
Crack Growth Resistance and R-Curves. If stable crack growth occurs, a single value for fracture toughness is
difficult to define. In the case of stable crack growth, a plot of the experimentally measured fracture parameter,
in terms of either G or K, versus crack length is developed. This plot can be generated from the load and crack
length data taken from a material test. The stress intensity or the energy release rate is calculated from the
measured load and crack length data using expressions similar to those shown in Eq 2 and 4 (the correct
expression must be used for the conditions of the test). Fracture parameters calculated in this way are defined as
the resistance to crack growth parameters because they are calculated from a crack growing in a stable manner.
The resistance to crack growth, expressed in terms of the energy release rate, is given the symbol R, and the
resistance to crack growth, expressed in terms of the stress intensity factor, is given the symbol K
R
. The plot of
resistance to crack growth, either R or K
R
, versus crack length is called a crack growth resistance curve, or R-
curve, and the entire curve becomes the measure of fracture toughness. Schematic examples of R-curves plotted
in terms of G and K are shown in Fig. 4 and 5, respectively (Ref 51, 52, andd 53).
Fig. 4 Schematic crack growth resistance curves and crack driving force curves, in terms of the energy
release rate, G. (a) Single-valued fracture toughness. (b) Rising R-curve behavior. Adapted from Ref 52
Fig. 5 Schematic crack growth resistance curve and crack driving force curve in terms of the stress
intensity factor, K. Adapted from Ref 52
Figure 5(a) shows a flat R-curve, which is the result of unstable crack growth. The flat R-curve presents the
ease of defining fracture toughness as a critical value for unstable crack growth, in this case G
c
. Figure 5(b) is
an example of an R-curve that demonstrates stable crack growth prior to instability. Stable crack growth occurs
because the crack growth resistance increases with increasing crack length. This trend is called the rising R-
curve behavior. An R-curve plotted in terms of K rather than G is shown in Fig. 5 (Ref 51, 52, and 53).
The R-curve can be used to predict the conditions that will cause crack extension. To do this, it is necessary to
plot the crack driving force on the same axes as the crack growth resistance curve. The curve for crack driving
force is calculated using the same expressions of K and G that relate the geometry and loading conditions to
fracture. However, instead of using the data from a crack propagation test, the procedure is to calculate crack
driving force curves by holding the stress, or load, constant and increasing the crack length incrementally. The
point where the crack driving force curve crosses the resistance curve represents the condition under which
critical crack growth occurs (Ref 51, 52, and 53). The expected in-service stress levels of a cracked body can be
evaluated from this.
In summary, crack growth can either be stable or unstable. If the driving force curve crosses the resistance
curve at the tangency point, the crack growth will be unstable. If it crosses below this point, the crack growth
will be stable. To determine the point where the unstable crack growth occurs it is necessary to establish an
iterative scheme of generating driving force curves for different stress levels until tangency is achieved.
Schematic examples of driving force curves plotted with resistance to crack growth curves are also shown in
Fig. 4 and 5. Also evident in the figures are definitions of the critical energy release rate, G
c
Fig. ( 4) and
critical stress intensity factor K
c
(Fig. 5). These critical values are defined at the point of instability (Ref 51, 52,
and 53).
Elastic-Plastic Fracture Mechanics
EPFM does not have the requirement that the material behave in a linear-elastic manner. Instead, nonlinear or
plastic deformation is allowed in EPFM methods to a much greater extent than in LEFM methods. The primary
fracture parameter for EPFM is the J-integral. The J-integral, or more simply J, can be defined in two ways
(Ref 56, 57). The first is defined by a path-independent line integral around the crack tip. The second is an
energy definition similar to G, except that linear behavior is not required.
The energy definition of J states that J is a more general form of the energy release rate, G, where:
(Eq 7)
When permanent deformation occurs (as in the case of plastic deformation of metals), some of the stored
potential energy, Π, is dissipated and is therefore unavailable for crack extension. In this context, J can be
thought of as the potential energy absorbed by a cracked body prior to crack growth. In other words, J is a
measure of the intensity of the entire elastic-plastic stress-strain field around the crack tip, and J reaches a
critical value just prior to crack extension.
A special case of the energy definition of J is the value for G (when the energy is released as a crack grows in a
linear-elastic material). For the special case of linear-elastic behavior, there is little or no energy absorbed by
permanent deformation, and the only energy dissipation is due to the crack surface creation. Hence, under
linear-elastic conditions J = G:
(Eq 8)
where E′ is equal to E or is related to the elastic modulus per Eq 6.
Under nonlinear conditions beyond the elastic regime, calculating J can be much more difficult. Unlike the K
solutions or K-calibrations (which exist for many different crack and load configurations with K values for
many situations), expressions that relate J values to the applied load and crack configuration are very few. For
the simple situation of an edge-cracked specimen under elastic-plastic loading conditions, the energy definition
of J is as follows:
(Eq 9)
where B is the specimen thickness, Δ is the load-line displacement, and U is the area under the P-Δ curve up to
the initiation of crack growth (Ref 51, 52, and 53) where P is the applied load. Because a certain amount of the
deformation must always be elastic, the expression for J in Eq 9 can be separated into elastic and plastic
components and be rewritten as follows:
(Eq 10)
where η
PL
is a dimensionless constant that depends on the specimen and loading configuration, U
PL
is the
plastic area under the P-Δ curve, and b is the remaining ligament (W-a, where W is the specimen width).
Equation 11 is used in experimentally measuring J (Ref 51, 52, 53, and 57).
In the elastic-plastic regime, there is typically some amount of stable crack growth prior to an unstable crack
extension. The stable crack growth occurs because of energy dissipation and the crack blunting induced by
plastic deformation. As a result, when J is experimentally measured, an R-curve based on the J parameter is
generated. This J-based R-curve is a plot of the resistance to crack growth, J
R
, as a function of crack length or
extension (Fig. 4). The critical J, J
Ic
in the opening mode, is then taken from the J
R
curve at a point near the
initiation of crack growth (Ref 51, 52, 53, 54, 55, 56, and 57).
The basic procedure for experimentally measuring J involves testing a bend specimen or a compact tension
specimen with a deep crack and using the load, displacement, and crack length data to calculate J with Eq 11. J
is calculated for several different crack lengths, and the J
R
curve is generated. From the J
R
curve, the J
Ic
is taken
at the point where initial crack extension occurred, as shown in Fig. 6. The test can be done with one of two
goals. If the point of the test is to determine J
Ic
, J is calculated with less attention to the fact that some crack
extension occurred during the test. Ignoring the crack extension does not present much error because the crack
growth initiation is the important feature in the test. If the development of the full J
R
curve is the goal of the
test, more care is taken in the data analysis to take into account the growing crack (Ref 51, 52, 53, 54, and 57).
Fig. 6 Schematic crack growth resistance curve in terms of J
R
. Adapted from Ref 52
References cited in this section
51. R.W. Hertzberg, Deformation and Fracture Mechanics of Engineering Materials, 3rd ed., John Wiley &
Sons, 1989
52. T.L. Anderson, Fracture Mechanics, 2nd ed., CRC Press, 1995
53. J.M. Barsom and S.T. Rolfe, Fracture and Fatigue Control in Structures, Prentice-Hall, Inc., 1987
54. “Standard Test Method for Plane-Strain Fracture Toughness of Metallic Materials,” ASTM Standard E
399–90, ASTM Book of Standards, Vol 03.01, American Society for Testing and Materials, 1995
55. J.R. Rice, Journal of Applied Mechanics, Vol 35, 1968, p 379–386
56. J.A. Begley, G.A. Clark, and J.D. Landes, Results of an ASTM Cooperative Testing Procedure by
Round Robin Tests of HY130 Steel, JTEVA, Vol 10 (No. 5), 1980
57. “Standard Test Method for J
IC
, A Measurement of Fracture,” ASTM Standard E 813-87, ASTM Book of
Standards, Vol 03.01, American Society for Testing and Materials, 1995
Fracture Toughness of Ceramics and Ceramic Matrix Composites
J.H. Miller, Oak Ridge National Laboratory P.K. Liaw, The University of Tennessee, Knoxville
Fracture Mechanics of Ceramics and CMCs
The concepts of both LEFM and EPFM methods, as previously described in the context of metallic materials,
provides a general basis for the fracture mechanics of monolithic ceramics and ceramic matrix composites.
Generally LEFM methods are applicable for monolithic ceramics while EPFM methods may be suitable for
CMCs.
Monolithic ceramics are inherently brittle due to their strong bonding and more complicated (less symmetric)
crystal structures. Compared to metallic materials, the mixed ionic and covalent atomic bonding and low-
symmetry crystal structure of ceramics severely limit the opportunity for plastic deformation mechanisms from
dislocation formation, movement, and slip. Monolithic ceramics thus have high strength and stiffness with
much less plastic deformation than metals. As a result, their behavior is primarily linear-elastic, which is one of
the required conditions for LEFM methods.
The other condition for LEFM analysis is the presence of a sharp crack or flaw with a crack tip radius
approaching zero. Monolithic ceramics meet this condition as well, and LEFM has been used successfully to
evaluate monolithic ceramic fracture behavior. Some additional work was necessary to augment LEFM
techniques to handle the difficulties of obtaining sharp starter cracks and maintaining stable crack growth that
occur in brittle ceramics. Nonetheless, the result of the application of LEFM to monolithic ceramics is a
relatively mature state of the art. Techniques exist to determine the single-valued critical fracture toughness and
to measure crack growth resistance behavior of monolithic ceramic materials. Current research is centered on
the further refinement of these techniques (see also the article“Fracture Resistance Testing of Brittle Solids” in
this Volume).
Ceramic matrix composites are being developed in an attempt to increase the toughness and damage tolerance
of ceramic materials. The toughness of CMCs is greater than the monolithic ceramics due to the toughening
(energy-absorbing) mechanisms of microcracking, crack bridging, and crack branching. These toughening
mechanisms enable the CMC to behave in a manner that closely resembles the elastic-plastic behavior of
metals. Although this fact may suggest EPFM as appropriate for the study of CMCs, there are differences in the
deformation mechanism of ductile metals and CMCs that can bring into question the appropriateness of metal-
based EPFM methods for use with CMCs.
Metals dissipate crack-tip energy by the plastic deformation mechanisms of slip, dislocation generation, and
dislocation movement. CMCs, on the other hand, dissipate crack tip energy through crack branching, fiber
bridging, and microcracking. In both cases, energy is dissipated by nonlinear deformation of the body prior to
crack extension. Fortunately, EPFM theory does not depend on the mechanism through which the energy is
dissipated during nonlinear deformation, only on the fact that it does occur. As a result, even though the
deformation mechanisms are very different, EPFM theory is valid for both metals and CMCs. Unfortunately,
the complex nature of the processes that cause the nonlinear fracture behavior in CMCs complicates the
experimental application of EPFM methods to CMCs. The following section describes toughness tests that are
used on monolithic ceramics and CMCs.
Fracture Toughness of Ceramics and Ceramic Matrix Composites
J.H. Miller, Oak Ridge National Laboratory P.K. Liaw, The University of Tennessee, Knoxville
Fracture Toughness Evaluation
This section describes some fracture toughness measurement techniques that are being used on ceramics and
CMCs. The descriptions are organized by specimen type, and they include advantages and disadvantages of
each specimen type as well as experimental control schemes that have been employed on each specimen type.
More detailed information on the fracture toughness testing of monolithic ceramics is also provide in the article
“Fracture Resistance Testing of Brittle Solids” in this Volume.
Single Edge Notch Bending (SENB). The SENB specimen, shown in Fig. 7(a) has a rectangular cross section
with a straight-through saw notch. It is loaded in either three- or four-point bending. The advantages of the
SENB include ease of machining due to simple geometry and ease of use due to simple three- or four-point
bend loading, which uses a fixture loaded in simple compression. The SENB, while easy to machine and test, is
not very stiff. This leads to problems in starting a sharp crack at the end of the saw notch and in achieving
stable crack extension (Ref 58).
Fig. 7 Fracture toughness specimens. (a) Single edge notch bending (SENB). (b) Compact tension (CT)
or wedge open loaded (WOL). (c) Double cantilever beam (DCB) tensile loading. (d) DCB constant
bending moment loading. (e) DCB wedge loading. (f) Tapered DCB. (g) Chevron notch short rod. (h)
Chevron notch short bar. (i) Chevron notch bending. (j) Double torsion (DT). (k) Three-point bending
with controlled surface flaw (CSF). P, load. Adapted from Ref 58
One method of producing a sharp starter crack in a SENB specimen involves using a hardness indenter to
introduce a surface flaw and forcing the surface flaw to propagate to the outer edges and become a sharp edge
crack. This can be done by loading the indented specimen in compression between two rigid plates. One of the
plates has a single groove, and the indentation crack is positioned over the groove. During the compressive
loading, the surface flaw is subjected to tensile opening stresses due to the groove, while the bulk of the
material is in compression. This tension allows the crack to grow to become an edge crack, while the
compression prevents the crack from propagating in an unstable manner through the specimen (Ref 59).
SENB specimens have been used to measure the fracture toughness of a yttria-partially stabilized zirconia (Y-
PSZ) ceramic at ambient and elevated temperatures (Ref 59). The point of this work was to demonstrate the use
of a new technique of controlling the fracture test in such a way as to promote stable crack growth so that the R-
curve behavior of the ceramic could be measured. Crack mouth opening displacement (CMOD) was monitored
using a laser extensometer, and the CMOD signal was used in the control of the servohydraulic testing machine
in real time. The results of this type of control were positive, and stable crack growth was achieved (Ref 59).
The SENB method has also been improved by a scheme that employs both a method to provide for stable crack
growth and better real-time computer-aided data acquisition (Ref 60). The crack growth stability was
augmented by adjusting the stiffness of the test frame in such a way as to promote stable crack growth. The test
machine stiffness, or compliance, was adjusted by placing a “parallel elastic element” (PEL) supporting
structure between the crosshead and the top of the three-point bend loading fixture (Fig. 8). The optimum
compliance for stable crack growth was determined by theoretical analysis and experimentation. During testing,
the compliance of the specimen and the test frame were continuously monitored in real time through the use of
a computer. The real-time load and displacement data form various points in the test system, as presented in
Fig. 8. After the optimum PEL compliance was determined, and stable crack growth was achieved, the R-curves
of the test materials were measured. The real-time load and displacement (and, therefore, compliance)
monitoring, along with compliance versus crack length calibrations and the stress intensity calibrations, allowed
the crack length, crack velocity, and stress intensity level to be calculated in real time during the test (Ref 60).
Fig. 8 Schematic of the compliance-controlled three-point bending test with a parallel elastic element
(PEL). Adapted from Ref 60
Compact Tension (CT). The CT sample is a common specimen in fracture mechanics tests. It is loaded in
tension, but the primary stress is due to bending because the load line is offset from the crack front (Fig. 7b).
Relatively stable crack propagation is possible with the CT specimen if a stiff testing machine is used. Also, a
variant of the CT can be used in a wedge-opening mode to increase the stable crack growth capability (Ref 49).
The stable crack growth capability allows for the generation of R-curves using the CT specimen (Ref 61). The
CT specimen is complicated to machine in ceramic materials, and precracking the can be difficult (Ref 58).
In addition to R-curve measurements of monolithic ceramics (Ref 61), R-curves have been measured in CMCs
using the CT specimen. CT specimens have been employed to generate R-curves for CMCs in an attempt to
analyze the crack-face fiber-bridging stress field (the stress field in the wake of the crack that is due to fiber
bridging). The crack-face fiber-bridging stress is evaluated by comparing the experimentally measured
compliance versus crack length, which includes the contribution of the fiber bridging, to the compliance versus
crack length data calculated from the elastic properties of the CMC, assuming no fiber bridges are present (Ref
62).
The J-parameter toughness has also been measured using a CT specimen (Ref 63). A J-based testing technique
has been developed for CMCs using the CT specimen geometry. The concept of the J-parameter is used to
determine the contribution of the process zone (the contribution of, for instance, fiber bridging and crack
branching, analogous to the plastic zone in metals) to the toughness of the CMC. The J-parameter contribution
of the process zone is determined using Eq 12 (Ref 63):
J
∞
+ J
b
+ J
tip
= 0
(Eq 11)
where J
∞
is the far field J, J
b
is the process zone J (analogous to J
plastic
), and J
tip
is the crack tip J. Also, it is
assumed that elastic action takes place at the crack tip, so J
tip
can be calculated from K
tip
using Eq 9. The value
of J
∞
was experimentally calculated from measurements using CT specimens with two different crack lengths,
a
1
and a
2
. The value J
∞
is the far-field J, as the crack grows from a
1
to a
2
. Therefore, J
b
was calculated from Eq
12 (Ref 63).
The J-parameter toughness has also been measured with CT specimens in a study conducted to compare the
toughness values of woven fabric-reinforced CMCs with different interphases (Ref 64). The value of J,
calculated from the experimental load-displacement curves at the point of maximum load, corresponds to
macrocrack initiation in the process zone (Ref 64).
Double Cantilever Beam (DCB) Testing. The DCB specimen looks like a long CT specimen. It can be loaded in
three different configurations: direct tension, constant bending moment, and wedge opening. The tensile-loaded
DCB is very similar to the CT in all respects (Fig. 7c), but the DCB geometry is better than the CT for growing
stable cracks. The tapered DCB, shown in Fig. 7(f), provides a constant K
I
level with crack growth. Another
DCB variant that provides a constant K
I
level with crack growth is the moment-loaded DCB (Fig. 7d).
Unfortunately, the fixturing that applies the moment to the arms of the DCB can be difficult to deal with. The
final DCB variant is the wedge-loaded DCB (Fig. 7e). The wedge loading allows the specimen to be tested in
simple compression. The wedge-loaded DCB specimen was first used in ASTM method E 561. All the DCB
variants may need side grooves to keep the crack moving down the center of the specimen. The grooves
complicate the K-calibration, and machining damage in the groove can affect the crack extension (Ref 58).
Specimens very similar to the constant bending moment DCB, called the Browne/Chandler test specimen, have
been employed in the determination of R-curves for monolithic ceramics (Ref 65). The Browne/Chandler
specimen geometry, shown in Fig. 9, applies loads to the outside corners of a specimen, supported by a stiff
solid base, that has a rectangular cross section and a vertical edge crack. This loading induces a bending
moment around the center of the specimen, which causes the crack to open and extend. If the applied load were
held constant, the stress intensity at the crack tip would decrease as the crack grew. Therefore, the load must
increase in order for crack growth to continue, which prevents unstable fracture. Also, crack-guiding side
grooves are not necessary because the compressive stress parallel to the crack keeps the crack growing down
the center of the specimen. Unfortunately, the Browne/Chandler test geometry does not lend itself to an
analytical solution of K-calibrations for all crack lengths. As a result, stress intensities have to be estimated
using numerical methods at both very short and very long crack lengths (Ref 65).
Fig. 9 Schematic sketch of the Browne/Chandler test geometry. Adapted from Ref 65
Chevron Notch Methods (CHV). The chevron notch is used in three specimens (Ref 58, 66). There is a short
rod CHV (Fig. 7g), a short rectangular bar CHV (Fig. 7h), and a bend bar with a rectangular cross section and a
chevron notch (Fig. 7i). The chevron notch geometry, due to the increase in the width of the crack surface
during crack extension, forces rising R-curve behavior in ideally brittle materials. This means that after crack
initiation, the crack front is stable and is always ideally sharp. Stable crack growth is not always found in
practice due to the fact that excess stored energy in the specimen can overcome the geometrical tendency to
force rising R-curve behavior. In these cases, the excess stored energy can cause catastrophic failure in the
specimen. As a result, a stiff specimen geometry and test machine are important (Ref 58, 66).
One of the main advantages of the chevron notch geometry is the fact that it is possible to calculate the fracture
toughness based on the maximum load and the specimen dimensions alone for ideally brittle materials. Due to
the shape of the growing crack, the geometry factor, Y, goes through a minimum as crack growth occurs. The
minimum in the geometry factor corresponds to the maximum load in the test. This unique fact allows the
fracture toughness to be calculated without knowledge of the crack length (Ref 58). However, calculation of
fracture toughness from the maximum load and specimen dimensions does not work for materials that exhibit
natural rising R-curve behavior. In these cases, the minimum in the geometry factor versus crack length does
not correspond with the maximum load, and the crack length must be known to calculate the fracture toughness
(Ref 58).
The chevron notch specimen has become almost a standard for measuring fracture toughness in ceramic
materials (Ref 58, 67, 68, and 69). In fact, the only ASTM standard test method for determining the fracture
toughness of ceramics, B 771-87, uses the short rod and short bar chevron notch specimen (Ref 69). In addition,
chevron notch samples are used in ASTM PS70, “Provisional Test Method For Determining The Fracture
Toughness of Advanced Ceramics at Ambient Temperatures” (Ref 66). Also, researchers with new fracture
tests use chevron notch results to benchmark the results of the new tests (Ref 61, 70, and 71).
Double Torsion (DT). The DT specimen, shown in Fig. 7(j), is a flat plate with a longitudinal through crack that
is loaded in torsion. The torsional loading applies a bending moment that opens the crack on the tensile surface
and closes the crack on the compressive surface. The applied moment causes the K
I
level to be constant over a
wide range of crack length. It also causes the crack front to be significantly curved between the top and bottom
surfaces. This curvature of the crack front opposes the straight-through crack assumptions used in the stress
intensity calculation, and causes errors in the toughness calculation (Ref 58).
Indentation Techniques. Indentation fracture toughness techniques utilize a sharp crack introduced in the
material by a Knoop or a Vickers indenter. The Knoop indenter causes a single crack, which makes it attractive
for use in fracture mechanics methods involving a surface flaw. The Vickers indenter creates two cracks that
are mutually perpendicular to each other. Both indentation methods can produce reproducible surface cracks,
but the residual stress field from the indentation is complicated and must be removed or accounted for in the
analysis (Ref 58, 72, 73, and 74)
Indentation creates subsurface cracks, due to tensile stress formation, just below the contact point of the
indenter. These subsurface cracks are called median cracks. As the indenter is removed, the median cracks
become unstable and grow to the indented surface. The resulting crack is called a radial crack. In some high-
toughness brittle systems, small radial surface cracks can form prior to subsurface median crack formation.
These shallow surface cracks are called Palmqvist cracks. Schematic drawings of median, radial, and Palmqvist
cracks are shown in Fig. 10 (Ref 58, 72, 73, 74).
Fig. 10 Schematic diagram illustrating types of crack systems formed around an indentation. Adapted
from Ref 42, 71
There are three indentation-induced crack techniques for measuring fracture toughness in ceramics: the
controlled surface flaw (CSF) technique, the indentation microfracture (IM) technique, and the indentation
strength in bending (ISB) technique. The CSF method can provide a quantitative measure of the fracture
toughness because the stress intensity around the surface flaw is well known, but the IM and ISB provide only
estimates based on empirical expressions (Ref 58, 72, 73,and 74).
The CSF method involves testing a bending specimen with an elliptical surface crack induced by a Knoop
indenter (see Fig. 7k). The Knoop indenter is used to create a subsurface median crack. Then, the surface is
carefully polished to remove the indent and the associated residual stresses. The polishing also reveals the
median crack to the surface, and an elliptical surface flaw with no residual stress is the result. When the
specimen is tested, the surface flaw causes the initiation of fracture, and K
Ic
can be calculated based on the
applied loads and the crack size (Ref 58, 73).
The ISB is similar to the CSF technique (Ref 73). The ISB approach uses the Vickers indenter to induce
median-radial cracks on the tensile surface of a bending specimen. Through manipulation of the K-calibrations
for the crack system, which account for both the applied and residual stresses, it is possible to develop an
expression that relates the fracture stress in bending and the indentation load to the fracture toughness.
Therefore, the ISB method involves calculating the fracture toughness based on the indentation load and the
experimental fracture stress from a bending test. This method has the advantage of being relatively simple to
conduct, and there is no need to measure crack size. The disadvantage comes from the use of empirical factors
in the manipulation of the K-calibrations that are used to develop the expression relating the indentation load
and fracture stress to the fracture toughness. This causes the fracture toughness measured by this method to be
only an estimate (Ref 58, 73).
Another fracture toughness specimen that uses a Vickers hardness indenter to introduce sharp cracks into a
ceramic material is the miniature disk bend test (MDBT) specimen (Ref 70, 75). These specimens are 3 mm
(0.1 in.) in diameter and range in thickness from 200 to 700 μm. Vickers indentation cracks are introduced into
the center of the tensile side of the specimen. The disk specimen is loaded in a ring-on-ring bending mode,
schematically shown in Fig. 11. The MDBT is similar to the ISB test. In both experiments, the fracture stress
and indentation load are related to the fracture toughness. Therefore, the fracture toughness is calculated from
the indentation load and the fracture stress from the MDBT. The advantages of the MDBT are the small amount
of material that is needed to conduct the test and the fact that the crack length need not be measured (Ref 70,
75).
Fig. 11 Schematic sketch of the miniature disk bend test (MDBT) geometry. Adapted from Ref 70
The indentation microfracture (IM) method introduces cracks into the surface of a sample with a Vickers
indenter and uses the length of those cracks to estimate the fracture toughness (Ref 58, 72). This method is very
attractive because it is so easy to conduct the test. As a result, many good empirical toughness relations have
been generated for specific crack geometries. It is important in this method to ensure that median-radial cracks
are analyzed rather than Palmqvist cracks. The shallow Palmqvist cracks are hard to measure, and,
consequently, significant error and scatter are introduced in the data (Ref 58, 71).
Typical Fracture Toughness Properties of Ceramics and CMCs. The critical fracture toughness, K
Ic
, of
monolithic ceramics is low, on the order of 1 to 4 MPa (0.9 to 3.5 ksi ), while CMCs can have
toughness values near 20 MPa (18 ksi ). The K
Ic
values for several ceramics and a few CMCs are
shown in Table 1. Where possible, the values of K
Ic
measured by different methods on the same material are
included for comparison. From the table, it is evident that the many methods agree well.
Table 1 Typical ceramic and CMC properties
Material
K
Ic
(MPa )
Method
Reference
2.7 CSF
72
2.5 DCB
72
2.9 ISB
73
2.4 CMDCB
50
Glass ceramic pyroceram (Corning)
2.2 MDBT
70
2.6 CSF
72
3.9 DCB
72
Al
2
O
3
AD999 (Coors)
3.1 ISB
73
4 CSF
50
2.1 CSF
72
2.9 DCB
72
Al
2
O
3
AD90 (Coors)
2.8 ISB
73
1.6 CSF
72
2.1 DCB
72
Al
2
O
3
sapphire (Coors)
3 ISB
73
4 CSF
72
4 DCB
72
5 ISB
73
Si
3
N
4
NC132 (Norton)
4.6 CSF
50
2.1 CSF
72
2 DCB
72
Si
3
N
4
NC350 (Norton)
2.1 ISB
75
Si
3
N
4
NBD200 (Norton) 5.4 CSF
50
Si
3
N
4
NT154 (Norton) 5.8 CSF
50
Si
3
N
4
5 MDBT
70
3.5 CSF
72
4 DCB
72
SiC NC203 (Norton)
4.5 ISB
73
3 CN, CSF
50
3.3 SENB
68
α-SiC (Carborundum)
2.7 CN
68
NiAl polycrystalline 1.75 MDBT
75
Y-PSZ 3.6 SENB
59
6.8 SENB
68
SiC/TiB
2
composite
4.1 CN 68
CMDCB, constant moment double cantilever beam; CN, chevron notch; CSF, controlled surface flaw; DCB,
double cantilever beam; ISB, indentation strength in bending; MDBT, miniature disk bend test; SENB, single
edge notch bend
Ceramics can exhibit either flat or rising R-curve behavior, depending on processing-derived microstructure
(Ref 67). Figure 12 shows R-curves for three different silicon nitride (Si
3
N
4
) materials, A, B, and C. The R-
curves were measured using short bar chevron notch methods. Material A is a hot pressed commercial Si
3
N
4
(SN-84H by NGK Technical Ceramics) with low fracture toughness; it results in flat R-curve behavior.
Materials B and C, which have relatively higher fracture toughness, are monolithic Si
3
N
4
(AS700 by Allied
Signal Inc.) prepared by gas pressure sintering green billets, which were formed by cold isostatic pressing.
These two Si
3
N
4
materials exhibit rising R-curve behavior (Ref 67).
Fig. 12 R-curves of three Si
3
N
4
ceramic materials measured by the short rod chevron notch technique.
Adapted from Ref 67
An R-curve from short bar chevron notch tests on a SiC-whisker-reinforced alumina matrix composite is
presented in Fig. 13 (Ref 67). The whisker-reinforced alumina composite also exhibits rising R-curve behavior.
Fig. 13 Rising R-curve of a SiC whisker reinforced alumina ceramic matrix composite (CMC), measured
by the double cantilever beam technique. Adapted from Ref 67
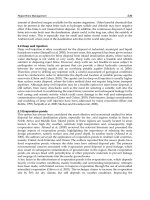
The rising R-curve behavior of an isostacally pressed and sintered ceria-partially stabilized zirconia (Ce-PSZ)
ceramic is given in Fig. 14 (Ref 61). This R-curve was measured using a crack line wedge-loaded (CLWL)
technique, which is a wedge-loaded variant of the compact tension specimen.
Fig. 14 Rising R-curve of a Ce-PSZ ceramic measured by the crack line wedge loaded technique. a and w
refer to dimensions defined in Fig. 7(c). Adapted from Ref 61
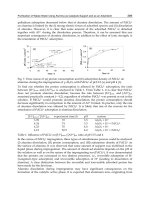
Table 2 presents critical toughness expressed in terms of the J-integral, J
c
, for short Nicalon fiber-reinforced
foam glass matrix composites (Ref 63). Values for J
c
range from 3.5 to 241.8 N/m, depending on fiber length
and fiber volume fraction. The interface condition also strongly affects the value of J
c
(Ref 64). Table 3 shows a
wide range of J
c
values for continuous woven Nicalon fiber fabric-reinforced SiC matrix composites produced
by chemical vapor infiltration. In Table 3, the interface condition is given an arbitrary designation of numbers
from one to ten. The interfaces of these composites were modified by applying various multilayered carbon and
SiC fiber coatings, the details of which are can be found in Ref 64. Table 3 clearly shows that the interface
condition causes the value of J
c
to vary over a wide range from 11800 to 28520 N/m. Also notice that the
values of J
c
for the materials of Tables 2 and 3 are quite different. This fact indicates that composite constituent
materials, volume fractions, and interfacial properties all have a very pronounced effect on the toughness of
CMCs.
Table 2 J
c
values for short Nicalon fiber reinforced foam glass matrix composites
Fiber length, mm
Fiber volume fraction, %
J
c
, N/m
3 1.0
61.6
6 1.0
147.5
13 0.1
3.5
13 0.2
14.8
13 0.8
210.0
13 1.0 241.8
Source: Ref 63
Table 3 J
c
values for continuous Nicalon fiber fabric reinforced SiC composites
Interface condition
J
c
, N/m
1
11,800
2
19,200
3
19,400
4
24,700
5
10,700
6
18,900
7
15,650
8
19,340
9
14,400
10 28,520
Source: Ref 64
References cited in this section
42. C.B. Thomas, “Processing, Mechanical Behavior, and Microstructural Characterization of Liquid Phase
Sintered Intermetallic-Bonded Ceramic Composites,” M.S. Thesis, The University of Tennessee,
Knoxville, 1996
49. M. Sakai and H. Ichikawa, Work of Fracture of Brittle Materials with Microcracking and Crack
Bridging, Int. J. Fract., Vol 55 (No. 1), 1992, p 65–79
50. J.B. Quinn and G.D. Quinn, “Indentation Brittleness of Ceramics: A Fresh Approach,” J. Mater. Sci.,
Vol 32 (No. 16), 1997, p 4331–4346
58. M. Sakai and R.C. Bradt, Fracture Toughness Testing of Brittle Materials, Int. Mater. Rev., Vol 38 (No.
2), 1993, p 53–78
59. J.Y. Pastor, J. Llorca, J. Planas, and M. Elices, Stable Crack-Growth in Ceramics at Ambient and
Elevated-Temperatures, J. Eng. Mater. Technol. (Trans. ASME), Vol 115 (No. 3), 1993, 281–285
60. V.G. Borovik, V.M. Chushko, and S.P. Kovalev, Computer-Aided, Single-Specimen Controlled
Bending Test for Fracture-Kinetics Measurements in Ceramics, J. Am. Ceram. Soc., Vol 78 (No. 5),
1995, p 1305–1312
61. J.C. Descamps, A. Poulet, P. Descamps, and F. Cambier, A Novel Method to Determine the R-Curve
Behavior of Ceramic Materials—Application to a Ceria-Partially Stabilized Zirconia, J. Eur. Ceram.
Soc., Vol 12 (No. 1), 1993, p 71–77
62. V. Kostopoulos and Y.P. Markopoulos, On the Fracture Toughness of Ceramic Matrix Composites,
Mater. Sci. Eng. A, Vol 250 (No. 2), 1998, p 303–312
63. T. Hashida, V.C. Li, and H. Takahashi, New Development of the J-Based Fracture Testing Technique
for Ceramic-Matrix Composites, J. Am. Ceram. Soc., Vol 77 (No. 6), 1994, p 1553–1561
64. C. Droillard and J. Lamon, Fracture Toughness of 2-D Woven SiC/SiC CVI-Composites with
Multilayered Interphases, J. Am. Ceram. Soc., Vol 79 (No. 4), 1996, p 849–858
65. H.W. Chandler, R.J. Henderson, M.N. Al Zubaidy, M. Saribiyik, and A. Muhaidi, A Fracture Test for
Brittle Materials, J. Eur. Ceram. Soc., Vol 17 (No. 6), 1997, p 759–763
66. “Provisional Test Method For Determining The Fracture Toughness Of Advanced Ceramics At Ambient
Temperatures,” ASTM PS70, Annual Book of Standards, Vol 15.01, American Society for Testing and
Materials, 1996
67. D.J. Lee, Simple Method to Measure the Crack Resistance of Ceramic Materials, J. Mater. Sci., Vol 30
(No. 8), 1995, p 4617–4622