Volume 17 - Nondestructive Evaluation and Quality Control Part 19 ppt
Bạn đang xem bản rút gọn của tài liệu. Xem và tải ngay bản đầy đủ của tài liệu tại đây (1.7 MB, 80 trang )
Fig. 2
Schematic of distribution of detection probabilities for cracks of fixed
length
Equation 1 implies that the POD(a) function is the curve through the averages of the individual density functions of the
detection probabilities. This curve is the regression equation and provides the basis for testing assumptions about the
applicability of various POD(a) models. In Ref 4, seven different functional forms were tested for applicability to
available POD data, and it was concluded that the log-logistics (log odds) function best modeled the data and provided an
acceptable model for the data sets of the study. Note that the log odds model is commonly used in the analysis of binary
(hit/miss) data because of its analytical tractability and its close agreement with the cumulative log normal distribution
(Ref 8).
Two mathematically equivalent forms of the log odds model have subsequently been used. The earliest form is given by:
(Eq 2)
This parametrization can also be expressed as:
(Eq 3)
In the Eq 3 form, the log of the odds of the probability of detection (the left-hand side of Eq 3) is expressed as a linear
function of ln (a) and is the source of the name of the log odds model. Note that given the results of a large number of
independent inspections of a large number of cracks, the parameters of the model can be fit with a regression analysis. As
an example, Fig. 3 shows Eq 3 fit to the data of Fig. 1. This regression approach will not be discussed further, because the
maximum likelihood estimates (see the section "Analysis of Hit/Miss Data" in this article) can be applied to much smaller
samples of inspection results and can give equivalent answers for large sample sizes.
Fig. 3 Example linear relation between log odds of crack detection and log crack size
Although the parametrizations of Eq 2 and 3 are sensible in terms of estimation through regression analyses, and are
not easily interpretable in physical terms. A mathematically equivalent form of the log odds POD(a) model is given by
(Ref 8):
(Eq 4)
In this form, μ= ln a
0.5
, where a
0.5
is the flaw size that is detected 50% of the time, that is, the median detectable crack
size. The steepness of the POD(a) function is inversely proportional to ; that is, the smaller the value of σ, the steeper
the POD(a) function. The parameters of Eq 2 and 4 are related by:
(Eq 5)
(Eq 6)
The log odds POD(a) function is practically equivalent to a cumulative log normal distribution with the same parameters,
μ and σ of Eq 4. Figure 4 compares the log odds and cumulative log normal distribution functions for μ= 0 and σ= 1.
Equation 4 is the form of the log odds model that will be used in the section "Analysis of Hit/Miss Data" in this article.
Fig. 4 Comparison of log odds and cumulative log normal models
POD(a) From Signal Response Data. The NDE flaw indications are based on interpreting the response to a
stimulus. In eddy current or ultrasonic systems, the response might be a peak voltage referenced to a calibration. In
fluorescent penetrant inspections, the response would be a combination of brightness and size of the indication. Assume
the response can be quantified and recorded in terms of a parameter, , that is correlated with flaw size. Then
summarizes the information for determining if a positive flaw indication will be given. Only if exceeds a defined
decision threshold,
dec
, will a positive indication be given.
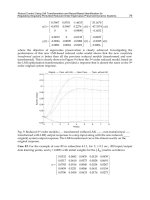
As an example of the concept, Table 2 summarizes the results of highly automated eddy current inspections of 28 cracks
in flat plate specimens. The three data sets resulted from the use of three probes, with all other factors held constant. The
values in Table 2 are the depth of each crack and the peak voltage in counts recorded by the system. Figure 5 shows a plot
of the versus a data for probe A. No signal was recorded for 2 of the cracks, because their values were below the
recording signal threshold,
th
. These points are indicated by a down arrow at
th
, indicating that the response was at an
indeterminable value below the recording signal threshold. Similarly, for 5 of the cracks exceeded the saturation limit,
sat
, of the recording system. These points are indicated by an up arrow at
sat
, indicating that the response was at an
indeterminable value above the recording saturation limit. In Fig. 5, the decision threshold is set at 250 counts. Only those
cracks whose value is above 250 would have been flagged (detected).
Table 2 Example of a summary data sheet of versus a data
The example is based on eddy current inspections of flat plates.
Crack depth
Peak voltage in counts
Crack identification
mm
in. Probe A
Probe B
Probe C
11 0.33
0.013
1052 884
1282
30 1.40
0.055
4095 4095
3831
42 0.38
0.015
1480 1182
1699
2 0.25
0.010
723 624
840
21 0.74
0.029
4095 4095
2249
13 0.48
0.019
2621 2401
1101
19 0.30
0.012
377 809
350
26 0.23
0.009
223 205
277
15 0.56
0.022
1654 3319
1289
29 1.65
0.065
4095 4095
2648
33 0.08
0.003
(a)
(a)
(a)
25 0.25
0.010
669 565
824
32 0.18
0.007
374 379
407
34 0.03
0.001
(a)
(a)
(a)
39 0.18
0.007
409 387
586
12 0.28
0.011
895 690
677
38 0.20
0.008
374 301
549
20 0.79
0.031
4095 4095
1778
28 0.23
0.009
638 454
782
27 0.15
0.006
533 385
631
1 0.08
0.003
150 136
135
35 0.28
0.011
749 660
989
40 0.20
0.008
433 378
591
31 0.36
0.014
879 888
1402
3 0.23
0.009
286 211
352
7 0.23
0.009
298 163
215
16 0.41
0.016
1171 1110
1628
37 2.54
0.100
4095 4095 4095
(a)
Peak voltage below the recording level threshold
Fig. 5 Example inspection signal response as a function of crack depth
The POD(a) function can be obtained from the relation between and a. If g
a
( ) represents the probability density of the
values for fixed crack size a, then:
(Eq 7)
This calculation is illustrated in Fig. 6, in which the shaded area under the density functions represents the probability of
detection.
Fig. 6 Schematic of POD(a) calculation from versus a relation
In general, the correlating function between and a defines the mean of g
a
( ), that is:
= (a) +
(Eq 8)
where (a) is the mean of g
a
( ) and is a random error term accounting for the differences between and (a). The
distributional properties of δ determine the probability density g
a
( ) about μ (a), as will be shown.
In the data analyzed to date, a linear relation between ln ( ) and ln (a) with normally distributed deviations has proved
satisfactory (for example, Fig. 5). This model is expressed by:
ln ( ) =
0
+
1
ln (a) +
(Eq 9)
where δ is normally distributed with zero mean and constant standard deviation, . Data have been observed that flatten
at the large crack sizes. However, because the decision threshold was far below the non-linear range, restricting the range
of cracks to smaller sizes permitted the application of Eq 9. The normality of has proved to be an acceptable
assumption.
Assuming that the versus a relation is modeled by Eq 9 and that is normally distributed with zero mean and standard
deviation of , the POD(a) function is calculated as:
(Eq 10)
where is the standard normal distribution function. Using the symmetry properties of , Eq 10 can be reduced to:
(Eq 11)
Equation 11 is a cumulative log normal distribution function with mean and standard deviation of log crack length given
by:
(Eq 12)
(Eq 13)
In the section "Signal Response Analysis" in this article, maximum likelihood methods for estimating β
0
, β
1
, and σ from
versus a data will be presented. Note that the values below the recording threshold and above the saturation limit must
be properly accounted for in these analyses. Note also that data from multiple inspections of the same cracks require
analysis methods that are dependent on the design of the reliability experiment. Methods for placing lower confidence
bounds on the estimated POD(a) function using the sampling distributions of the maximum likelihood estimates of β
0
, β
1
,
and are also included in the section "Signal Response Analysis."
References cited in this section
3.
W.H. Lewis, W.H. Sproat, B.D. Dodd, and J.M. Hamilton, "Reliability of Nondestructive Inspections
Final
Report," SA-ALC/MME 76-6-38-1, San Antonio Air Logistics Center, Kelly Air Force Base, Dec 1978
4.
A.P. Berens and P.W. Hovey, "Evaluation of NDE Reliability Characterization," AFWAL-TR-81-
4160, Vol
1, Air Force Wright-Aeronautical Laboratories, Wright-Patterson Air Force Base, Dec 1981
5.
A.P. Berens and P.W. Hovey, Statistical Methods for Estimating Crack Detection Probabili
ties, in
Probabilistic Fracture Mechanics and Fatigue Methods: Applications for Structural Design and
Maintenance,
STP 798, J.M. Bloom and J.C. Ekvall, Ed., American Society for Testing and Materials, 1983,
p 79-94
6.
D.E. Allison et al., "Cost/Risk Analysis for Disk Retirement Volume I," AFWAL-TR-83-
4089, Air Force
Wright-Aeronautical Laboratories, Wright-Patterson Air Force Base, Feb 1984
7.
A.P. Berens and P.W. Hovey, "Flaw Detection Reliability Criteria, Volume I
Methods and Results,"
AFWAL-TR-84-4022, Air Force Wright-Aeronautical Laboratories, Wright-
Patterson Air Force Base, April
1984
8.
D.R. Cox, The Analysis of Binary Data, Methuen and Co., 1970
NDE Reliability Data Analysis
Alan P. Berens, University of Dayton Research Institute
Design of NDE Reliability Experiments
An NDE reliability experiment comprises a test matrix of inspections on a set of specimens with known flaw locations
and sizes. The specimens are inspected under conditions that simulate as closely as practical the actual application
conditions. The experimental design determines the test matrix, and there are four major analysis concerns to be
addressed in the experimental design. These are:
• The method of controlling the factors to be evaluated in the experiment
• The method of accounting for the uncontrolled factors in the experiment
• The number of flawed and unflawed inspection sites
• The sizes of the flaws in the specimens
These topics are addressed in the following sections.
Controlled and Uncontrolled Factors
The primary objective of NDE reliability experiments has been to demonstrate efficacy for a particular application by
estimating the POD(a) function and its lower 95% confidence bound. (Although NDE reliability experiments can also be
conducted to optimize a system, analyses to meet this objective are beyond the scope of this article.) To demonstrate
capability, it is assumed that the protocol for conducting the inspections is well defined for the application, that the
inspection process is under control (hit/miss decisions are stable over time), and that all other factors introducing
variability into the inspection decision will be representative of the application. The representativeness of these other
factors can be ensured either by controlling the factors during the inspection or randomly sampling the factors to be used
in the experiment. The methods of accounting for these factors are important aspects of the statistical design of the
experiment and significantly influence the statistical properties of the estimates of the POD(a) function parameters. Of
particular note in this regard is that k inspections on n flaws is not equivalent to inspections on n · k different flaws, even
if the inspections are totally independent.
The most important of the factors introducing variation are:
• Differences in physical properties of cracks of nominally identical sizes
•
The basic repeatability of the magnitude of the NDE signal response when a specific crack is
independently inspected by a single inspector using the same equipment
•
The summation of all the human factors associated with the particular inspectors in the population of
interest
• Differences introduced by changes in inspection hardware
These factors must be addressed explicitly or implicitly in every NDE reliability experiment.
In general, the specimens used in NDE reliability experiments are very expensive to obtain and characterize in terms of
the sizes of the flaws in the specimens. Therefore, each experiment is based on one set of specimens containing flawed
and unflawed inspection sites. Because the results are significantly influenced by the specimens, it must be assumed that
the flaws are representative of those that will be present in the structural application. If other factors are to be included in
the experiment, they will be based on repeated inspections of the same flaws. From a statistical viewpoint, this restriction
on the experimental design limits the sample size to the number of flaws in the specimen set. Because different cracks of
the same size can have significantly different crack detection probabilities, multiple inspections of the same crack provide
information about the detection probability of only that crack.
The generality of the capability characterization is limited to the application for which the experiment is representative.
Either important factors must be typical of the application or random samples must be chosen from the population of
interest and repeat inspections performed for these factors. For example, if a single inspector is used to characterize a
fluorescent penetrant inspection, it must be assumed that this inspector is typical of all the inspectors in the shop. An
alternative might be to choose a random sample of inspectors from the total pool and have each of the selected inspectors
perform the experiment.
Depending on the application of the results of the experiment, stratified sampling may be required to obtain a
representative sample. For instance, if the capability will apply to two facilities and one of them inspects twice as many
components as the other, then that facility should have twice as many inspectors in the experiment. An alternative method
is to characterize each facility independently. Care is then required in combining the results for the joint characterization.
Factorial Experiments for Hit/Miss Data. The analysis for the hit/miss data requires that all factors be balanced in
any one analysis. When practical, this can be most easily achieved by performing complete factorial experiments. For
example, Table 1 contains the results of a two-factor experiment, with the factors being cracks and inspectors. These data
can be analyzed as one data set with three inspections per crack. The resulting POD(a) function and its confidence bound
would be representative of the population of inspectors from which the sample was drawn.
If the effect of a third factor, for example, different lots of penetrants, were to be included, the entire experiment would be
repeated for each of the lots chosen at random from the population of all lots. If three lots were sampled, a total of nine
inspections would be performed on each of the flawed specimens, and the resulting POD(a) would apply to the entire
inspection process. Suppose, however, that the second and third samples of penetrant were used only by Inspector A. In
this case, the two additional sets of inspection data cannot be combined with the other three in a single analysis, because
the triple representation of Inspector A would bias the resulting POD(a) function toward his specific capability. The three
sets of inspection results for Inspector A can be combined, but the range of applicability of the answer is limited to
Inspector A (unless it can be shown or assumed that Inspector A is representative of the entire population).
When many factors must be considered, the number of possible combinations in a factorial experiment can easily become
prohibitive. More sophisticated experimental designs (fractional replications, for example) may then be required. In such
cases, the assistance of a professional statistician is recommended.
Experimental Design for Data. Inspection-result data in the form contain considerably more information than
hit/miss data and, as a consequence, permit more flexibility in the design of the experiment. In analysis, the parameters
of the POD(a) function are estimated from the slope, intercept, and standard deviation of residuals of the ln ( ) versus ln
(a) relation, as given by Eq 9, 12, and 13. In Eq 9, can be considered to be the sum of random effects, and experiments
can be designed to estimate the components of the total variation in . For example, operators, probes, and repeatability
can be jointly evaluated in a factorial experiment and their effects accounted for in the estimate of POD(a). The statistical
model for this experiment would be:
ln ( ) = β
0
+ β
1
ln (a) + C
i
+ O
j
+ P
k
+ R
l
+ (interaction terms)
(Eq 14)
where C
i
, O
j
, P
k
, and R
l
are the random effects due to cracks, operators, probes, and repeats, respectively. The random
term, δ of Eq 9, is the sum of all random effects. It can be assumed that the mean and variance of random effect X are zero
and , respectively. Then:
= + + + + . . .
(Eq 15)
Therefore, β
0
and β
1
can be estimated from a regression analysis, and can be estimated from the components of
variance using the expected mean squares for the random effects.
In principle, any statistical design from which the components of variance can be estimated can be used in an NDE
reliability experiment. However, the analysis methods would be specific to the particular design, and it is beyond the
scope of this article to address the general problem. In the section "Signal Response Analysis" in this article, it will be
assumed that only the variation due to cracks and one other factor is being investigated. It is recommended that the
assistance of a qualified statistician be obtained for more sophisticated experimental designs.
Sample Sizes and Flaw Sizes
Sample sizes in NDE reliability experiments are driven more by the economics of specimen fabrication and
characterization than by the desired degree of precision in the estimate of the POD(a) function. Although apparently
reasonable POD(a) functions can often be obtained from applying the maximum likelihood analysis to relatively few test
results, the confidence bound calculation is based on asymptotic (large sample) properties of the estimates. It should be
emphasized that the calculations can also produce totally unacceptable results from the relatively few test results or from
data that are not reasonably represented by the assumptions of the models. Therefore, there are minimal sample size
requirements that must be met to provide a degree of reasonable assurance in the characterization of the capability of the
system.
Larger sample sizes in NDE reliability experiments will, in general, provide greater precision in the estimate of the
POD(a) function. However, the sample size is determined from the number of cracks in the experiment, and there is a
coupling with the flaw sizes that must also be considered. The effect of this coupling manifests itself differently for the
hit/miss and analyses.
Sample Size Requirements for Hit/Miss Analysis. Data from hit/miss experiments are generally not amenable to
testing assumptions regarding the form of the POD(a) model. These tests require either large numbers of independent
inspections on each flaw of a specimen set or inspection results from an extremely large number of compatible specimens
(Ref 3, 4). Number and size considerations in hit/miss experiments are directed at their effect on the sampling properties
of the parameters of the POD(a) function (Ref 9).
In the hit/miss analysis, the output of an inspection states only whether or not a crack of known length was found in the
inspection (Table 1). There are probabilities associated with the outcomes, and the analysis assumes that this probability
increases with flaw size. Because it has been assumed that the inspection process is in a state of control, there is a range of
flaw sizes over which the POD(a) function is rising. In this flaw size range of uncertainty, the inspection system has
limited discriminating power in the sense that detecting or failing to detect would not be unusual. Such a range might be
defined by the interval (a
0.10
, a
0.90
), where a
p
denotes the flaw size that has probability of detection equal to p; that is:
POD(a
p
) = p
(Eq 16)
Flaws smaller than a
0.10
would then be expected to be missed, and flaws greater than a
0.90
would be expected to be
detected.
In a hit/miss reliability experiment, flaws outside the range of uncertainty do not provide as much information concerning
the POD(a) function as cracks within this range. Cracks in the almost-certain detection range and almost-certain miss
range provide very little information concerning probability of detection. Therefore, in the hit/miss experiment, not all
flaws convey the same amount of information, and the effective sample size is not necessarily the total number of flaws in
the experiment. Adding a large number of very large flaws does not increase the precision in the estimate of the
parameters of the POD(a) function.
In a reliability experiment, the location of the increasing range of the POD(a) function is not known. Further, the same
sets of specimens are often used in many different experiments. Therefore, it is not possible to fabricate a set of
specimens with optimal flaw sizes for a particular experiment. To minimize the chances of completely missing the crack
size range of maximum information and to accommodate the multiple uses of specimens, flaw sizes should be uniformly
distributed between the minimum and maximum of the sizes of potential interest. A minimum of 60 flaws should be
distributed in this range, but as many as economically possible should be used.
Sample Size Requirements for Analysis. The recorded signal response, , provides significantly more
information for analysis. In particular, the POD(a) model is derived from the correlation of the versus a data, and the
assumptions concerning the POD(a) model can be tested using the signal response data. Further, the pattern of
responses can indicate an acceptable range of extrapolation. Therefore, the range of crack sizes in the experiment is not as
critical in an analysis as in a hit/miss analysis. For example, if the decision threshold in Fig. 5 were set at 250 counts, all
but four of the cracks would have been detected. The larger cracks would have provided little information about the
POD(a) function in a hit/miss analysis. In an analysis, however, all of the recorded values provided full information
concerning the relation between signal response and crack size, and the values at the signal threshold and saturation limit
provided partial information. The linearity of the fit, the normality of the deviations, and the constancy of the residual
variation can all be easily evaluated from the versus a plot.
Because of the added information in the data, it is recommended that at least 30 flaws be present in experiments whose
results can be recorded in this form. Increasing the number of flaws increases the precision of the estimates, so the test set
should contain as many flawed specimens as economically feasible.
Unflawed Inspection Sites. In the context of the analyses presented in this section, sample size refers to the number
of known flaws in the specimens to be inspected. The total specimen set should also contain at least twice this number of
unflawed inspection sites. The unflawed sites are necessary to ensure that the NDE procedure is discriminating between
flawed and unflawed sites and to provide an estimate of the false call rate.
Although the false call rate can have important economic consequences, the NDE reliability analyses in this section were
dictated by the requirements of damage tolerance analyses. The primary objective was to estimate the chances of missing
flaws that might lead to structural failures. The concepts of these NDE reliability analyses can be generalized to include a
non-zero probability of a flaw indication when no flaw is present at an inspection site, that is, POD(a = 0) > 0.
References cited in this section
3.
W.H. Lewis, W.H. Sproat, B.D. Dodd, and J.M. Hamilton, "Reliability of Nondestructive Inspections
Final
Report," SA-ALC/MME 76-6-38-1, San Antonio Air Logistics Center, Kelly Air Force Base, Dec 1978
4.
A.P. Berens and P.W. Hovey, "Evaluation of NDE Reliability Characterization," AFWAL-TR-81-
4160, Vol
1, Air Force Wright-Aeronautical Laboratories, Wright-Patterson Air Force Base, Dec 1981
9.
A.P. Berens and P.W. Hovey, The Sample Size and Flaw Size Effects in NDI Reliability Experiments, in
Review of Progress in Quantitative Nondestructive Evaluation 4B,
D.O. Thompson and D.E. Chimenti, Ed.,
Plenum Press, 1985
NDE Reliability Data Analysis
Alan P. Berens, University of Dayton Research Institute
Maximum Likelihood Analysis
Parameter estimation based on the principle of maximizing the likelihood of an observed sample of data is a standard
statistical technique and is amply described in the literature (Ref 10, 11). The purpose of this section is to summarize the
method and its asymptotic sampling distribution properties in the context of analyzing NDE reliability data. Further, a
method for using this information to calculate lower confidence bounds on the POD(a) function is also presented.
Parameter Estimation. Let X
i
represent the outcome of the ith inspection and f(X
i
;θ) represent the probability of
obtaining X
i
, where θ= (θ
1
, θ
2
,. . .θ
k
)' is the vector of the k parameters in the probability model. For example, in a hit/miss
experiment, X
i
would be 0 or 1 with probability defined by Eq 4, where a is the size of flaw i and θ= (μ,σ)'. In an versus
a experiment, X
i
is the log of the signal response, and f(X
i
;θ) is a normal density function with mean and standard
deviation given by θ= (β
0
+ β
1
ln a, σ )', as defined in Eq 9. Let X
1
,. . ., X
n
represent the results of independent inspections
of n flaws. The likelihood, L, of a specific result is given by the likelihood function:
(Eq 17)
For a given outcome of the experiment, X
i
is known and Eq 17 is a function of θ. The maximum likelihood estimate is the
value, , which maximizes L(θ). For the models considered here, it is more convenient to work with the log L(θ):
log L( ) = log f(X
i
; )
(Eq 18)
which is also maximized at . The maximum likelihood estimates are given by the solution of the k simultaneous
equations:
(Eq 19)
Asymptotic Sampling Distribution Properties. For the models being used in NDE reliability studies, the
maximum likelihood estimates are invariant, consistent, and efficient. Further, they are asymptotically joint normally
distributed with means given by the true parameter values, θ
i
, and the variance-covariance matrix defined by:
V = I
-1
(Eq 20)
where I is the information matrix whose elements I
ij
are the expected (E) values:
(Eq 21)
In application, the maximum likelihood estimate, , is substituted for θ in Eq 21. Therefore, given the results of
inspecting a large number of flaws and a specific function for the POD(a) model, the parameters of the model can be
estimated, and the sampling distribution of the parameters will be joint normal with the known variance-covariance
matrix. Examples of these equations for the hit/miss and response signal models are given in the sections "Analysis of
Hit/Miss Data" and "Signal Response Analysis," respectively, in this article. In these applications, the assumed models
will be the log odds and cumulative log normal distribution functions. However, other models can also be used if
evidence is available to support their selection.
Confidence Bounds on the POD(a) Function. Because the POD(a) function is equivalent to a cumulative
distribution function and the parameters are being estimated by maximum likelihood, a procedure developed by Cheng
and Iles (Ref 12 and 13) can be used to place lower confidence bounds on the POD(a) function. Such bounds are
calculated from the variance-covariance matrix of the estimates and reflect the sensitivity of the experiment to both the
number and sizes of flaws in the specimens of the experiment.
The assumed POD(a) model is a cumulative log normal distribution function with parameters θ= (μ,σ)'. For distribution
functions defined by location and scale parameters (as is the case of the log normal distribution), the information matrix
can be written in the form:
(Eq 22)
where n is the number of cracks in the experiment. The lower one-sided confidence bound of the POD(a) function is
given by:
POD (a) = ( - h)
(Eq 23)
where (z) is the standard cumulative normal distribution, and:
(Eq 24)
(Eq 25)
where is obtained from Table 3 for the number of cracks in the experiment and the desired confidence level.
Table 3 Values of for lower confidence bounds on the POD(a) function
Confidence level, %
Sample size
90 95
99
20 3.903
5.243
8.401
25 3.884
5.222
8.376
30 3.871
5.208
8.359
40 3.855
5.191
8.338
50 3.846
5.180
8.325
60 3.839
5.173
8.317
80 3.831
5.165
8.306
100 3.827
5.159
8.300
3.808
5.138
8.273
References cited in this section
10.
H. Cramer, Mathematical Methods of Statistics, Princeton University Press, 1946
11.
J.F. Lawless, Statistical Models and Methods for Lifetime Data, John Wiley & Sons, 1982
12.
R.C.H. Cheng and T.C. Iles, Confidence Bands for Cumulative Distribution Functions of Continuous
Random Variables, Technometrics, Vol 25 (No. 1), Feb 1983, p 77-86
13.
R.C.H. Che
ng and T.C. Iles, One Sided Confidence Bands for Cumulative Distribution Functions,
Technometrics, Vol 32 (No. 2), May 1988, p 155-159
NDE Reliability Data Analysis
Alan P. Berens, University of Dayton Research Institute
Analysis of Hit/Miss Data
Estimation of the parameters of the log odds model for hit/miss data is based directly on the probability of each 0 or 1
result of an inspection. Assume that a balanced experiment has produced k inspections on each of n cracks. For this
application, the likelihood function is given by:
(Eq 26)
where Z
ij
= 0 or 1 for the jth inspection of the ith flaw producing a miss or a find, respectively, and the probability of
detecting a flaw of size a
i
is given by:
(Eq 27)
(Eq 28)
This form of the POD(a) function is simply a more convenient algebraic form of Eq 4. The vector of parameters to be
estimated is defined by θ= (μ,σ)'.
The log likelihood equation is:
(Eq 29)
Parameter Estimation in Hit/Miss Analysis. The maximum likelihood estimates are given by the solution to:
(Eq 30)
(Eq 31)
Taking the derivatives and simplifying yields:
(Eq 32)
(Eq 33)
Any standard computational method, such as the Newton-Rhapson iterative procedure (Ref 14), can be used to find the
solutions to Eq 32 and 33.
Because iterative techniques converge to local maxima, the solution to Eq 32 and 33 may be sensitive to the initial values.
A set of initial values based on the method of moments has been found to be useful (Ref 7). These are given by:
(Eq 34)
(Eq 35)
where X
1
,. . .,X
n
are the ordered values of the natural logs of the flaw sizes and p
i
is the observed percentage of detections
of the ith ordered flaw size. If convergence is not obtained, increasing the initial estimate of a has often provided
convergence. However, Eq 32 and 33 are not always solvable. This will be discussed further in the section "Comments on
Hit/Miss Analysis" in this article.
Confidence Bound Calculation in Hit/Miss Analysis. The information matrix is estimated from Eq 21, using
and for and . For this POD(a) model, the elements of the information matrix are given by:
(Eq 36)
(Eq 37)
(Eq 38)
Note that k
0
, k
1
, and k
2
, the parameters required in the calculation of the lower confidence bound on the POD(a) function,
are also defined by Eq 36, 37, and 38. All of the parameters required by Eq 23, 24, and 25 to calculate the lower
confidence bound on the POD(a) function are available.
Hit/Miss Analysis Examples. As examples of the application of the method to real data, the parameters of the log
odds POD(a) function were obtained for the data in Table 1. Table 4 presents a summary of the parameters of the POD(a)
function for each data set of Table 1 and the combination of the three data sets in a single analysis. Figure 7 shows the
POD(a) function and the lower 95% confidence bound for Inspector A and the same information when the data from the
three inspectors are combined. Adding inspections of the same cracks did not increase the precision of the estimate of the
POD(a) function. Figure 8 compares the POD(a) functions for the three inspectors and the composite.
Table 4 POD(a) parameters for the hit/miss data in Table 1
Inspector Parameter
A B C
Composite
0.96 1.11 0.82
0.96
0.59 1.04 0.87
0.88
a
50
, mm (in.)
(a)
2.62 (0.103)
3.03 (0.119)
2.27 (0.089)
2.61 (0.103)
a
90
, mm (in.)
(b)
5.34 (0.210)
10.6 (0.417)
6.54 (0.257)
7.18 (0.283)
a
90/95
, mm (in.)
(c)
21.6 (0.850)
232 (9.13) 38.8 (1.53) 51.0 (2.01)
(a)
a
50
= exp( ) = estimate of crack size at 50% POD.
(b)
a
90
= exp( + 1.282 ) = estimate of crack size at
90% POD.
(c)
a
90/95
= upper 95% confidence bound on the estimate
of a
90
.
Fig. 7 POD(a) function and lower 95% confidence bound from hit/miss analysis of the data in Table 1
for one
insp
ection per crack (from Inspector A) and for three inspections per crack (from the composite result of
Inspectors A, B, and C)
Fig. 8 POD(a) functions from hit/miss analysis of the data in Table 1
Comments on Hit/Miss Analysis. In a well-designed experiment of sufficient sample size for which the log odds
model is a reasonable representation of the POD(a) function, the maximum likelihood hit/miss analysis will provide a
valid solution. Conversely, lacking any of these elements, it is possible that either no solution or an unacceptable solution
can result. If there is no overlap in the flaw size ranges of the detections and misses, Eq 32 and 33 will not yield a
solution. More flaws are needed in the region of increase of the POD(a) function. It is also possible to obtain an estimate
of a POD(a) function that decreases with flaw size if the inspection system is poorly designed or not in control and if
large flaws tend to be missed more often than small flaws. Both of these types of results are readily apparent, albeit
disconcerting.
A third type of unacceptable result is an apparently acceptable POD(a) function but a confidence bound that eventually
decreases with flaw size. This situation is most easily understood in terms of the log odds versus log flaw size plot. If the
slope is positive, the POD(a) function will appear reasonable, but if it is not significantly greater than zero, the lower
confidence bound will eventually decrease with flaw size. Therefore, a decreasing confidence bound is evidence of lack
of fit of the log odds model.
Finally, lack of fit of the model is often manifest in large values of coupled with small values of or extremely wide
confidence intervals. Although there are, in general, insufficient data in hit/miss experiments to test hypotheses about the
POD(a) model, as a minimum each fit should be subjectively judged. For example, in Fig. 9, the observed detection
proportions of each crack in the data of Table 1 are superimposed on the composite POD(a) function and confidence limit
from Fig. 7. The uncertainty in the POD(a) function as indicated by the width of the confidence bound seems justified by
the plot of the raw data. In this example, if greater precision (narrower confidence bounds) were desired, more cracks in
the 2 to 8 mm (0.08 to 0.3 in.) range would be needed in the experiment. Such plots provide an indication of the fit of the
model to the data as well as the range of flaw sizes that are contributing to the information from which the POD(a)
function is being estimated. This is true even for experiments in which there is only one inspection per crack and all
detection probabilities are plotted at 0 or 1.
Fig. 9 Example fit of hit/miss POD(a) function and lower 95% confidence bound
to observed detection
probabilities (three inspections per crack)
References cited in this section
7. A.P. Berens and P.W. Hovey, "Flaw Detection Reliability Criteria, Volume I
Methods and Results,"
AFWAL-TR-84-4022, Air Force Wright-Aeronautical Laboratories, Wright-
Patterson Air Force Base, April
1984
14.
A. Ralston, A First Course in Numerical Analysis, McGraw-Hill, 1965
NDE Reliability Data Analysis
Alan P. Berens, University of Dayton Research Institute
Signal Response Analysis
In signal response data analysis, the parameters of the POD(a) function are calculated from parameters of the versus a
relation. If all the values are between the signal recording threshold and the saturation limit, a simple regression analysis
of ln ( ) versus ln (a) will yield the necessary information to estimate the POD(a) function and its lower confidence
bound. In fact, the least squares estimates from the regression analysis also happen to be the maximum likelihood
estimates. The analysis presented in this section is applicable to the more general case in which some of the values are
censored at the recording threshold or the saturation limit. This more general analysis will give answers identical to those
of the regression analysis if all values are available for all of the flaws (Ref 15).
In the response signal analysis, it is assumed that the values for a flaw of size a have a normal distribution, with mean
and standard deviation given by:
=
0
+
1
ln (a)
(Eq 39)
=
(Eq 40)
where does not depend on the crack size. To simplify the notation, let Y
i
= ln (
i
) and X
i
= ln (a
i
). The random
variable:
(Eq 41)
has a standard normal distribution. Let (z) represent the density function of the standard normal distribution:
(Eq 42)
and (z) represent the cumulative normal distribution:
(Eq 43)
The likelihood function is partitioned into three regions:
• Region R, for which values were recorded
• Region T, for which only a maximum value is known (the
values fall below the recording signal
threshold and cannot be recorded)
• Region S, for which only a minimum value is known (the
values fall above the saturation limit and
cannot be recorded)
These regions are identified by the open circles, the down arrows, and the up arrows, respectively, in Fig. 5. The
likelihood function for the entire sample is the product of the likelihood functions for the three regions:
L(
0
,
1
, ) =
(Eq 44)
But (suppressing the dependency of L on
0
,
1
, and ):
(Eq 45)
(Eq 46)
(Eq 47)
because 1/ (Z
i
) dz is the probability of observing
i
for the ith flaw in R,
i
(a
th
) is the probability of obtaining an ln
i
value below the recording threshold for the ith flaw in S, and 1 -
i
(a
sat
) is the probability of obtaining an value
above the saturation limit for the ith flaw in T. The log of the likelihood function is:
(Eq 48)
where r is the number of cracks in R, that is, the number of cracks for which values were recorded.
Parameter Estimation in Analysis. The maximum likelihood estimates are given by the solutions to:
(Eq 49)
(Eq 50)
(Eq 51)
where:
(Eq 52)
(Eq 53)
Standard numerical methods, such as the Newton-Rhapson iterative procedure (Ref 14), can be used to find the solutions
to Eq 49, 50, and 51. Excellent choices for the initial estimates of iterative procedures are the intercept, slope, and
standard deviation of residuals obtained from a standard regression analysis of only those values for which a valid
response was recorded.
Confidence Bound Calculation in Analysis. Because the POD(a) parameters are calculated from the estimates of
the versus a data, the calculation of the lower confidence bound is a five-step process:
• The information matrix for the estimates of
0
,
1
, and is obtained using Eq 21
• The variance-covariance matrix of
0
,
1
, and is obtained by inverting the information matrix (
Eq
20)
• The variance-covariance matrix of the estimates of and are calculated based on a first-
order Taylor
series expansion of the equations relating
0
,
1
, and to and (Eq 12 and 13)
• The information matrix for and is obtained by inverting the variance-covariance matrix to obtain
Eq
22
• The calculated values are substituted into Eq 23, 24, and 25 to obtain the lower confidence bound
The elements of the information matrix for = (
0
,
1
, ) are given by (dropping the subscripts):
(Eq 54)
(Eq 55)
(Eq 56)
(Eq 57)
(Eq 58)
(Eq 59)
(Z) = V(Z) [V(Z) - Z]
(Eq 60)
(Z) = -W(Z) [W(Z) + Z]
(Eq 61)
Let V (
0
,
1
, ) represent the variance-covariance matrix of the maximum likelihood estimates of the ln ( ) versus ln
(a) analysis. The value V (
0
,
1
, ) is obtained from the inverse of the information matrix. Let the elements of V (
0
,
1
, ) be defined by:
(Eq 62)
Using a Taylor series expansion about the true values of and to linearize the relations expressed by Eq 12 and 13, the
variance-covariance matrix of and is given by (Ref 16):
(Eq 63)
and the transformation matrix T is defined by:
(Eq 64)
Multiplying the matrices yields the variances and covariance of and as:
(Eq 65)
(Eq 66)
(Eq 67)
Inverting this variance-covariance yields the values of k
0
, k
1
, and k
2
required in Eq 25 to calculate the lower confidence
bound on the POD(a) function.
Multiple Inspections Per Flaw. Repeat values for the same flaw can be analyzed to estimate the magnitude of the
total variability being introduced by factors other than the flaws in the experiment. In essence, the random term, , of Eq
9, can be partitioned into components that can be estimated if the experiment is properly designed. The relative magnitude
of the components of variance indicates potential areas for improving the system. However, the methods for using the
values to generate POD(a) functions and confidence bounds from complex experiments with censored values are still
under development.
If there are no censored values, the following analysis provides valid estimates of both the POD(a) function and its
confidence bound. If there are censored values, the POD(a) parameter estimates are valid, but the confidence bound is
approximate. Much of the data recorded in the format is from automated systems. In these systems, the variability in
values has been dominated by that associated with different flaws. This variability is correctly analyzed in the following
analysis. In applications to date, the approximation to account for the secondary sources of variability has been judged to
be negligible.
To model an additional source of variability, Eq 9 is rewritten as:
Y
ij
= ln (
ij
) =
0
+
1
ln (a
i
) + c
i
+ r
ij
i = l, . . ., n
j = l, . . ., k
(Eq 68)
where
ij
represents the jth observation on the ith flaw, c
i
is the random deviation of flaw i from the fit, and r
ij
is the
random deviation about c
i
introduced by replicate j of the source of the repeated observations. For this model of ln ( )
versus ln (a):
= c
i
+ r
ij
(Eq 69)
Because it is reasonable to assume that the variability introduced by flaws is independent of that introduced by other
factors:
= +
(Eq 70)
where can be estimated as the pooled-within variance of
i
values for each flaw using those flaws for which values
were recorded (Ref 17):
(Eq 71)
where n* is the number of flaws with uncensored values and k
i
is the number of uncensored values for flaw i.
Between-crack variability, , cannot be estimated directly, but can be estimated indirectly from a censored regression
analysis. First, the mean log response for each flaw is calculated. This mean response may be a simple average if all
values are available, but a mean based on an analysis of censored data (as previously discussed) will be required for the
flaws for which values were censored at the decision threshold or saturation limit. The analysis in the section
"Parameter Estimation in Analysis" in this article is then used on the model:
Y
i
=
0
+
1
X
i
+ c
i
+
(Eq 72)
to obtain estimates
0
,
1
, and * . However: