Staged diabetes management a systematic approach - part 4 potx
Bạn đang xem bản rút gọn của tài liệu. Xem và tải ngay bản đầy đủ của tài liệu tại đây (1.05 MB, 41 trang )
144 TYPE 2 DIABETES
History: diabetes therapy and control,
miscarriages, fetal anomalies, macrosomia,
LGA and birth control
Medications: if hypertensive, switch to
methyldopa or hydralazine, ACE inhibitors
and beta blockers contraindicated in pregnancy
Complications: hypoglycemia unawareness;
retinopathy; nephropathy; neuropathy
Discuss pregnancy-related risks including
association of hyperglycemia with maternal
and fetal complications
Physical exam: include funduscopic eye exam
(with dilation) by ophthalmologist
Laboratory: CBC; UA/UC; thyroid studies;
24 hour urine for creatinine clearance and
albumin; HbA
1c
; EKG
Correlate SMBG and HbA
1c
; assess nutritional
status, self-management skills, and
psychological status
•
•
•
•
•
•
History, physical exam, and laboratory
evaluation by clinician
Patient planning pregnancy
Patient on sulfonylurea, metformin,
a-glucosidase inhibitor, meglitinide,
thiazolidinedione.
NO
NO
SMBG and/or HbA
1c
within target range?
Work with patient to establish BG control
Re-assess current therapy
Start or adjust intensified regimen as needed;
see Insulin Stage 3 or 4
Continue with birth control
Continue co-management with a diabetes
specialist
•
•
•
•
Follow-up
Medical:
Education:
phone every 1–2 weeks, then
office visit every 1–2 months
every 2–3 months or as needed
Stop birth control and continue insulin
or glyburide therapy maintain SMBG and HbA
1c
within target range until pregnancy confirmed
Stop oral agent (except glyburide) and
start insulin or glyburide regimen
Note:
All oral agents except glyburide pass
the placental barrier
SMBG Targets
•
•
•
•
More than 50% of SMBG values within range
Pre-meal: 70–100 mg/dL (3.9–5.6 mmol/L)
Post-meal: Ͻ140 mg/dL (7.8 mmol/l) 1 hour
after start of meal; Ͻ120 mg/dL (6.7 mmol/L)
2 hours after start of meal
No severe (assisted) or nocturnal hypoglycemia
Goals may be changed for hypoglycemia
unawareness
HbA
1c
Target
• At least 2 values 1 month apart within normal
range
•
•
SMBG: up to 7 times/day; before and 2 hours
after start of meals and at bedtime
HbA
1c
: at least 2 values 1 month apart
Monitoring
YES
YES
Figure 4.18 Guidelines for Pregestational and Gestational Diabetes
PATIENT EDUCATION 145
Patient education
All patients require education to understand their
diabetes, to learn how to manage it, and to rec-
ognize when complications are occurring. This
section reviews the principles of education spe-
cific to type 2 diabetes. It is preferable to refer
patients needing diabetes and nutrition education
to nurses and dietitians trained in providing edu-
cation to individuals with diabetes. This, however,
may not be possible. This section provides an
overview of the areas covered by patient education
in order to acquaint the clinician with what is to be
expected if an educator is available, or what is to
be addressed if an educator is not available. Where
appropriate, the specific education needed for each
therapy is also detailed. A complete set of Deci-
sionPaths describing diabetes education, medical
nutrition therapy, and exercise assessment can be
found in the Appendix.
Diabetes education
Quality diabetes education starts with the estab-
lishment of an education plan (see Figure 4.19
and the Appendix, Figures A.8 and A.9). Briefly,
the education plan is developed after an extensive
physical, psychological, and social assessment of
the patient. Based on this assessment, therapeutic
(SMBG and HbA
1c
) and self-management goals
are established. The topics to be discussed at
the initial diabetes education visit include patho-
physiology, medication action and administration,
SMBG technique, prevention and treatment of hy-
poglycemia, and procedures for handling diabetes
related medical emergencies. For patients treated
with insulin, additional education topics include
insulin action, insulin injection technique, site ro-
tation, proper use of glucagon, insulin storage,
syringe disposal, and urine ketone monitoring. In
order to ensure quality diabetes education, the
American Diabetes Association has established a
set of 15 diabetes education content areas (see
Figure 4.20).
Ideally, patients should have access to spe-
cially trained diabetes educators. In the United
Establish Education Plan
Assessment
• Height/weight (BMI)/BP/foot exam with
monofilament
• Risk factors (family history, obesity, ethnicity,
GDM)
• Diabetes knowledge/skills
• Psychosocial issues (denial, anxiety, depression)
• Economic/cultural factors
• Readiness to learn/barriers to learning
• Lifestyle (work, school, food, and exercise
habits)
•
• Support systems
• Health goals
Goals
• SMBG/HbA
1c
in target
• Achieve self-management knowledge/skills/
behavior (SMBG, medications, nutrition,
exercise)
Plan
•
• Establish 3 behavior change goals with patient
(exercise, nutrition, medications, monitoring)
Teach initial education topics
Tobacco/alcohol use
Figure 4.19 Guidelines for establishing a diabetes
education plan
1.
2.
3.
4.
5.
6.
7.
8.
9.
10.
American Diabetes Association
Education Content Areas
Pathophysiology of diabetes and treatment
options
Medical nutrition therapy
Physical activity
Medications
Blood glucose monitoring and use of results
Prevention, detection, and treatment of acute
complications
Prevention, detection, and treatment of chronic
complications
Goal Setting
Psychosocial adjustment
Preconception care, pregnancy, and gestational
diabetes management
Figure 4.20 Required e ducation content areas for
American Diabetes Association recognition
146 TYPE 2 DIABETES
States, such educators are certified by the National
Certification Board of Diabetes Educators. Known
as certified diabetes educators (CDEs), they are
qualified to provide both basic and advanced di-
abetes education. Patients have responsibility in
terms of self-management and, therefore, must
leave the office confident in their skills and un-
derstanding. Arrange a follow-up educational visit
within 2–4 weeks (or sooner if starting insulin) to
review understanding and skills.
Nutrition education
Nutrition education is an integral part of as-
sisting the patient in following a food plan. A
registered dietitian with experience in diabetes
should counsel the patient as soon as feasible.
At the initial nutrition visit, general education
Establish Nutrition Therapy Plan
Assessment
·
·
·
·
·
·
·
·
·
·
·
·
Food history or 3 day food record (meals, times,
portions)
Nutrition adequacy
Height/weight/BMI
Weight goals/eating disorders
Psychosocial issues (denial, anxiety, depression)
Economic/cultural factors
Nutrition/diabetes knowledge
Readiness to learn/barriers to learning
Work/school/sports schedules
Exercise (times, duration, types)
Tobacco/alcohol use
Vitamin/mineral supplements
Goals
·
·
·
·
SMBG/HbA
1c
in target
Achieve desirable body weight (adults)
Normal growth and development (children)
Consistent carbohydrate intake
Plan
·
·
·
·
·
·
Establish adequate calories for growth and
development/reasonable body weight
Set meal/snack times
Integrate insulin regimen with medical nutrition
therapy (insulin users)
Set consistent carbohydrate intake
Encourage regular exercise
Establish adequate calories for pregnancy/
lactation/recovery from illness
Figure 4.21 Guidelines for establishing a nutrition
therapy plan
Medical Nutrition Therapy Guidelines
Total fat ϭ 30% total calories; less if obese and
high LDL
Saturated fat Ͻ10% total calories; Ͻ7% with high
LDL
Cholesterol Ͻ300 mg/day
Sodium Ͻ2400 mg/day
Protein reduced to 0.8 g/kg/day (~10% total
calories) if macroalbuminuria
Calories decreased by 10–20% if BMI Ͼ25 kg/m
2
•
•
•
•
•
•
Figure 4.22 Medical nutrition therapy guidelines
about the inter-relationship between food and di-
abetes should be discussed along with a nutri-
tional assessment and the creation of an initial
food plan (see Figure 4.21). The food plan should
incorporate consistent carbohydrate intake at es-
tablished meals and, for patients using insulin,
integration of the insulin regimen with the food
plan. In addition, the food plan should take into
account basic medical nutrition therapy guide-
lines for fat, cholesterol, and sodium intake (see
Figure 4.22). For more specific information, see
the Appendix (Figures A.8 and A.9) as well as
information on carbohydrate counting and food
choices (Figures A.14 and A.15). The next visit
will be a reassessment combined with an individ-
ualized food plan that reflects the ethnic, socio-
economic, and special preferences of the patient
while addressing the needs of one with diabetes.
Here integration of blood glucose results, food
plan records, and exercise are discussed. The pa-
tient should understand the importance of appro-
priate food intake, know how to measure caloric
intake, and be aware of the effects different nutri-
ents have on blood glucose level.
Exercise/activity education
Patients are often unaware of the importance of
exercise (or increased activity) and its relationship
to metabolic control. Exercise education begins
with detailing how exercise affects blood glucose
levels. Once the patient understands the r ole of
exercise or activity in managing diabetes, the
next step is to develop an exercise (activity) plan
(see Figure 4.23). Careful evaluation of overall
PATIENT EDUCATION 147
Establish Exercise Plan
Goals
Consistent exercise schedule
Include aerobic (jog, swim, bike) and anaerobic
(weight lifting, push-ups) exercises
•
•
•
Frequency: 3 times/week
•
•
Duration: 30 minutes/session
Intensity: 50–75% maximum heart capacity
(220 Ϫ age ϭ100%)
• If obese, expend 700–2000 calories/week
Plan
• Individualize based on fitness level, age, weight,
personal goals, and medical history
• Select type of exercise with patient
• Set exercise schedule with patient
• Measure, record, and review SMBG before and
20 minutes after exercise
• Patient to record type, duration, and intensity
• Patient to note any symptoms, i.e., pain,
dizziness, shortness of breath, hypoglycemia
Follow-up
Each week for 2 weeks
Figure 4.23 Guidelines for establishing an
exercise plan
fitness level is important. Any concerns about
cardiovascular disease should be evaluated prior
to starting an exercise program. Generally, the
patient should be evaluated for fitness on three
parameters:
1. endurance (repetitive movements), shown in
Photos 4.2 and 4.3
2. strength (lifting weight resistance bands),
shown in Photo 4.4
3. flexibility (stretching), shown i n Photo 4.5
Endurance can be measured by asking the
patient to step up and down from a one-step
stool continuously for 1 minute. If a station-
ary exercise bicycle is available, repeated ped-
dling with midrange resistance for 1 minute is
another means of assessing endurance. While
there are some general standards that are age
and gender specific, the patient should be able
to perform these activities without any appar-
ent stress. Strength is measured by stretching a
standard resistance band or lifting a five pound
weight with an outstretched arm. Again, age-
and gender-specific tables will provide the aver-
age expected strength that would permit eventual
Photo 4.2 Endurance: stationary bike
Photo 4.3 Endurance: treadmill
repeated exercise. Flexibility can be measured in
several ways: simple stretching while standing;
touching toes while standing or lying; or reach-
ing with both feet flat on the ground. Collec-
tively, these measures are meant to provide an
overall rapid assessment of the patient’s fitness
for exercise.
148 TYPE 2 DIABETES
Photo 4.4 Strength: resistance bands
The level of exercise is determined individually
and must answer such questions as when, how of-
ten, how long, and at what pace. The Appendix
contains Specific DecisionPaths for exercise as-
sessment, developing an exercise plan, and exer-
cise education topics. SMBG testing should oc-
cur before and immediately following exercise.
For routine exercise, this should be repeated
Photo 4.5 Flexibility: stretching
three to five times until a clear pattern emerges.
Many patients report significant improvement in
blood glucose levels when exercise is included in
the overall treatment strategy. While an exercise
specialist is desirable, many CDEs are qualified
to evaluate fitness and to develop an exercise
prescription.
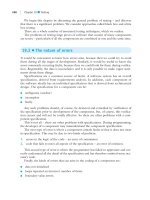
Behavioral issues and assessment
Behavioral issues may be divided into two general
categories: adherence to regimen and underlying
psychological or social pathology. While non-
adherence to a specific regimen may have under-
lying pathology, it is suggested in a primary care
setting to first determine whether the problem is
due to other causes. Staged Diabetes Management
provides a simple set of pathways to review pos-
sible avenues to explore before considering psy-
chological and social causes. Assessment begins
with an evaluation of the current level of glycemic
control as reported by the patient (SMBG) and the
laboratory (fasting plasma or HbA
1c
). This is be-
cause medical intervention is justified when the
current therapy is not working. If the correlation
between SMBG and HbA
1c
(see Figure 4.24) is
poor, make certain that technique, device, and
reporting by the patient are understood. Have
patients demonstrate SMBG technique using their
meter and draw a simultaneous blood sample for
the laboratory. If the correlation between patient
and laboratory data is still poor, consider re-
education.
Adherence assessment
Four diabetes-related areas of adherence that can
be readily assessed in the primary care setting in-
clude medical nutrition, medication, SMBG, and
exercise. Each area is approached in a similar
manner. First, determine whether the patient un-
derstands the relationship between the behaviour
and diabetes. Second, determine whether the pa-
tient is prepared to set explicit short-term behav-
ioral goals. Third, determine why the goals are
not met; and fourth, be prepared to return to a
BEHAVIORAL ISSUES AND ASSESSMENT 149
% Hemoglobin HbA
1c
(assuming normal range of HbA
1c
is 4–6%)
Average Blood Glucose in mg/dL(mmol/L)
678910111213
400
(22.2)
350
(19.4)
300
(16.7)
250
(13.9)
200
(11.1)
150
(8.3)
100
(5.5)
If Hba
1c
is: Average SMBG is:HbA
1c
*
7% ~150 mg/dL (8.3 mmol/L)
~180 mg/dL (10.0 mmol/L)
~210 mg/dL (11.7 mmol/L)
~245 mg/dL (13.6 mmol/L)
~280 mg/dL (15.6 mmol/L)
~310 mg/dL (17.2 mmol/L)
~345 mg/dL (19.2 mmol/L)
~380 mg/dL (21.1 mmol/L)
8%
9%
10%
11%
12%
13%
14%
1 Percentage point above normal
2 Percentage points above normal
3 Percentage points above normal
4 Percentage points above normal
5 Percentage points above normal
6 Percentage points above normal
7 Percentage points above normal
8 Percentage points above normal
* assumes normal range of 4-6%
Nathan, DM, et al: N engl J Med 310: 341-346, 1984
Figure 4.24 Relationship between glycosylated
hemoglobin A
1c
and blood glucose levels
previous step along this pathway if the current
step is not completed.
The Specific DecisionPath for assessing adher-
ence to nutrition therapy is shown in Figure 4.25.
DecisionPaths for assessing adherence to medica-
tion, SMBG, and exercise regimens are located
in the Appendix. Based on the transtheoretical
model of behaviour change,
37
all of the adherence
DecisionPaths begin with whether the patient un-
derstands the connection between the behaviour
and diabetes. It has been found that changing be-
haviour without understanding why it is important
to do so will most likely fail. Thus, providing the
patient with specifics as to how food, exercise,
medications, or SMBG is related to diabetes man-
agement and prevention of complications is criti-
cal. Next, determine specifically what the patient
is willing to do. In most cases, any misunder-
standing as to the importance of adhering to the
prescribed regimen can be resolved through this
systematic approach. The next step involves set-
ting goals with the patient. Set simple, reasonable,
and explicit short-term goals like “replace whole
milk with skim milk” or “increase walking by 10
minutes per day.” Next, determine whether the pa-
tient has met or is attempting to meet the goals. Be
prepared to reset the goals and move back a step.
As the behaviour changes, negotiate new explicit
goals. Always ask the patient to help set the new
goal. There are, however, those patients for whom
this approach will not work. Some patients are
not ready to change their behaviours. Continued
reinforcement for change, combined with educa-
tion, will sometimes overcome this reluctance to
modify behaviour. If this is not effective consider
referral to a behavioral expert.
Psychological and social
assessment
The diagnosis of type 2 diabetes carries with it the
risk of psychological and social dysfunction. Al-
most half of newly diagnosed cases are uncovered
after a complication (such as retinopathy or heart
disease) has been discovered. The knowledge that
they may have had undetected diabetes for several
years combined with the added burden of diabetes
related complications presents a unique dilemma.
On the one hand the individual is expected to re-
turn to normal life; on the other hand he or she is
expected to be responsible for self-management.
With the need to restore near euglycemia, this be-
comes even more problematic. The initiation of a
new approach to treatment (such as introducing in-
sulin therapy), may also cause both psychological
and social dysfunction. This is often reflected in
how the individual adjusts to changes in lifestyle
brought about by type 2 diabetes and its treat-
ment.
Patients’ ability to acquire the new knowledge
and skills is related to their psychological and
social adjustment. Such psychological factors as
depression and anxiety and social factors such as
conduct disorders significantly interfere with ac-
quiring self-care skills and with accepting the seri-
ousness of diabetes. Additionally, eating disorders
may directly affect the efficacy of treatment and
may present serious, long-lasting complications. If
the psychological and social adjustment of the in-
dividual with diabetes proves to be dysfunctional,
150 TYPE 2 DIABETES
Patient with food plan adherence issues
YES
NO
Does patient understand the food plan
and its relationship to managing
BG levels, medication effectiveness,
and exercise optimization?
YES
NO
Is patient willing to set
food plan behavior goals?
YES
NO
Is patient taking an active role in
changing food plan behaviors?
Set Goals with Patient
Write clear, simple, achievable goals; must be
measurable; include timeline; limit to one goal
Example: I will drink 1% milk instead of 2% or
whole milk at meals and snacks for the next 2
weeks.
Re-set goals as necessary
YES
NO
Is patient consistently following food plan?
Follow-up
Evaluate food plan goals at each visit
Re-educate patient about purpose and
importance of following a food plan; consider
referral to registered dietitian
Re-educate patient; consider referral to diabetes
educator or licensed psychologist for
counseling
Assess patient's ability to:
Assist patient with problem solving
Consider referral to diabetes educator or
licensed psychologist for counseling
identify problem areas
self-adjust goals and behaviors
take deliberate action to change behaviors
self-monitor behavior change actions
•
•
•
•
Figure 4.25 Nutrition Therapy Adherence Assessment DecisionPath
it will most likely be reflected in poor glycemic
control. This, in turn, raises the risk of acute and
chronic complications, which contribute still fur-
ther to the psychological and social dysfunction.
To break this cycle it is necessary to identify the
earliest signs of dysfunction and to intervene as
soon as possible.
The primary care physician generally initiates
psychological and social interventions in diabetes
only after symptoms occur. Many of the more
BEHAVIORAL ISSUES AND ASSESSMENT 151
Assess psychological well-being
Assess social well-being
Assess behavior patterns
Assess eating disorders
YES
NO
Have any significant psychological
problems been identified?
YES
NO
Have any significant social
problems been identified?
YES
NO
Have any significant behavior
problems been identified?
YES
NO
Have any significant eating
disorders been identified?
Refer to licensed psychologist or MSW for
further evaluation and counseling as necessary;
continue with assessment
Refer to licensed psychologist or MSW for
further evaluation and counseling as necessary;
continue with assessment
Refer to licensed psychologist or MSW for
further evaluation and counseling as necessary;
continue with assessment
Refer to licensed psychologist or MSW for
further evaluation and counseling as necessary;
continue with assessment
Document and communicate recommendations
in writing to referral source
Follow-up
Evaluate at each visit
• Problems with peer relationships
• Work/school phobia
• Difficulty sleeping
• Depression or anxiety problems
• Organic functioning problems
• Major change in affect or mood
• Age inappropriate behavior
• Family system dynamics
• Family conflict
• School/work absenteeism
• Drop in grade/work performance
• Addictive behavior to drugs/alcohol
• Aggressive behavior
• Withdrawal from school, work, or family
• Family response to diabetes
• Anorexic or bulimic behavior
• Binge or compulsive eating
• Hyperglycemia as a basis for weight
management
• Food refusal
• Overactive behavior
• Impulsive behavior
• Overwork and/or work to exhaustion
• Lack of attention
Figure 4.26 Psychological and Social Assessment DecisionPath
common symptoms can be found in the Psycho-
logical and Social Assessment DecisionPath (see
Figure 4.26). In anticipation of such symptoms,
it might be appropriate for primary care physi-
cians to refer newly diagnosed patients, and pa-
tients for whom significant changes in therapy
are being contemplated, to a psychologist or so-
cial worker trained to detect the earliest symp-
toms of psychological or social dysfunction and
to intervene before they result in destructive be-
haviours. Often one or two counseling sessions
are required to detect underlying psychological
or social problems and to intervene effectively.
Recognizing these early warning signs requires a
complete psychological and social profile of the
individual. One approach to obtaining this infor-
mation is to begin the patient encounter with the
152 TYPE 2 DIABETES
idea that diabetes will be co-managed by the pa-
tient and the physician (and team) and that the
patient will be empowered to make decisions.
Most patients begin interactions with physicians
assuming the power to make all clinical decisions
rests with the physician.
For successful diabetes management (where
90 per cent is the responsibility of the patient) co-
empowerment of the patient with the health care
team effectively brings the patient onto the team
and ensures that the patient understands and takes
on clinical care responsibilities. Co-empowerment
recognizes that the patient and physician may have
a different view of the seriousness of the disease,
the responsibilities of each health care profes-
sional, and the expectations of the patient’s perfor-
mance. The individual with diabetes may feel the
physician will make all decisions related to care
and the patient should be passive. Alternatively,
the physician may feel the patient should make
daily decisions about diet, insulin, and exercise.
Co-empowerment is an agreement between the
patient and health care team that delineates the re-
sponsibilities and expectations of each participant
in care and also provides the DecisionPath all
team members have agreed to follow. From a psy-
chosocial perspective, it may be seen as a contract
in which the patient spells out in detail his or her
expectations and in which health care profession-
als have an opportunity to determine how well
those responsibilities and expectations fit with the
diabetes management plan. It presents an oppor-
tunity to review behaviours that may be dysfunc-
tional to the overall treatment goal. The person
who refuses to test, who is hyperactive at work,
or who binge eats must be encouraged to share
this information with the health team. Similarly,
the physician who believes in strict adherence to
regimens or the dietitian who expects 100 per cent
compliance with a restrictive food plan must be
able to state these expectations and have them
challenged by the patient. Through this process
of negotiation, a consensus as to goals, responsi-
bilities, and expectations can be reached that will
benefit the person with diabetes as well as the
health care team members.
References
1. Centers for Disease Control National Center for
Chronic Disease Prevention and Health Promotion.
National Diabetes Fact Sheet, 2003.
2. American Diabetes Association. Diabetes 1996:
Vital Statistics.
3. Youngren JF, Goldfine ID and Prately RE. De-
creased muscle insulin receptor kinase correlates
with insulin resistance in normoglycemic Pima In-
dians. Am J Physiol 1997; 273: E276–E283.
4. Sinha MK, Pories WJ, Flickinger EG, Meelheim D
and Cara JF. Insulin-receptor kinase activity of adi-
pose tissue from morbidly obese humans with and
without NIDDM. Diabetes 1987; 36: 620–625.
5. Kusari J, Kenner KA, Suh KI, Hill DE and
Henry RR. Skeletal muscle protein tyrosine phos-
phatase activity and tyrosine phosphatase 1B pro-
tein content are associated with insulin action and
resistance. J Clin Invest 1994; 93: 1156–1162.
6. Boden G, Chen X, Ruiz J, White JV and Ros-
setti L. Mechanisms of fatty acid-induced inhibi-
tion of glucose uptake. J Clin Invest 1994; 93:
2438–2446.
7. Foley JE. Rationale and application of fatty acid
oxidation inhibitors in treatment of diabetes melli-
tus. Diabetes Care 1992; 15: 773–784.
8. Moller DE. Potential role of TNF-alpha in the
pathogenesis of insulin resistance and type 2 dia-
betes. Trend Endocrinol Metab 2000; 11: 212–217.
9. Bertin E, Nguyen P, Guenounou M, Durlach V,
Potron G and Leutenegger M. Plasma levels of
tumor necrosis factor-alpha (TNF-alpha) are essen-
tially dependent of visceral fat amount in type 2
diabetic patients. Diabetes Metab 2000; 26: 178–
182.
10. Youd JM, Rattigan S and Clark MG. Acute im-
pairment of insulin-mediated capillary recruitment
and glucose uptake in rat skeletal muscle in vivo
by TNF-alpha. Diabetes 2000; 49: 1904–1909.
11. Abate N. Insulin resistance and obesity. Role of
fat distribution pattern. Diabetes Care 1996; 19:
292–294.
12. Leahy JL, Bonner Weir S and Weir GC. β-cell
dysfunction induced by chronic hyperglycemia.
Current ideas on mechanism of impaired glucose-
induced insulin secretion. Diabetes Care 1992; 15:
442–455.
13. Diabetes Control and Complications Trial Re-
search Group. The effect of intensive treatment of
diabetes on the development and progression of
REFERENCES 153
long-term complications in insulin-dependent dia-
betes mellitus. N Engl J Med 1993; 329: 977–986.
14. Kuusisto J, Mykkanen L, Pyorala K and Laakso M.
NIDDM and its metabolic control predict coronary
heart disease in elderly subjects. Diabetes 1994;
43: 960–967.
15. Klein R. Hyperglycemia and microvascular and
macrovascular disease in diabetes. Diabetes Care
1995: 18: 258–268.
16. Ohkubo Y, Kishikawa H and Araki E. Intensive
insulin therapy prevents the progression of diabetic
microvascular complications in Japanese patients
with non-insulin-dependent diabetes mellitus: a
randomized prospective 6-year study. Diabetes Res
Clin Pract 1995; 28: 103–117.
17. Garg A. Treatment of diabetic dyslipidemia. Am J
Cardiol 1998; 81(4A): 47B–51B.
18. UK Prospective Diabetes Study Group. Intensive
blood-glucose control with sulphonylureas or in-
sulin compared with conventional treatment and
risk of complications in patients with type 2 dia-
betes (UKPDS 33). Lancet 1998; 352: 837–853.
19. Turner RC, Millns H, Neil HA, et al. Risk factors
for coronary artery disease in non-insulin depen-
dent diabetes mellitus: United Kingdom Prospec-
tive Diabetes Study (UKPDS: 23). Br Med J 1998;
316: 823–828.
20. Harris MI. Classification, diagnostic criteria, and
screening for diabetes. Diabetes in America 1995;
NIH Publications No. 95-1468(2): 15–36.
21. Meigs JB, Singer DE, Sullivan LM, et al. Meta-
bolic control and prevalent cardiovascular dis-
ease in non-insulin-dependent diabetes mellitus
(NIDDM): the NIDDM patient outcome research
team. Am J Med 1997; 102: 38–47.
22. Stern MP and Haffner SM. Dyslipidemia in type II
diabetes: implications for therapeutic intervention.
Diabetes Care 1991; 14: 1144–1159.
23. Neel JV. Diabetes mellitus: a “thrifty” geno-
type rendered detrimental by “progress?” Am J
Hum Genet 1962; 14: 353–62.
24. Knowler WC, Barret-Connor E, Fowler SE, et al.
Reduction in the incidence of type 2 diabetes with
lifestyle intervention or metformin. N Engl J Med
2002; 346: 393–403.
25. Uusitupa M, Louheranta A, Lindstrom J, Valle T,
Sundvall J, Eriksson J and Tumomilehto J. The
Finnish Diabetes Prevention Study. Br J Nutr
2000; Suppl 1: S137–142.
26. American Diabetes Association. Report of the Ex-
pert Committee on the Diagnosis and Classifica-
tion of Diabetes Mellitus. Diabetes Care 2003; 26:
S5–S20.
27. Azen SP, Peters RK, Berkowitz K, Kjos S a nd
Xiang A, Buchanan TA. Tripod (troglitazone in
the prevention of diabetes): a randomized, placebo-
controlled trial of troglitazone in women with prior
gestational diabetes mellitus. Control Clin Trials
1998; 19: 217–231.
28. Nathan DM. Inferences and implications: do re-
sults from the Diabetes Control a nd Complications
TrialapplyinNIDDM?Diabetes Care 1995; 18:
251–257.
29. Mazze RS, Shamoon H, Parmentier R, et al.Re-
liability of blood glucose monitoring by patients
with diabetes. Am J Med 1984; 77: 211–217.
30. Mazze RS. Measuring and Managing hyper-
glycemia in pregnancy: from glycosurin to contin-
uous blood glucose monitoring. Seminars in Peri-
natology 2002; 26(3): 171–180.
31. Watts NB, Spanheimer RG, D iGirolamo M, et al.
Prediction of glucose response to weight loss in
patients with non-insulin-dependent diabetes mel-
litus. Arch Intern Med 1990; 150: 803–806.
32. Frankenfield DC, Muth ER and Rowe WA. The
Harris–Benedict studies of human basal meta-
bolism: history and limitations. J Am Diet Assoc
1998; 98: 439–445.
33. Devlin JT. Effects of exercise on insulin sensitivity
in humans. Diabetes Care 1992; 15: 1690–1693.
34. Chiasson JL, Josse RG, Hunt JA, et al.Theeffi-
cacy of acarbose in the treatment of patient with
non-insulin-dependent diabetes mellitus. Ann. In-
tern Med 1994; 12: 928–935.
35. John JL, Wolf SL and Kabadi UM. Efficacy of
insulin and sulfonylurea combination therapy in
type II diabetes: a meta-analysis of the randomized
placebo-controlled trials. Arch Intern Med 1996;
156: 259–264.
36. UK Prospective Diabetes Study Group. Effect of
intensive blood-glucose control w ith metformin on
complications in overweight patients with type 2
diabetes (UKPDS 34). Lancet 1998; 352: 854–
865.
37. Prochaska JO, Norcross JC and Diclemente CC.
Changing for Good. New York: Avon, 1994.
38. Kahn CR. Causes of insulin resistance. Nature
1995; 373: 384–385.
39. Reaven GM, Laws A. Insulin resistance, compen-
satory hyperinsulinemia, and coronary heart dis-
ease. Diabetologia 1994; 37: 948–952.
40. Wing RR, Blair EH, Bononi P, Marcus MD,
Watanabe R, Bergman RM. Caloric restriction
per se is a significant factor in improvements
in glycemic control and insulin sensitivity during
weight loss in obese NiDDM patients. Diabetes
Care 1994; 17: 30–36.
41. Klein R, Klein BEK and Moss S. The Wisconsin
Epidemiologic Study of Diabetic Retinopathy: a
review. Diabetes Metab Rev 1989; 5: 559–570.
42. Nathan DM, Singer DE, Hurxthal K and Good-
son JD. The clinical information value of the gly-
cosylated hemoglobin assay. N Engl J Med 1984;
310: 341–346.
43. Monk A, Barry B, McClain K, Weaver T,
Cooper N and Franz M. Practice guidelines for
medical nutrition therapy provided by dietitians for
154 TYPE 2 DIABETES
persons with non-insulin dependent diabetes mel-
litus. J Am Diet Assoc 1995; 95: 999–1006.
44. Franz, MJ, Monk A, Barry B, et al. Effectiveness
of medical nutrition therapy provided by dietitians
in the management of non-insulin dependent dia-
betes mellitus; A randomized, controlled clinical
trial. J Am Diet Assoc 1995; 95: 1009–1017.
45. Jensen-Urstad KJ, Reichard PG, Rosfors S
and Lindblad LEL, Jensen-Urstad MT. Early
atherosclerosis is retarded by improved long-term
blood glucose control in patients with DDM. Dia-
betes 1996; 45: 1253–1258.
46. Bailey CJ, Path MRC and Turner RC. Metformin.
N Engl J Med 1996; 334: 574–579.
5
Type 2 Diabetes and
Metabolic Syndrome
in Children and
Adolescents
The development of insulin resistance or meta-
bolic syndrome and type 2 diabetes in children and
adolescents is considered a new epidemic.
1
Arise
in childhood obesity, a decline in exercise/activity
level, and a realization that not all childhood hy-
perglycemia results from type 1 diabetes have
joined to cause special medical attention to fo-
cus on children and adolescents who are at espe-
cially high risk for a series of disorders known
as metabolic syndrome, insulin resistance syn-
drome, or syndrome X. All of which reflect the
increased realization that obesity, hyperglycemia,
hypertension, dyslipidemia, and renal disease may
be closely connected.
Currently there are no national data from the
United States as to the incidence or prevalence
of either insulin resistance or type 2 diabetes
in individuals under the age of 18. Neither the
Centers for Disease Control and Prevention nor
the National Diabetes Data Group of the National
Institute of Diabetes and Digestive and Kidney
Diseases are able to provide accurate data as to the
number of children and adolescents with known
type 2 diabetes. Similarly, information related
to childhood hypertension and dyslipidemia is
scarce. Most epidemiological data regarding type
2 in children and adolescents comes from small
population studies limited to specific regions or
ethnic groups that may limit their findings, often
to just those being studied. However, it is clear
that before the early 1990s type 2 diabetes was
rarely diagnosed in children and adolescents, but
by 1999 the diagnosis increased to 8–45 per cent
of all new cases across the United States.
2
The
factors contributing to this increasing number are
(1) better surveillance; (2) increased prevalence
of obesity in children and adolescents; (3) poor
nutrition with diets high in fat and carbohydrate;
and (4) sedentary lifestyle.
The risk factors associated with type 2 diabetes
include:
3
• overweight – BMI greater than 85th percentile
for age and gender
• family history of type 2 diabetes in 1st or 2nd
degree relative
• hypertension – BP <95th percentile for age
and gender
• dyslipidemia – HDL >4 mg/dL (1.1 mmol/L),
triglycerides <250 mg/dL (2.8 mmol/L)
• previous impaired glucose homeostasis – im-
paired fasting glucose and/or impaired glu-
cose tolerance (prediabetes)
Staged Diabetes Management: A Systematic Approach (Revised Second Edition) R.S. Mazze, E.S. Strock, G.D. Simonson and R.M. Bergenstal
2006 Matrex. ISBN: 0-470-86576-X
156 TYPE 2 DIABETES AND METABOLIC SYNDROME IN CHILDREN AND ADOLESCENTS
• low (>2000 g) or high birth weight (<4000 g)
• high-risk ethnic group (American Indian,
Alaska Native, African-American, Mexican-
American)
• polycystic ovary syndrome
• Acanthosis Nigricans
• sedentary lifestyle
• poor nutrition
Etiology
The etiology of type 2 diabetes in children and
adolescents appears to be similar to that of adults.
Hyperglycemia is due to a combination of insulin
resistance and relative insulin deficiency. This has
been reviewed extensively in Chapter 4 and will
be reviewed briefly.
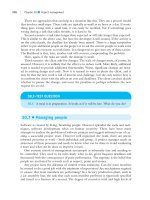
Figure 5.1 shows the three variables that de-
pict the natural history of type 2 diabetes in
children. Like adults, children pass through three
phases: (1) normal glycemia with hyperinsuline-
mia; (2) prediabetes (impaired fasting glucose
(IFG) – fasting plasma glucose between 100 and
125 mg/dL (5.6 and 6.9 mmol/L) – or impaired
glucose tolerance (IGT) – 75 g oral glucose tol-
erance test two hour value between 140 and
199 mg/dL (7.8 and 11 mmol/L); (3) diabetes.
A major differentiation between children with
type 1 and type 2 diabetes is that children and
adolescents with impaired glucose homeostasis or
type 2 diabetes may have elevated plasma in-
sulin levels at the time of diagnosis. P ancreatic
β-cells respond to increasing insulin resistance by
40 mU/mL
60 mU/mL
80 mU/mL
100 mU/mL
20 mU/mL
Post challenge
INSULIN
Time (years)
200
(11.1)
150
(8.3)
200
(5.5)
BG in
mg/dL
(mmol/L)
Insulin
Insulin resistance
Casual Glucose
Fasting Glucose
Figure 5.1 The natural history and underlying de-
fects of type 2 diabetes in children and adolescents
synthesizing and secreting more insulin in an at-
tempt to maintain euglycemia. This can be indi-
rectly measured by determining the amount of
insulin in the blood using an insulin radioim-
munoassay (RIA). In rare cases, t hose with long-
standing undetected type 2 diabetes, insulin levels
are low due to a gradual loss in first-phase insulin
secretion. The β-cells are not able to sustain the
demands of increased synthesis and secretion of
insulin and, over the course of several years, grad-
ually lose the ability to secrete adequate amounts
of insulin. T his decline in β-cell function has been
called ‘β-cell exhaustion’ and may be triggered
by persistent hyperglycemia (glucose toxicity) and
well as hyperlipidemia (lipotoxicity).
4
This pro-
cess is modulated by such factors as diet, activ-
ity, and weight gain. Eventually, if near-normal
glycemia is restored, insulin production improves.
As mentioned previously, confounding these
factors is the fact that some children with type
2 diabetes have a concomitant process linked to
increasing insulin resistance (seen as polycys-
tic ovary syndrome in females and/or Acantho-
sis Nigricans in both females and males from
ethnic groups at highest risk for diabetes). Also
known as the metabolic syndrome, it is marked
by obesity and such conditions as hypertension,
dyslipidemia, and renal disease. While there is
no method to accurately predict which children
will develop insulin resistance or diabetes, ge-
netic factors plus obesity present the highest risks.
Hispanics, African-Americans, Native Americans,
and Asian-Americans have an incidence rate that
varies from two- to tenfold that of Caucasians.
MAJOR STUDIES 157
Prevention of type 2 diabetes
Can insulin resistance or type 2 diabetes be pre-
vented in children? The concept of genetic pre-
disposition to insulin resistance and type 2 dia-
betes has received significant attention. Support-
ing this theory is the high prevalence of obe-
sity and type 2 diabetes in American Indian,
Samoan, and Hispanic children and adolescents.
The idea that a thrifty gene favouring storing en-
ergy over expending energy is prevalent in these
ethnic minorities is supported by a high prepon-
derance of obesity in their children.
5
This suggests
both a genetic and a morphologic explanation
linking hyperglycemia to obesity through insulin
resistance.
Do these factors act independently in children?
Evidence suggests that the highest risk of type
2 diabetes among all children w ould be in obese
American Indian children. The lowest risk would
be in lean Caucasian children with no family
history of diabetes. Can diabetes be prevented
in the former group? If obesity is the princi-
pal factor, medical nutrition therapy as well as
increased exercise/activity will be beneficial to
prevent type 2 diabetes. If, however, genetic de-
fects in the pancreatic β-cell of insulin-sensitive
tissue is the root cause then early use of ei-
ther insulin or insulin sensitizers may be the
solution. If a combination of factors leads to di-
abetes, perhaps prevention will require a combi-
nation of interventions. Unfortunately, there are
no reported studies that have consistently ad-
dressed the issues around preventing type 2 di-
abetes in children. Studies in adults suggest that
promotion of appropriate nutrition and activity
level combined with very close surveillance, so
that those at the highest risk (impaired glu-
cose homeostasis) could be offered treatment,
may be the best that can be currently under-
taken.
Major studies
The underlying principles in the management of
insulin resistance and/or type 2 diabetes in chil-
dren are based principally on small studies of
children plus studies in adults. The major dilemma
is whether intensive treatment at the onset of dis-
ease is appropriate in children. There is no evi-
dence that allowing blood glucose or blood pres-
sure to worsen is beneficial. As type 2 diabetes
is part of a larger syndrome with consequences
for almost every major organ system and since
these co-morbidities are more prevalent in indi-
viduals with long-standing hyperglycemia, it is
likely that intensive treatment in children would
be beneficial. In adults, type 2 diabetes is often
detected 7–10 years after it actually develops.
6
This may be the case in children. If this occurs
it would increase the likelihood that adolescents
would present at diagnosis with such associated
co-morbidities as retinopathy, nephropathy, neu-
ropathy, hypertension, and/or dyslipidemia.
Initiation of intensive treatment in children
presents some risks. Few would argue that if med-
ical nutrition therapy were selected as the solo
therapy and successfully reduced blood glucose,
blood pressure, and lowered weight this regimen
would be beneficial at very low risk. On the
other hand, some would argue that reliance on
metformin and/or insulin may present a greater
risk of adverse events. While metformin presents
no risk of hypoglycemia or weight gain, its use
in children has been limited and whether there
are consequences remains unclear. Insulin, which
has been used in children since 1922, has its
own risks: hypoglycemia and weight gain. Anti-
hypertensive drugs also have unknown risks in
children. Such risks, some argue, outweigh the
158 TYPE 2 DIABETES AND METABOLIC SYNDROME IN CHILDREN AND ADOLESCENTS
benefits of reduced microvascular and macrovas-
cular disease.
The principle followed in S taged Diabetes Man-
agement is to optimize metabolic control without
relying on pharmacologic agents when possible.
Nevertheless, when blood glucose or blood pres-
sure is elevated or when medical nutrition therapy
alone fails, SDM supports the careful initiation of
pharmacological agents.
Overview of treatment options for children and
adolescents with type 2 diabetes
It would be preferable to identify a single treat-
ment option that addresses many of the compo-
nents of the metabolic syndrome. Among the three
options (medical nutrition, metformin, or insulin)
for treatment of type 2 diabetes, medical nutri-
tion therapy does just this. In children medical
nutrition therapy takes on special significance. An
appropriate food plan to assure normal growth and
development must be balanced with one that helps
to achieve glycemic targets, maintain reasonable
weight and not contribute to either hypertension or
dyslipidemia. In conjunction with exercise, med-
ical nutrition therapy aims at improved glycemic
control through modifications in daily carbohy-
drate intake and total number of calories. Too
few studies exist in children and adolescents re-
lated to medical nutrition therapy as treatment
for type 2 diabetes. While there are some par-
allels with adults, such as the effect of weight
loss on glycemic control, it is still uncertain as
to how much caloric reduction is appropriate in
light of the need to assure proper growth and
maturation.
Obese children tend to be more sedentary. There
are data that suggest that caloric utilization by
obese children is less than half that of normal-
weight children due to this inactivity. Thus in-
creased activity and weight reduction are needed
to reduce insulin resistance, lower plasma insulin
levels, and improve glycemic control.
When medical nutrition therapy fails to im-
prove, for example, glycemic control or when
blood glucose levels are moderately high at di-
agnosis (fasting plasma glucose 200–300 mg/dL
(11.1–16.6 mmol/L), metformin combined with
medical nutrition therapy is required. This non-
hypoglycemic agent (a biguanide) has its major
effect on suppression of excessive hepatic glucose
output. If this fails to restore normal blood glucose
levels, or if blood glucose levels are beyond the
effective range of metformin at diagnosis, insulin
alone may be indicated. Insulin based therapies
depend upon a f ood/activity plan to help by re-
ducing or maintaining weight (improving insulin
sensitivity) and assure that there i s an appropriate
amount of carbohydrate at each meal to prevent
both hypoglycemia and hyperglycemia. Exoge-
nous insulin therapies work by augmenting the
individual’s own endogenous production of in-
sulin. Meals, snacks, and exercise/activity must
be synchronized with the pharmacokinetics of in-
sulin action. Current therapy is a combination
of short-, intermediate-, and long-acting insulin,
Exogenous insulin in its two short-acting forms,
regular and rapid acting, are used to cover post-
meal rises in blood glucose or t o correct cur-
rently elevated glucose levels. Intermediate-acting
NPH or long-acting ultralente and glargine pro-
vide basal insulin requirements. Because of vari-
ation in action patterns, hypoglycemia may occur
if too much insulin is administered, insufficient
carbohydrate is ingested, or the timing of meals,
insulin, and exercise is not synchronized. Referral
for medical nutrition therapy is highly recom-
mended when i nitiating insulin therapy to avoid
excessive weight gain associated with initiation
of this therapy.
The remainder of the chapter is divided into
three inter-related sections. The first is related to
obesity, the second to the detection and treatment
of type 2 diabetes, and the third to the other
components of the metabolic syndrome.
OBESITY AND WEIGHT MANAGEMENT IN CHILDREN AND ADOLESCENTS 159
Obesity and weight management in children and
adolescents
This discussion provides the basis for screen-
ing, diagnosis and the treatment of obesity and
weight related problems with children. It begins
with the Weight Management for Children and
Adolescents Practice Guidelines, followed by the
Master DecisionPath. The latter lays out an or-
derly sequence of therapeutic interventions that
target specific elements of weight management.
Specific DecisionPaths for each treatment options
along with a complete rationale for decisions are
also presented.
Weight Management Practice
Guidelines
Staged Diabetes Management Practice Guidelines
are structured to address screening and diagno-
sis, treatment options, metabolic targets, monitor-
ing, and follow-up. Figure 5.2 shows the Weight
Management for Children and Adolescents Prac-
tice Guidelines. Specific DecisionPaths provide
the means to safely initiate therapy to achieve
metabolic targets.
Screening
Unlike adults, the distribution of BMI (weight in
kilograms/height in meters
2
in children and ado-
lescents is age related. Standard growth charts for
girls and boys are provided by the US National
Center for Health Statistics (Figures 5.3 and 5.4).
They are meant for an American population and
based on a cross-section of individuals from var-
ious ethnic and racial groups. For use outside of
the U.S. they need to be carefully adjusted based
on local data. The child should be placed with-
out shoes and hat, erect with the back against
the measuring device. The head should be in the
Frankfort plane (an imaginary line from the lower
margin of the eye socket to the notch above the
tragus of the ear) so that it remains parallel to
the horizontal headpiece and perpendicular to the
vertical measuring bar. Weight should be mea-
sured by a standardized scale without shoes and
heavy clothing. It is important to stress that height
and weight should be determined at each visit and
that the healthcare team continue to discuss appro-
priate weight for height with the patient.
Risk factors
Some children are born overweight for gestational
age. They are often the result of untreated or
poorly treated hyperglycemia in pregnancy. In its
severest form, it is know as fetal macrosomia.
Such children have a birth weight exceeding the
90th percentile for gestational age, they have en-
larged organs and are cushingoid in appearance.
Most children, however, are born normal weight
and become obese due to lifestyle and genet-
ics. The most consistent risk factors for child-
hood obesity are hereditary, insulin resistance,
diet, sedentary lifestyle, and low socioeconomic
status. Additionally, it should be noted that the
probability of a child being overweight is related
to family history of obesity. For example, a child
born to parents that are both overweight has an
80 per cent probability of being an overweight
child compared with only a 7 per cent probability
if both parents are normal weight.
7
This finding
highlights the debate of whether it is nature or
nurture that leads to childhood and adult obesity.
The answer is, both.
Diagnosis
There currently are five categories that children
and adolescents may fall in with regards to
weight (based on age): underweight <5th per-
centile BMI, normal weight 5–85th percentile
BMI, overweight 85–95th percentile BMI, clin-
ical obesity 95–97th percentile BMI and severe
obesity >97th percentile BMI. These percentiles
160 TYPE 2 DIABETES AND METABOLIC SYNDROME IN CHILDREN AND ADOLESCENTS
Screening
Risk Factors
Obtain height and weight on all children Ͼ2 years of age at each visit; using NCHS charts, plot
height, weight and BMI
BMI Calculations
(weight in pounds/height in inches/height in inches) ϫ 703
metric: weight in kilograms/(height in meters)
2
Birth weight Ͼ4000 g or Ͻ2000 g at term
Child of a mother with GDM in any pregnancy
Low economic status
Low self-esteem/self-efficacy
Single-parent household
Use of commodity foods
A diet high in fat/calories/fast foods
Eating snacks with empty calories
Drinking sweetened soft drinks or fruit juice
Sedentary lifestyle, e.g. watching television or using computers/games Ͼ2 hours/day
Lack of involvement with physical activity or sports, especially family based activities
Lack of a home based model for physical activity
Low intake of fruits and vegetables
Disturbed eating behaviors (no structured meals, excessive dining out of home, binge eating)
•
•
•
•
•
•
•
•
•
•
•
•
•
•
•
•
Diagnosis
At risk for overweight Ͼ85th percentile BMI*
Clinical obesity Ͼ95th percentile BMI
Severe obesity Ͼ97th percentile BMI
Treatment
Options
If BMI is 85th–95th percentile start weight management program
If BMI is Ͼ95th percentile; start weight loss program, rule out hypothyroidism,
consider referral to pediatric endocrinologist to rule out endocrine abnormality
start weight mangement program
If no contraindication, start or increase activity program
Avoid numbers-based goals for weight
Encourage caregiver participation
Referral for individual or family counseling should be considered
If available, consider referral to pediatric dietitian
•
•
•
•
•
•
•
Targets
Monitoring
Follow-up
No weight gain; increased activity; BMI within normal percentile for age and gender;
maintain normal growth and development; maintain self-esteem
Maintain normal growth and development; monitor for nutritional adequacy of food intake and
daily activity. Recommend monthly follow-up; monitor height, weight, and BMI
Office visit or counseling as needed; phone contact may be sufficient; positive verbal
reinforcement
Height, weight, and BMI; review activity and nutrition intake; blood pressure; fasting lipid
profile as needed; assess development; positive verbal reinforcement
History and physical; neurologic examination; dental examination; continue nutrition and
activity education; positive verbal reinforcement; pediatric depression assessment; assess for
other components of metabolic syndrome
Weekly
Every 3 Months
Yearly
Figure 5.2 Weight Management for Children and Adolescents Practice Guidelines
must be readjusted for non-U.S. populations and
for minorities within the U.S.
Treatment options
Generally, treatment is designed to provide a long-
term solution to weight management problems.
Depending upon weight category, the treatment
moves from sustaining the current weight (pre-
venting weight gain) to promoting weight loss.
Reduction in ‘empty calories’ such as regular
soda, chips, and sweets will often result in a re-
duction of 250–500 calories/day, which should
result in a 0.5–1.0 pound (0.22–0.45 kg)/week
OBESITY AND WEIGHT MANAGEMENT IN CHILDREN AND ADOLESCENTS 161
34
35
31
29
27
25
23
21
19
17
15
12
BMI
33
32
30
28
26
24
22
20
18
16
14
13
27
25
23
21
19
17
15
12
BMI
26
24
22
20
18
16
14
13
kg/m
2
kg/m
2
AGE (YEARS)
234567891011121314151617181920
SOURCE: Developed by the National Center for Health Statistics in collaboration with
the National Center for Chronic Disease Prevention and Health Promotion (2000).
/>*To Calculate BMI: Weight (kg) Ϭ Stature (cm) Ϭ Stature (cm) ϫ 10,000
or Weight (lb) Ϭ Stature (in) Ϭ Stature (in) ϫ 703
Date Age Weight Stature BMI* Comments
95
90
85
75
50
25
10
5
Figure 5.3 Female BMI-for-age chart
reduction in weight. Each treatment is individu-
alized consisting of changes in dietary intake
combined with activity level. Pharmacological in-
terventions are not an option. A team approach
in which t he family, health care provider, and
patient work together with common and clear
goals is a necessity. Psychosocial issues related
to self-esteem and body image must also be taken
into account.
Targets
The short-term goal is to stop weight gain with
the long-term goal to re-establish normal BMI.
162 TYPE 2 DIABETES AND METABOLIC SYNDROME IN CHILDREN AND ADOLESCENTS
34
35
31
29
27
25
23
21
19
17
15
12
BMI
33
32
30
28
26
24
22
20
18
16
14
13
27
25
23
21
19
17
15
12
BMI
26
24
22
20
18
16
14
13
kg/m
2
kg/m
2
AGE (YEARS)
234567891011121314151617181920
SOURCE: Developed by the National Center for Health Statistics in collaboration with
the National Center for Chronic Disease Prevention and Health Promotion (2000).
/>*To Calculate BMI: Weight (kg) Ϭ Stature (cm) Ϭ Stature (cm) ϫ 10,000
or Weight (lb) Ϭ Stature (in) Ϭ Stature (in) ϫ 703
Date Age Weight Stature BMI* Comments
95
90
85
75
50
25
10
5
Figure 5.4 Male BMI-for-age chart
One strategy that works well in children and
adolescents that are still growing in height is
to work on maintaining current weight and hav-
ing the patient ‘grow’ into a more appropri-
ate BMI. Weight loss of approximately 0.5–1.0
pound (0.22–0.45 kg)/week is a reasonable target.
The length of time it will take to accomplish
weight loss depends upon numerous factors. These
factors include the patient’s willingness to par-
ticipate in the weight loss/maintenance process,
family support, and ability to participate in ac-
tivity/exercise. The process is one of behaviour
change and thus requires several small changes in
behaviour with achievable goals established along
the way. This process must also assure proper
growth and development.
OBESITY AND WEIGHT MANAGEMENT IN CHILDREN AND ADOLESCENTS 163
Monitoring
It is recommended that the patient keep a daily
diary for activity and food intake and that this is
reviewed at each office visit at which time height
and weight is measured and BMI calculated.
Follow-up
During the initial intervention, weekly contact
with the health care provider and at least monthly
office visits to calculate the BMI is recommended.
Thereafter, quarterly visits are recommended until
weight goals are reached. Because these children
are at high r isk for any of the co-morbidities
associated with obesity, it is advisable to evaluate
lipid, glucose, and blood pressure and to assess
overall growth and development. On an annual
basis a complete review for insulin resistance and
weight-related disorders should be completed.
Weight management in children
and adolescents Master
DecisionPath
Weight management is a behavioural issue. The
predominant interventions rely on a series of be-
havioural approaches that target specific actions
concerning eating habits and physical activity.
The overall approach seeks first to replace high-
calorie foods and drinks with lower-calorie sub-
stitutes; if this fails, then to reduce energy intake
while increasing energy output; and if this fails,
to restrict intake to very specific foods and drink.
The Weight Management in Children and Ado-
lescents Master DecisionPath (Figure 5.5) stages
the actions in such a manner as to make certain
that the major factors are addressed. The assess-
ment begins with understanding the eating habits
of the patient. Since snack foods contribute a sub-
stantial number of empty calories and are often at
the center of poor nutrition, the clinical decision-
making identifies the current snacking habits and
seeks to replace each snack with a reasonable and
healthy substitute (Figure 5.6). After snacks are
Assess the following risk areas
by asking the child/caregiver the
following questions in a positive
manner and prioritize risk areas
with child/caregiver agreement
Follow Weight Management:
Snacks
Follow Weight Management:
Drinks
Follow Weight Management:
Activity
Follow Weight Management:
Timing of Meals
Follow Weight Management:
Fruits and Vegetables
Follow Weight Management:
Fast Foods
Child or adolescent in need of
weight management
Does the child/caregiver
choose healthy snacks?
Does the child/caregiver
choose low-calorie/fat drinks
for meals and snacks?
Does the child engage in 30
minutes or more activity/day?
Does the child/caregiver
have specific meal and/or
snack times?
Does the child eat 5 or more
fruits and vegetables most days?
Does the child/caregiver dine
out Ͼ3 days per week?
Assess/re-evaluage each goal
every 2–4 weeks
YES
YES
YES
YES
YES
YES
NO
NO
NO
NO
NO
NO
Figure 5.5 Weight Management in Children and
Adolescents Master DecisionPath
addressed, the next area to consider is what the
child or adolescent is drinking (Figure 5.7). Once
snacks and drinks are addressed physical activity
is reviewed (Figure 5.8). With the first three ar-
eas completed, it is possible to ‘routinize’ some
of the behaviours. Setting times for meals and
snacks helps to establish a pattern for future be-
haviours (Figure 5.9). Establishing a target list of
preferred foods, making certain that the child or
adolescent is eating healthy food choices such as
fruits and vegetables needed for proper growth
and development is the next step (Figure 5.10).
Finally, addressing issues such as dining out and
‘fast food’ habits completes the comprehensive
approach (Figure 5.11).
164 TYPE 2 DIABETES AND METABOLIC SYNDROME IN CHILDREN AND ADOLESCENTS
Child or adolescent
with priority of healthy
snack choices
Does child choose
low calorie/fat
snacks?
Give praise; emphasize
variety of food choices;
focus on fruits, vege-
tables and high fiber
choices
Goal: Child will make low calorie/low fat snack choices
most of the time
Replace:
cookies/cake/
candy
fried chips/crackers
“sweet” breads
(banana, cranberry)
juice
ice cream
stick butter
processed meats
(bologna, sausage)
processed cheese
cream soup
With:
fruits, vegetables
cereal/granola bar, instant oatmeal
english muffin
fruits and vegetables, baked chips
crackers, graham crackers,
air-popped or light popcorn, jerky
whole fuits
portion size ice cream bars/cups,
yogurt, fruit ice, sugar-free jello
tub (soft) margarine
lower-fat meats (turkey ham, roast
beef)
part skim cheese, reduced-fat milk
cheeses
broth based soup
Reduce:
Portions
Number of snacks
by using serving size on package label
by planning snacks, eating every 4–5 hrs
Restrict:
Distractions
Eating
no TV, computer games or homework
while eating
by eating all snacks in designated
eating area
YES
NO
Figure 5.6 Weight Management: Snacks
Exercise assessment
The importance of exercise in restoring a bal-
ance between energy intake and expenditure is
paramount in weight management. Increased ac-
tivity level improves insulin sensitivity, which has
a direct impact on the disorders associated with
obesity and the metabolic syndrome. Developing
a physical activity prescription for children and
adolescents must take into account ‘normal’ daily
activities and then use t hese activities as the ba-
sis for improvement. In general, there is no need
for an extensive assessment of the child’s cardio-
vascular fitness. However, severely obese children
Goal: Child will choose decreased high calorie/low fat drinks
most of the time
Replace:
whole milk
2% milk
1% milk
flavored drinks or
regular soft drinks
sport drinks
diet caffeine-free soda
juice
With:
2% milk
1% milk
skim milk
sugar-free flavored drinks (Kool-
Aid
®
) or diet caffeine-free soft drinks
water with lemon or lime
water with lemon or lime
whole fruit
Reduce:
Liquid portion
Calorie content
by using regular or small
drinking cups
by adding one-half water and/or
mineral water to increase
volume (e.g. half juice, half water)
Restrict:
All fluids to water between meals and snack times
Does child choose
low calorie/fat drinks for
meals and snacks?
Give praise; encour-
age water intake
YES
NO
Child or adolescent
with priority of healthy
drink choices
Figure 5.7 Weight Management: Drinks
may have underlying cardiovascular disease, thus
it is recommended that for any obese child or
adolescent for whom a major increase in activ-
ity is being recommended a baseline cardiovas-
cular profile be completed. Activities should be
comfortable, frequent, consistent, and reasonable.
They should be based on the child’s usual sched-
ule, ability and motivation. Fitting exercise into
the lifestyle of most children requires some inno-
vative thinking. Benefiting from school based and
after school activities should be strongly consid-
ered.
OBESITY AND WEIGHT MANAGEMENT IN CHILDREN AND ADOLESCENTS 165
Reduce:
Time spent in sedentary activities (e.g. stand up or walk
around while talking on the phone; do household tasks
during commercials; walk to get the mail; go to friend’s
house)
Restrict: Limit TV, video and computer time to р2 hours a
day
Goal: Child will engage in at least 30 minutes of activity per day
Replace:
casual walking
board games
computer, video,
TV time
during TV, video,
computer time
elevator/escalator
isolation
With:
brisk walking and competition
using pedometers
active games (field sports, martial arts)
biking, walking, rollerblading
take 5 min activity breaks
every 30 min (e.g. during
commercials, between video
games, homework)
use of stairs
face to face conversation
extracurricular groups/activities
Does child engage
in 30 min or more
of activity per day?
See also Activity
Assessment
Give praise; focus on
activities for the entire
family
YES
NO
Child or adolescent
with priority of
increased activity
Figure 5.8 Weight Management: Activity
In general, no restrictions are placed on chil-
dren and adolescents with a BMI less than the
85th percentile. However, as the BMI percentile
increases the amount and types of activity must
be considered (Figure 5.12). For example, chil-
dren with a BMI between the 85th and 95th per-
centiles should be able to achieve the goal of
activities that reach between 60 and 85 per cent
of maximum heart rate four to six times each
Child or adolescent
with priority of specific
meal and/or snack times
Does the family have
specific meal and/or
snack times?
Give praise; reinforce
importance of breakfast
and spreading food intake
throughout the day
YES
NO
Goal: Child will have 3 spaced meals, snacks included, if
more than 4-5 hours between meals
Replace:
scattered/grazing/
unplanned eating
no breakfast
With:
established daily family meal and,
if needed, snack times;
focus on family interaction at
mealtimes
emphasis on breakfast for all
family members
Reduce:
Number of unplanned snacks during day; scheduled snack times
for the entire family
Restrict:
Distractions during mealtime (TV, homework, computer)
Eating to dining area; no eating in bedroom, in front of TV or
computer
Figure 5.9 Weight Management: Timing of Meals/
Snacks
week within 10 weeks of the onset of the ac-
tivity regimen. This contrasts significantly with
children who have severe obesity (>97th per-
centile BMI). For these children, activity level
should only be under professional guidance. They
should be encouraged to exercise up to their
own limitations as often as is possible. The
exercises should be low impact, such as swim-
ming or walking, with adequate rest upon com-
pletion.
If the exercise prescription is ineffective, con-
sider re-setting the goals. Determine the patient’s
readiness to do exercise, re-educate as to the rela-
tionship between exercise and weight control, and
consider referral to an exercise specialist.
166 TYPE 2 DIABETES AND METABOLIC SYNDROME IN CHILDREN AND ADOLESCENTS
Does the child eat 3
or more fruits and/or
vegetables a day?
Give praise; reinforce wide
variety of fruits and
vegetable choices for entire
family
YES
Child or adolescent
with priority of
increasing fruits and
vegetables
NO
Goal: Child will eat 5 fruits and/or vegetables most days
Replace:
simple
carbohydrates
no fruit and/or
vegetables
With:
complex carbohydrates (any
fruit and/or vegetable)
start with goal of 1 snack or 1 meal/
day to include fruit and/or vegetable
Reduce:
fruit juice
processed fruit,
sugared snacks
(e.g. fruit roll-up,
gummi snacks)
whole fruit
complex carbohydrates
(e.g. whole fruit or dried fruit or fruit
canned in its own juice)
Restrict:
Deep fat fried vegetables
Added fat on vegetables, e.g. cheese, alfredo, or butter sauce
Figure 5.10 Weight Management: Fruits and Veg-
etables
Child or adolescent with
priority of decreasing fast
food/restaurant dining
Does the child eat in
a restaurant or have
fast food less than
3 times/week?
Give praise;
reinforce proper portion
sizes and low
calorie drinks when
eating out
Goal: Child will eat in restaurant/fast foods Ͻ3 times/week
Replace:
hot dog or bratwurst
fried chicken
breaded fish fillet/shrimp
meat pizza
fried chips or french fries
malted milk or milk shake
regular salad dressing
mayonnaise/tarter sauce
alfredo/white sauce
With:
hamburger or grilled chicken breast
baked or broiled chicken
broiled/baked fish fillet, broiled shrimp
cheese or vegetable pizza
vegetable salad, fruit, or
cottage cheese
small ice cream cone
light or fat free dressing
mustard or ketchup/cocktail sauce
marinara/tomato sauce
Reduce:
large fries
large drink
Restrict:
Large/super size portions and double servings
YES
double cheeseburger
cheese, tarter sauce,
mayonnaise, butter
sour cream, salad dressing,
syrup
small fried potatoes
regular/small drink
regular hamburger
reduce portion to 1/2 size; request
portion on the side
NO
Figure 5.11 Weight Management: Fast Food
Type 2 diabetes in children and adolescents
(The following guidelines are for non-pregnancy.
Type 2 diabetes complicated by pregnancy and
gestational diabetes are discussed in Chapter 7.)
This section provides the basis for screening,
diagnosis and the treatment of type 2 diabetes
in children and adolescents. It begins with the
Type 2 Diabetes Practice Guidelines, followed
by the Master DecisionPath. The latter lays out
an orderly sequence of therapeutic stages shown
to improve glycemic control. Specific Decision-
Paths for each stage (treatment options) as well as
Diabetes Management Assessment DecisionPaths
(medical visit, education, nutrition, adherence as-
sessment) along with a complete description of
each item and the rationale for decisions are also
presented.
As this section is reviewed, note the following:
• Diagnosis of diabetes should be documented
in the chart and meet criteria set by the Amer-
ican Diabetes Association or other similar
national organization and the World Health
Organization.
8
• All individuals with diabetes should be treated
with medical nutrition therapy, either as a
primary therapy or in combination with phar-
macologic agents.
TYPE 2 DIABETES IN CHILDREN AND ADOLESCENTS 167
BMI
%
Recommended
Activities
Intensity Frequency
Ͻ85th
No activity or inten-
sity restrictions
85th–
95th
Brisk walking, stair
climber, field sports,
hiking, aerobic dance,
rollerblading, bicycling,
basketball, martial arts,
swimming, strength/
aerobic circuit training
95th–
97th
Swimming, bicycling,
strength/aerobic circuit
training, recumbent
bike, interval walking
(walking with frequent
rests as necessary,
increase work/rest ratio
each week)
Ͼ97th
Weekly supervised
training by an exercise
professional
Recommended non-
weight bearing aerobic
activities: swimming,
recumbent bike,
strength/aerobic circuit
training, seated aerobics,
arm ergometry (use
interval strategy when
appropriate, increase
work/rest ratio each
week as tolerated)
Moderate to
vigorous
(60–85% of
maximum
heart rate)
Low to mod-
erate
(Ͻ50–70%
of maximum
heart rate)
As tolerated
1–2ϫ/week
(weeks 1–4),
3–4ϫ/week
(weeks 5–10),
4–6ϫ/week
(weeks 10ϩ)
1–2ϫ/week
(weeks 1–4),
3–4ϫ/week
(weeks 5–10),
4–6ϫ/week
(weeks 10ϩ)
1ϫ/week or as
tolerated
(weeks 1–4),
3–4ϫ/week
(weeks 5–10),
4–6ϫ/week
(weeks 10ϩ)
Figure 5.12 Activity recommendations for chil-
dren and adolescents
• At diagnosis, metformin needs careful consid-
eration since some factors such as underlying
renal impairment or pregnancy may preclude
its use.
• If oral agent therapy fails to improve and
eventually restore glycemia to within target
goals a regimen including combination oral
agent and insulin may be required.
• Severe hyperglycemia (BG >300 mg/dL or
16.9 mmol/L; and/or HbA
1c
>11 per cent)
requires immediate initiation of insulin ther-
apy.
• Reversing direction in the Master Decision-
Path is possible. Patients started on insulin
can, with appropriate lifestyle modifications,
stop insulin and start metformin therapy or
medical nutrition therapy alone to control
blood glucose levels. This is especially true
in children and adolescents once glucose tox-
icity is reduced, allowing for improved β-cell
function.
• Diabetes should be treated from a multidisci-
plinary approach. The Diabetes Management
Assessment DecisionPaths review the prac-
tices of dietitians, nurse educators, and psy-
chologists.
• Type 2 diabetes i s part of a metabolic syn-
drome; such patients are at higher risk for de-
veloping hypertension, dyslipidemia, and re-
nal disease and should therefore be carefully
evaluated and closely monitored thereafter.
Type 2 Diabetes Practice
Guidelines
The practice guidelines for type 2 diabetes are
divided into seven sections: screening, diagnosis,
treatment options, targets, monitoring, follow-up,
and complications surveillance (Figure 5.13).
Screening
Identifying the child or adolescent with type 2
diabetes begins with surveillance for risk fac-
tors, which are listed in Figure 5.13. There are
two different screening approaches. The most
economical screening method is to use capil-
lary blood measured by a reflectance meter. This
is not a replacement for a laboratory measure-
ment, but is sufficiently accurate to justify diag-
nostic testing. If capillary BG is used, it should
be first adjusted for differences between plasma
and whole blood (if the meter has not already
been calibrated to plasma). A casual capillary
value of >140 mg/dL (7.8 mmol/L) or a fasting
>100 mg/dL (5.6 mmol/L) would be sufficient
evidence to require follow-up with a diagnostic
test. The alternative is to use the more costly, but
more accurate, laboratory fasting or casual plasma
glucose value as the screening test (if positive, it
also serves as one of two diagnostic tests).
168 TYPE 2 DIABETES AND METABOLIC SYNDROME IN CHILDREN AND ADOLESCENTS
•
•
•
•
•
•
•
•
•
•
•
•
•
Casual у200 mg/dL (11.1 mmol/L) plus symptoms, fasting у126 mg/dL (7.0 mmol/L), or 100 gram oral glucose tolerance test (OGTT)
2 hour glucose value у200 mg/dL (11.1 mmol/L); if positive, confirm diagnosis within 7 days
Often none
Common: blurred vision; UTI; fatigue; increased urination and thirst, depression
Occasional: increased appetite; nocturia; weight loss; yeast infection; dry, itchy skin,secondary enuresis
Can be positive
Plasma
Glucose
Symptom
s
Urine Ketones
Medical nutrition and activity therapy; metformin; Insulin: Stages 2, 3, 4
Targets
Diagnosis
Risk Factors
Treatment
Options
Ͼ50% of SMBG values within target range
Pre-meal: 70–140 mg/dL (4.4–6.6 mmol/L)
Post-meal: (2 hrs after starting meal): Ͻ160 mg/dL (Ͻ8.9 mmol/L)
Bedtime: 100–160 mg/dL (5.5–8.9 mmol/L)
No severe (assisted) or nocturnal hypoglycemia. Adjust pre-meal target upwards if hypoglycemia unawareness, decreased cognitive
ability, or renal disease.
Within 1 percentage point of uppper limit of normal (e.g., normal 6.0%; target Ͻ7.0%)
Frequency: every 3–4 months
Use HbA
1c
to verify SMBG data
Adjusted for age and height
LDL Ͻ100 mg/dL (2.6 mmol/L), HDL у35 mg/dL (0.090 mmol/L), triglycerides Ͻ150 mg/dL (1.7 mmol/L)
BMI Ͻ85th percentile for gender, age, and height
•
•
•
•
•
•
•
•
•
•
•
Self-Monitored
Blood Glucose
(SMBG)
Glycosylated
Hemoglobin
HbA
1c
Blood Pressure
Lipids
Weight
Meter with memory and log book
Targets
Cardiovascular, renal, retinal, neurological, foot, oral, and dermatological (necrobiosis lipoidicia
diabeticorum, diabetic shin spots, onychomycosis, acanthosis nigricans), limited joint mobility
2–4 times per day (e.g. before meals, 2 hours after start of meal, bedtime); may be modified due to cost, technical ability, activity, availability
of meters; if on insulin, check 3 AM SMBG as needed
Normal, as determined using anthropometric scales/growth charts and indices of pubertal development
Office visit during adjust phase (weekly phone contact may be necessary)
Review hypoglycemic episodes; medications; height, weight, and BMI; review medical nutrition/activity therapy; BP; SMBG data
(download and check meter); HbA
1c
; diabetes/nutrition education
In addition to the 3 month follow-up complete the following: history and physical; fasting lipid profile; microalbuminuria screen; dilated
eye examination at diagnosis and annually; dental examination; neurologic assessment; complete foot examination (pulses, nerves, ABI and
inspection); patient satisfaction evaluation; smoking cessation and family planning as needed
Monthly
Every
3
Months
Yearly
Complications
Surveillance
SMBG
Growth and
Development
Follow-up
Screen all at-risk patients who have 2 or more risk factors every 2 years or more frequently if symptomatic
Screening
Family history of type 2 diabetes in a 1st or 2nd degree relative
Overweight: BMI Ͼ85th percentile for age and gender, central obesity, or weight Ͼ120% of ideal for height
Sedentary lifestyle (persons with no or irregular leisure time activity)
Hypertension: BP Ͼ95th percentile for gender, age, height percentile (see BMI Tables)
Dyslipidemia: HDL р40 mg/dL (1.0 mmol/L) and or triglyceride у250 mg/dL (2.8 mmol/L)
Previous IFG (BG 100–125 mg/dL [5.6–6.9 mmol/L])
Previous IGT (2 hour BG 140–199 mg/dL [7.8–11.0 mmol/L)
Birthweight Ͼ4000 g or Ͻ2000 g at term
Child of mother with GDM in any pregnancy
Acanthosis nigricans
American Indian; Alaska Native; African-American; Asian-American; Native HawaiianPacific Islander; Mexican-American
Premature pubarche, oligomenorrhea, hirsutism
PCOS
Figure 5.13 Type 2 Diabetes Practice Guidelines for Children and Adolescents
Symptoms. Children and adolescents often
present with no symptoms of type 2 diabetes. This
is most probably because the hyperglycemia is
not severe nor has it been prolonged. Frequently,
fatigue, urinary tract infections, yeast infections,
skin irritations, and other vague complaints often
accompany type 2 diabetes. Only when hyper-
glycemia is severe (glucose values >250 mg/dL
[13.9 mmol/L]) do patients develop the classical
symptoms of diabetes: weight loss, dehydration,
polyuria, polyphagia, and polydipsia.
Urine ketones. Type 2 diabetes in adults is
generally distinguished from type 1 diabetes by
the absence of ketonuria at diagnosis. However,
in children and adolescent, ketones may be found
in either type of diabetes. Severe insulin resis-
tance may result in the inability to utilize sufficient
amounts of glucose for energy, thus forcing the
body to utilize fats for energy. A byproduct of this
increased fat metabolism is ketones. On rare oc-
casions, when patients are under stress (exercise,
low-calorie diet, high-protein ketogenic diets) and