Diagnosis and Management of Pituitary Disorders - part 8 ppt
Bạn đang xem bản rút gọn của tài liệu. Xem và tải ngay bản đầy đủ của tài liệu tại đây (1.74 MB, 47 trang )
20
Obesity and Its Treatment in Type 2 Diabetes
Frank L. Greenway and William T. Cefalu
CONTENTS
Introduction
Pharmacologic and Surgical Treatment
Behavior Modification and Lifestyle Change
Pharmacologic Treatment
Diabetes Medications
Obesity Surgery
Conclusions
References
Summary
The prevalence of obesity began rising about 1980, and one third of the US population is now obese. The medical risks of obesity
are linked to insulin resistance, and diabetes prevalence follows that of obesity by a decade. This chapter approaches the treatment
of obesity in the context of diabetes. The role of behavior modification, meal replacements and commercial weight loss programs are
discussed. Medications that were approved before 1986 are approved for short-term use and are chemically related to amphetamine. Obesity
medications approved after 1986 and are approved for long-term use, and include a lipase inhibitor and an inhibitor of norepinephrine
and serotonin reuptake. All these drugs give modest weight losses of less than 5kg in excess of placebo. Rimonabant, a cannabanoid-1
receptor antagonist received an approvable letter from the FDA for the treatment of obesity, but its new drug application was ultimately
rejected. Metformin and acarbose are 2 oral diabetes medications that give some degree of weight loss, as do the injectable diabetes
medications, pramlintide and exenatide. Thiazoladinediones, sulfonylureas and insulin give weigh gain whereas the meglitinides and the
DPP-4 inhibitors are weight neutral. Restrictive surgical procedures like the lap-band are one type of obesity surgery, and restrictive-
malabsorptive procedures like gastric bypass is the other. Weight loss is more durable and the improvement in diabetes is more dramatic
with the restrictive-malabsorptive procedures. Lifestyle change is the basis for all obesity treatments. Obesity medications and surgical
procedures are useful adjuncts and all obesity treatments are best delivered by a team, as is the case with diabetes.
Key Words:
Behavior modification; gastric bypass; lap-band; orlistat; rimonabant; sibutramine.
INTRODUCTION
In very simple terms, obesity can be defined as an excessive amount of body fat, which increases the risk of
medical illness and premature death, and obesity develops over time when an individual consumes more calories
than he/she burns. In this regard, obesity can be viewed as developing secondary to an imbalance in energy
balance. In general, the concept of an energy balance equation implies that food consumption, i.e., “energy intake,”
needs to match energy output, i.e., “energy expenditure,” to maintain a stable body weight. As well described,
the major determinants of energy expenditure are: 1) the thermogenic effect of food (TEF), which represents
the amount of energy used by ingestion and digestion of food we consume; 2) physical activity; and 3) resting
metabolic rate (RMR), determined in large measure by the amount of lean body mass. As research over the recent
past has shown, however, obesity is not such a simple process, as insight into the mechanisms that contribute to its
development have revealed systems that are complex and highly integrated. Over the recent past, as key regulators
From: Contemporary Endocrinology: Type 2 Diabetes Mellitus: An Evidence-Based Approach to Practical Management
Edited by: M. N. Feinglos and M. A. Bethel © Humana Press, Totowa, NJ
333
334 Greenway and Cefalu
of energy balance and insulin signaling have been elucidated, there has been a rapid and substantive increase in
our understanding of underlying physiologic systems and molecular pathways that contribute to the development
of obesity. Although it is recognized that there have been many changes in our environment that promote obesity,
it is also clear that many individuals manage to resist obesity. Thus, there appears to be evidence that the variable
susceptibility to obesity in response to environmental factors is undoubtedly modulated by specific genes (1,2).
It has also been determined that there is a dynamic interplay between adipose tissue and other key tissues in
the body, such as liver, muscle and regulatory centers of the brain. Altered regulation of this integrated and
coordinated system inevitably leads to accumulation of body fat, insulin resistance and development of associated
cardiovasular risk factors.
Clinically, assessments such as body weight and body mass index (BMI) have been used for years to define
obesity. As well described, the BMI assessment represents the relationship between weight and height and is
derived by: 1) calculating either the weight (in kg) and dividing by the height (in meters squared), or; 2) calculating
weight (in pounds) times 704 divided by height in inches squared (3). The importance of the BMI assessment is
that it allows classification of obesity into specific risk categories (Table 1). Such a risk classification is based
on data collected from large population based studies that assessed the relationship between body weight and
mortality and provides the clinician a mechanism for identifying patients at high risk for complications associated
with obesity (4,5).
Although the body weight and BMI have served an important purpose in stratifying individuals at high risk,
the assessment of the specific distribution of the body fat, e.g., central or abdominal obesity, has been suggested
as an even more important assessment. In past studies, body fat distribution has been generally assessed by
anthropometric measurements consisting of waist circumference, the waist/hip ratio (WHR), or skinfold thickness.
Subsequently, more sophisticated techniques such as computed tomography (CT) scans or magnetic resonance
imaging (MRI) scans have been used to assess central obesity. These techniques allow for the specific and precise
quantification of abdominal fat depots. Using such methods, the relationship among specific adipose tissue depots,
e.g., visceral fat depots, to peripheral muscle insulin sensitivity and other metabolic risk factors can be assessed.
The prevalence of obesity has reached epidemic proportions around the world and the rate continues to increase;
it is estimated that over 1 billion adults worldwide are overweight and at least 300 million are considered
obese. There is no question that major contributors to this epidemic across the world include sedentary lifestyles,
consumption of high fat, caloric-dense diets, and increased urbanization. Data from the National Health and
Nutrition Examination Surveys in the United States have shown a dramatic shift in the percentage of the population
considered overweight and obese. The most recent data demonstrate that 64% of the US adult population
is classified as either overweight or obese (defined as BMI > 25). Whereas the prevalence of overweight
adults increased slightly from data collected in 1960, from approx. 30.5% to 34.0 %, the prevalence of obesity
(defined as a BMI >
30) has more than doubled, rising from approx. 13% in 1960 to over 30% in the year
2000 (6). The prevalence of individuals with extreme obesity, as defined by a BMI >
40, has changed even
more dramatically, increasing over 6-fold in the 40-yr period (0.8% versus 4.7%). Thus, there are tremendous
economic, medical and psycho-social consequences of this obesity epidemic, which will need to be addressed.
Table 1
BMI associated disease risk
Obesity class BMI (kg/m
2
) Risk
Underweight <18.5 Increased
Normal 18.5–24 9 Normal
Overweight 25.0–29 9 Increased
Obesity I 30.0–34 9 High
II 35.0–39 9 Very high
Extreme obesity III ≥40 Extremely high
Additional risks: (1)waist circumference >40 inches in men and >35 inches in women;
(2) weight gain of≥5 kg since age 18–20 (3) poor aerobic fitness; and
(4) Southeast Asian descent
Chapter 20 / Obesity in Type 2 Diabetes 335
Table 2
Medical complications associated with obesity
Gastrointestinal Gallstones, pancreatitis, abdominal hernia, NAFLD (steatosis, steatohepatitis, and cirrhosis), and
possible GERD
Endocrine/metabolic Metabolic syndrome, insulin resistance, imparied glucose tolerance, type 2 diabetes mellitus,
dyslipidemia, polycystic ovary syndrome
Cardiovascular Hypertension, coronary heart disease, congestive heart failure, dysrhythmias, pulmonary
hypertension, ischemic stroke, venous stasis, deep vein thrombosis, pulmonary embolus
Respiratory Abnormal pulmonary function, obstructive sleep apnea, obesity hypoventilation syndrome
Musculoskeletal Osteoarthritis, gout, low back pain
Gyneocologic Abnormal menses, infertility
Genitourinary Urinary stress incontinence
Ophthalmologic Cataracts
Neurologic Idiopathic intracranial hypertension (pseudotumor cerebri)
Cancer Esophagus, colon, gallbladder, prostate, breast, uterus, cervix, kidney
Postoperative events Atelectasis, pneumonia, deep vein thrombosis, pulmonary embolus
∗
Adapted from reference 3.
The major concern associated with the obesity epidemic is the expected increase in prevalence of the associated
complications, which seem to affect every major organ system, and particularly the increase in cardiovascular
risk factors (Table 2). Obesity has been suggested to increase an individual’s risk for cancer, gastrointestinal
diseases, arthritis, diabetes, and cardiovascular disease. Specifically, obesity is significantly associated with both
the traditional risk factors (i.e., hypertension, dyslipidemia, and diabetes) and the nontraditional Risk factors
(i.e., fibrinogen and inflammatory markers) of cardiovascular disease. Furthermore, if one considers the presence
of insulin resistance as the hallmark of the cardio-metabolic risk syndrome, it is clear that obesity and insulin
resistance are integrally related.
In addition to the significance of the relationship of obesity to medical complications, there is new understanding
from research studies that adipose tissue is not merely a passive reservoir for energy storage, but is a very active
endocrine organ. Specifically, adipose tissue has been shown to express and secrete a number of bioactive proteins
referred to as adipocytokines in addition to expressing numerous receptors that allow it to respond to different
Table 3
Adipocyte derived Proteins and receptor
Adapted from reference 7
336 Greenway and Cefalu
Table 4
Levels of evidence for diabetes prevention
Recommendation
Level of evidence
(reference #)
Lifestyle intervention causes weight loss of 5-10% and reduces the
incidence of diabetes in people with impaired glucose tolerance
1A (10)
Calorie controlled portions are an important dietary tool to aid in a
weight loss program
1-B (13)
Commercial weight loss programs like Weight Watchers and Jenny
Craig give a clinically significant weight loss that is greater than
self-help weight loss
1A (14,18)
Sibutramine causes a mean weight loss of less than 5kg in excess of
placebo in diabetic subjects
1A (27)
Orlistat causes a mean weight loss of less than 5 kg in excess of placebo
in diabetic subjects
1A (30)
Orlistat and sibutramine give statistically similar weight losses in
diabetic subjects
1B (32)
Rimonabant causes weight loss similar to sibutramine, but gives greater
improvements in insulin resistance
1A (43)
Metformin gives a weight loss of approx 2 kg and reduces the risk of
converting from impaired glucose tolerance to type II diabetes
1A (10)
Pramlintide use in diabetic subjects is associated with weight loss 1A (47)
Exenatide use in diabetic subjects is associated with weight loss 1A (54)
Acarbose use in diabetic subjects is associated with a small weight loss 1A (56)
Restrictive surgical procedures for weight loss like the lap-band regain
about half the lost weight between 1 and 10 yr postoperatively
1C
Restrictive-malabsorptive surgical procedures for weight loss cause a
greater improvement in diabetes than purely restrictive procedures
1C
hormonal signals (Table 3 ). Thus, in addition to its function to store and release energy, adipose tissue is able to
metabolically communicate with other organ systems, and, in this way, contributes greatly to biological processes
that include energy metabolism, neuroendocrine and immune function.
PHARMACOLOGIC AND SURGICAL TREATMENT
The treatment of obesity and diabetes share common ground beyond the fact that the 2 diseases often coexist
in the same patient. Both diabetes and obesity are chronic diseases for which a team approach is required if
treatment is to be optimally safe and effective. The medical treatment of obesity with pharmaceuticals should be
accompanied by a lifestyle program to be optimally effective, and the surgical treatment of obesity should employ
a team approach involving medical and surgical disciplines to deliver treatment with optimal safety. The need
for a team approach presents a challenge, which the presence of diabetes may make both easier and harder to
surmount. On one hand, weight loss is more difficult and more complicated in the presence of diabetes. However,
third party reimbursement for obesity treatment is better in the presence of diabetes, and monetary resources often
determine the treatments that it is possible to deliver.
In discussing the pharmacologic and surgical treatment of obesity in the diabetic patient, we will discuss the role
of behavior modification or lifestyle change programs and strategies to deliver them in the context of a diabetes
practice. We will discuss the medications approved for the treatment of obesity and the most efficient manner to
employ them. We will also discuss the impact of diabetes medications on body weight. Finally, we will discuss the
role of obesity surgery in the treatment of diabetes, the reasons for the greater efficacy of restrictive-malabsorptive
procedures, and the health care team needed to deliver surgical treatment of obesity with optimal safety.
Chapter 20 / Obesity in Type 2 Diabetes 337
BEHAVIOR MODIFICATION AND LIFESTYLE CHANGE
A major challenge to the delivery of a lifestyle change program is the lack of preparation and lack of interest
of most physicians in providing behavior modification to their patients. The argument has been made that the
physician, by virtue of his or her authority, is the most appropriate person to advise the patient on behavior
changes that can result in weight loss. The medical treatment paradigm, however, is not designed to allow
time for this activity and an argument can be offered that doing so would violate the law of comparative
advantage.
Physicians usually see patients every 15 min, and diabetic subjects often have multiple medical problems to be
addressed in that short period of time. It is, therefore, not surprising that the typical physician’s advice consists
of telling patients who need to lose weight that their diabetes would improve with weight loss and increased
physical activity. If patients are to get the behavior modification and lifestyle counseling they need, a referral is
generally required. The insulin requiring diabetic patient in poor control represents a special challenge, but it is
a challenge that most third party payers are prepared to address. The team effort of a diabetic educator, dietitian,
and physician working together can address the needs for a lifestyle change program while, at the same time,
addressing the challenges of dietary regulation and glycemic control. Obesity treatment alone is more problematic,
because it is often not covered by third party payers, leaving patients to seek out lifestyle change programs on
their own.
Behavior modification results in loss of approx 10% of initial body weight over 16–26 wk (8). A 5-10% loss
of initial body weight has been demonstrated to produce clinically important benefits (9). Continued contact
with the therapist can help maintain the major proportion of that weight loss. In the Diabetes Prevention
Program, subjects in the lifestyle change program lost an initial 7% of body weight and at 3 yr maintained a
4% body weight loss accompanied by a 58% reduction in the conversion from impaired glucose tolerance to
diabetes (10).
Weight loss in patients with diabetes represents a particular challenge. Patients with diabetes lose approximately
half the weight of nondiabetic patients (11). Because newly diagnosed diabetic patients seem to lose as much
weight as nondiabetic individuals, the reduced weight loss in diabetic patients may be owing to chronic dietary
restraint related to physicians admonishing diabetic patients to lose weight (12). Regardless of the reason, diabetic
subjects, who have greater medical reasons to lose weight, do so at a reduced rate compared to their nondiabetic
counterparts.
Diabetes Education and Dietitian Counseling
As previously mentioned, many third party payers will cover behavior modification and weight loss for patients
with diabetes through diabetic education programs and coverage for dietitian consultations. As the diabetes
becomes less difficult to manage and is controlled with diet or oral agents, the likelihood of third party coverage
for lifestyle programs to induce weight loss diminishes. Because physicians do not have the time or inclination
to administer lifestyle counseling themselves, other methods to deliver a lifestyle modification program must be
sought. This usually means some type of commercial weight loss program.
Calorie-Controlled Portions
Calorie-controlled portions like SlimFast® once or twice daily have been compared to diets of comparable
caloric content that use an exchange system. A 1-yr long study compared a group taking 2 meal replacements per
day for 3 mo followed by 1 meal replacement/d with a group following an exchange diet of similar calories for 3
mo followed by 1 meal replacement daily. The group starting with meal replacements lost 11.3 ± 6.8% of initial
body weight at 1 yr compared to the group initially using an exchange diet, which lost 5.9 ± 5.0% (13). Thus,
calorie-controlled portions can be a powerful tool in delivering a weight loss program (Fig. 1).
Commercial Weight Loss Programs
Weight Watcher’s is a commercial program that delivers a lifestyle change program using counselors who are
successful graduates of the program. The program uses a balanced diet constructed from food lists, is conducted in
a group context and is relatively inexpensive. A 6-mo controlled trial comparing Weight Watcher’s to a self-help
338 Greenway and Cefalu
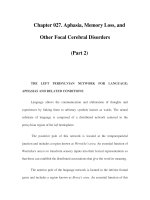
Fig. 1. Mean (+
SEM) percentage change from initial body weight in obese patients during 27 mo of treatment with an energy-
restricted diet containing 5.2-6.3 MJ/d. Data were analyzed on an available case basis. During the first 3 mo (phase 1), patients
were randomly assigned to receive the energy-restricted diet only (group A, ) or to receive the energy-restricted diet with 2
meals and 2 snacks replaced by energy-controlled, nutrient-dense meal-replacement products (group B, •). During the next 24 mo
(phase 2), all patients received the energy-restricted diet and 1 meal and 1 snack were replaced by energy-controlled, nutrient-dense
meal-replacements products. Am J Clin Nutrition 1999;69:198–204.
weight loss group resulted in a 4.8 ± 5.6 kg weight loss in the Weight Watcher’s group compared to a 1.4 +
4.7 kg weight loss in the self-help group (14). This weight loss was greater than 5% of initial body weight and
clinically significant. At 2 yr, subjects in the Weight Watcher’s group maintained more than a 3% weight loss
while weight in the self-help group returned to baseline (15).
A recent review of commercial weight loss programs concluded that the only well controlled trial was the study
of the Weight Watcher’s program, but called for “naturalistic studies” of program results (16). The Jenny Craig
program, which combines calorie-controlled portions with individual behavior and lifestyle counseling, recently
published such a study of their program (17) (Fig. 1). Those subjects who remained in the program for a year lost
15.6 ± 7.5% of their initial body weight. Rock et al published a 1 year study comparing the Jenny Craig program
with a self-help control group (18). The Jenny Craig group lost 7.8 ± 11.1 of initial body weight compared to
0.7 ± 6.2% in the control group (Fig. 2). The Jenny Craig program is more expensive than the Weight Watcher’s
program, in addition to being more effective. These studies give the physician some basis upon which to make a
referral to a commercial weight loss program.
Jenny Craig
N = 70, p < 0.01 by Intent to Treat
–10
–8
–6
–4
–2
0
06
12
Months
Percent Body Weight
Lost
Self Help
Jenny Craig
Fig. 2. A randomized study comparing the Jenny Craig program to self-help weight loss. The Jenny Craig group lost significantly
more weight at 6 and 12 months than the self-help group (ref 18).
Chapter 20 / Obesity in Type 2 Diabetes 339
PHARMACOLOGIC TREATMENT
There are 2 medications presently approved for the long-term treatment of obesity, sibutramine and orlistat.
Medications approved before 1985, the year the NIH conference declared that obesity is a chronic disease, were
approved and tested for up to 12 wk as an adjunct to diet and lifestyle change (19). There is one medication,
remonabant, which was issued an approvable letter for long-term weight loss by the Food and Drug Administration
(FDA) but the New Drug Application (NDA) was rejected by the Food and Drug Administration due to concerns
of depression, anxiety and neurological adverse events. Rimonabant is approved in Europe and some other
countries throughout the world for the treatment of obesity. Medicines used to treat diabetes can have an impact
on body weight in both directions but most diabetes drugs cause weight gain. We will review drugs approved
for the treatment of obesity and describe rimonabant, since it is approved in countries outside the United
States.
Obesity Medication Approved for Short-Term Use
Drugs approved before 1985 for the treatment of obesity are chemically related to amphetamine, and all are
associated with some degree of CNS stimulation. Phentermine and diethylpropion are in DEA class IV and are felt
to have a lower abuse potential than phendimetrazine and benzphetamine (class III) or phenmetrazine (class II).
One might logically ask if these drugs can be useful in a chronic disease when they are all approved for up
to 12 wk of use. There is a study comparing phentermine given continuously to phentermine given every other
month and to a placebo in a 36-wk trial (20). The intermittent use of phentermine gave equivalent weight loss to
continuous use. The intermittent regimen gave lower drug exposure, was less expensive and allowed phentermine
to be used in a way that is consistent with its package insert. Although the long-term studies of these drugs are
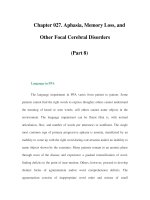
limited, phentermine gave a 7.9 kg greater weight loss than placebo in a 1-yr trial (21) (Fig 3).
Sibutramine
Sibutramine is a reuptake inhibitor of norepinephrine and serotonin. Its use results in 2.8 kg more weight loss
than a placebo at 3 mo and 4.5 kg more weight loss than placebo at 1 yr (22). The adverse events associated with
the use of sibutramine are associated with its adrenergic mechanism of action and include dry mouth, insomnia,
and nausea. Sibutramine treatment is associated with the improvement in glucose and lipids expected with weight
loss. However, sibutramine use is associated with an average increase in pulse rate of 4 beats per min, and the
expected improvement in blood pressure is not seen, probably owing to noradrenergic stimulation.
In a 6-mo dose-ranging study of 1,047 patients, there was a clear dose-response effect, and patients regained
weight when the drug was stopped (23). In a trial in patients who initially lost weight eating a very-low-calorie diet
Phentermine: Continuous and
Intermittent Treatment
-30
-25
-20
-15
-10
-5
0
0
4
wk
8
wk
12
wk
16
wk
20
wk
24
wk
28
wk
32
wk
36
wk
lb.
Placebo
Q O Mo.
Continued
Munro JF et al. Br Med J 1968 Feb 10;1(5588):352
-4
Fig. 3. Intermittent treatment versus continuous phentermine.
340 Greenway and Cefalu
before being randomized to sibutramine (10 mg/d) or placebo, sibutramine produced additional weight loss, while
the placebo-treated patients regained weight (24) The Sibutramine Trial of Obesity Reduction and Maintenance
lasted 2 yr and provided evidence for weight maintenance (25). Patients were initially enrolled in an open-label
phase and treated with 10 mg/d of sibutramine for 6 mo. Of the patients who lost more than 8 kg, two-thirds were
then randomized to sibutramine and one-third to placebo. During the 18-mo double-blind phase of this trial, the
placebo-treated patients steadily regained weight, maintaining only 20% of their initial weight loss at the end of
the trial. In contrast, the subjects treated with sibutramine maintained their weight for 12 mo and then regained
an average of only 2 kg, thus maintaining 80% of their initial weight loss after 2 yr (26). Despite the higher
weight loss with sibutramine at the end of the 18 mo of controlled observation, the blood pressure levels of the
sibutramine-treated patients were still higher than in the patients treated with placebo.
Studies with diabetic patients treated with sibutramine have also been published. In one such trial, sibutramine
20 mg/d was studied in 175 subjects with poorly controlled diabetes. The sibutramine group lost 4.5% of initial
body weight compared to 0.5% in the placebo group. Fasting insulin, glycemic control, triglycerides, HDL
cholesterol, and quality-of-life assessment improved commensurate with the weight loss, but blood pressure and
pulse increased except in those that lost more than 5% of initial body weight (27).
Sibutramine is available in 5-, 10-, and 15-mg doses; 10 mg/d as a single dose is the recommended starting
level, with titration up or down depending on the response. Doses higher than 15 mg/d are not recommended. Of
the patients who lost 2 kg (4 lb) in the first 4 wk of treatment, 60% achieved a weight loss of more than 5%,
compared with less than 10% of those who did not lose 2 kg (4 lb) in 4 wk. Combined data from 11 studies of
sibutramine showed a reduction in triglyceride, total cholesterol, LDL cholesterol levels and an increase in HDL
cholesterol levels that were related to the magnitude of the weight loss.
Orlistat
Orlistat is an inhibitor of pancreatic lipase and causes one-third of dietary fat to be lost in the stool (27). Orlistat
is designed for use with a 30% fat diet. Its use is associated with approx 3.2 kg more weight loss than placebo
at 6 mo and 3.2 kg more weight loss than placebo at 1 yr (28). The adverse events associated with the use of
orlistat can be predicted from its mechanism of action. There is an increased incidence of diarrhea, flatulence and
dyspepsia. Orlistat use results in the expected decrease in blood glucose and blood pressure with weight loss, but
gives a reduction in lipids in excess of that expected for the degree of weight loss, probably because it enforces
a low-fat diet. Orlistat is available in 120 mg doses; and 120 mg 3 times per day with meals is the recommended
dose. An over-the-counter dose of 60 mg 3 times a day is expected to be available shortly.
Orlistat has also been studied in diabetic patients. In a 1-yr study of 391 subjects taking a sulfonylurea, the
orlistat group lost 6.2 ± 0.45% of initial body weight compared to 4.3 +
0.49% in the placebo group, and diabetic
control improved to a greater degree in the orlistat group commensurate with the weight loss (29). A 4-yr trial
randomized 3,305 subjects, 79% with normal glucose tolerance and 21% with impaired glucose tolerance to
orlistat 120 mg 3 times a day or a placebo. At the end of 4 yr, 52% remained in the orlistat group compared to
34% in the placebo group. The orlistat patients not only lost more weight, 3.6 kg versus 1.4 kg, but the conversion
to diabetes was reduced by one-third, to 6.2%, in the orlistat group, compared to 9% in the placebo group (30).
Comparing and Combining Orlistat and Sibutramine
Orlistat and sibutramine were compared in a double-blind randomized clinical trial of 113 subjects over 1 yr .
Both medications induced significant weight loss, but there was no statistically significant difference among them
(31). A similar trial in 144 type 2 diabetic subjects confirmed these results (32).
Because orlistat and sibutramine work by different mechanisms, it is logical to ask whether using them
in combination might give additive weight loss. The first trial addressing this question treated subjects with
sibutramine for 1 yr and added orlistat during weight maintenance. No further weight was lost by the addition of
orlistat (33). Three studies compared sibutamine, orlistat and the combination. The first trial of 80 subjects showed
more weight loss in the combination and sibutramine 10 mg/d groups than either the orlistat 120 mg 3 times per
day or the diet alone groups, but the sibutramine group and the combination group did not differ from each other
(34). This finding was confirmed by a second study using a similar design (35). The third trial compared orlistat
120 mg 3 times daily to sibutramine 10 mg/d and the combination in 89 obese subjects. The sibutramine and the
Chapter 20 / Obesity in Type 2 Diabetes 341
Weight Loss with Orlistat,
Metformin and Sibutramine
n = 150, p < 0.0001
–12
–10
–8
–6
–4
–2
0
06
Months
Percent Weight Loss
Orlistat 120 mg tid
Metformin 850 mg
bid
Sibutramine 10
mg/d
Gokcel A et al. Diab Obes Metab. 2002 Jan;4(1):49–55
Fig. 4. Sibutramine, metformin, and orlistat in diabetes.
combination groups lost 10.2% and 10.6 % of initial body weight, respectively, which was not different but was
greater than the 5.5% weight loss in the orlistat group (36). A trial in obese type 2 diabetic subjects compared
metformin 850 mg twice per day to sibutramine 10 mg twice per day and orlistat 120 mg 3 times per day. The
sibutramine group lost more weight (10.4%) than the orlistat group (6.6%) or the metformin group (8.1%) (37).
In summary, sibutramine use appears to result in superior weight loss and is better tolerated than orlistat, but
orlistat use is associated with the expected decrease in blood pressure not seen with sibutramine (Fig. 4).
Combining Sibutramine with Behavior Therapy
Although there does not seem to be an advantage of combining sibutramine and orlistat, advantage of combining
sibutraminewithbehaviortherapyhasbeenwelldemonstrated.Inonestudy,224subjectswererandomizedto4groups:
1) Sibutramine 15mg/d, delivered by a primary care provider in 8 visits of 10–15 min each, 2) Lifestyle-modification
counseling alone, delivered in 30 group sessions, 3) Sibutramine plus 30 group sessions of lifestyle-modification
counseling (i.e., combined therapy), 4) Sibutramine plus brief lifestyle-modification counseling, delivered by a
primary care provider in 8visits of 10–15 min each.At 1 yr , subjectswho received combined therapylost a mean 12.1
kg, subjects using sibutramine alone lost 5.0 kg, the lifestyle modification alone group lost 6.7kg, andthose receiving
sibutramine plus brief therapy lost 7.5 kg (38) (Fig. 5) (subjects who received combined therapy ost significantly
more weight at all times than subjects in the other three groups. Subjects treated with lifestyle modification alone and
those treated with sibutramine plus brief therapy lost significantly more weight at week 18 than those who received
sibutramine alone, with no other significant differences at any other time. Panel B shows that a last-observation-
carried-forward analysis yielded the same statistical conclusions). The importance of lifestyle modification has been
demonstrated in diabetic subjects as well. Obese type 2 diabetic subjects were randomized to a standard lifestyle
program or a combination program using calorie-controlled portions and sibutramine, in addition to the lifestyle
change program. At 1 yr , the lifestyle group lost 0.8 kg compared to 7.3 kg in the combined group and the combined
group had statistically better glycemic control (39) (Fig. 5).
Rimonabant
Rimonabant is approved for the treatment of obesity in Europe and some other countries, but although it
received an approvable letter from the FDA, its approval was denied by the United States Food and Drug
Administration due to safety concerns about depression, anxiety and neurological adverse events. The mechanism
by which rimonabant causes weight loss is thought to be through inhibition of the cannabinoid-1 receptor. There
are 2 cannabinoid receptors, CB-1 (470 amino acids in length) and CB-2 (360 amino acids in length). The
CB-1 receptor has almost all the amino acids that comprise the CB-2 receptor and additional amino acids at
both ends. CB-1 receptors are distributed throughout the brain in the areas related to feeding, on fat cells, in
the gastrointestinal tract and on immune cells. Marijuana and tetrahydrocannabinol stimulate the CB-1 receptor,
342 Greenway and Cefalu
0
2
4
6
8
A
B
10
Weight Loss (kg)Weight Loss (kg)
12
52
40
Weeks
Sibutramine alone
Sibutramine+brief therapy
Combined therapy
Lifestyle modification alone
Sibutramine alone
Sibutramine+brief therapy
Combined therapy
Lifestyle modification alone
1810630
5240
Weeks
18106
3
0
14
16
0
2
4
6
8
10
12
14
16
Fig. 5. Mean (+
SE) weight loss in the 4 groups as determined by an intention-to-treat analysis (panel A) and a last-observation-
carried-forward analysis (panel B). Subjects who received combined therapy lost significantly more weight at all times than subjects
in the other three groups. Subjects treated with lifestyle modification alone and those treated with sibutramine plus brief therapy
lost significantly more weight at week 18 than those who received sibutramine alone, with no other significant differences at any
other time. Panel B shows that a last-observation-carried-forward analysis yielded the same statistical conclusions. (From Wadden
et al. NEJM 353: 20, 2005).
increase high-fat and high-sweet food intake, and increase fasting levels of endocannabinoids such as anandamide
and 2-arachidonyl-glycerol. The rewarding properties of cannabinoid agonists are mediated through the meso-
limbic dopaminergic system. Rimonabant, being a specific antagonist of the CB-1 receptor, inhibits sweet food
intake in marmosets as well as high-fat food intake in rats, but not food intake in rats fed standard chow. In
addition to being specific in inhibiting highly palatable food intake, pair feeding experiments in diet-induced
obese rats show that the rimonabant treated animals lost 21% of their body weight compared to 14% in the
pair-fed controls. This suggests, at least in rodents, that rimonabant increases energy expenditure in addition to
reducing food intake. CB-1 knockout mice are lean and resistant to diet-induced obesity, but have an accelerated
cognitive decline with aging (40). CB-1 receptors are up-regulated on adipocytes in diet-induced obese mice, and
rimonabant increases adiponectin, a fat cell hormone associated with insulin sensitivity (41).
The results of 3 phase III trials of rimonabant for the treatment of obesity have been published. The first trial to
be announced was called the Rio-Lipids trial. This was a 1-yr trial that randomized 1,018 obese subjects equally to
placebo, rimonabant 5 mg/d, or rimonabant 20 mg/d. The subjects in this trial had untreated dyslipidemia, a BMI
between 27 and 40 kg/m
2
and a mean weight of 96kg. Weight loss was 2% in the placebo group and 8.5% in the
20 mg rimonabant group. In the 20 mg/d rimonabant group, waist circumference was reduced 9cm, triglycerides
Chapter 20 / Obesity in Type 2 Diabetes 343
were reduced by 15% and HDL cholesterol was increased by 23% compared to 3.5 cm, 3% and 12%, respectively,
in the placebo group. In addition, in the 20-mg group, LDL particle size increased, adiponectin increased, glucose
decreased, insulin decreased, C-reactive protein decreased and the metabolic syndrome prevalence was reduced
by half. Although blood pressure did not increase, the expected improvement with weight loss was not seen.
Fifteen percent of subjects in the rimonabant 20-mg group dropped from the trial for adverse events. The most
common reasons for discontinuation were anxiety, depression and nausea, as one might expect from the location
of the CB-1 receptors (42).
In the second 1-yr study called Rio-Europe, 305 subjects were randomized to placebo, 603 subjects to rimonabant
5 mg per day and 599 subjects to rimonabant 20 mg/d. Weight loss at 1 yr in the placebo group was 1.8 kg
compared to 7.2 kg in the 20-mg rimonabant group, and triglycerides, HDL cholesterol, waist circumference,
insulin resistance and the metabolic syndrome all improved (43). The third study, Rio-North America, was a 2-yr
study that randomized 3,045 obese subjects without diabetes to placebo, 5 mg rimonabant or 20 mg rimonabant.
At 1 yr, half the rimonabant groups were re-randomized to placebo. At 1 yr only 55% of the rimonabant 20-mg
group remained in the trial. Weight loss was 1.6 kg in the placebo group and 6.3 kg in the 20-mg rimonabant
group. At 2 yr there was weight regain in those rerandomized to placebo and weight maintenance in those
re-randomized to continued rimonabant (44).
DIABETES MEDICATIONS
There are a wide variety of diabetes medications available. Some decrease weight to a modest extent, others
are neutral, and some, including insulin, increase body weight. Thus, the choice of diabetes medications can play
an important role in whether obesity improves or worsens. If possible, medications that cause weight loss while
improving glycemic control should be considered first in the obese type 2 diabetic subject.
Metformin
Metformin is a biguanide that reduces hepatic glucose production, decreases intestinal glucose absorption and
enhances insulin sensitivity. In clinical trials where metformin was compared with sulfonylureas, it produced
weight loss (45). In one French trial, BIGPRO, metformin was compared to placebo in a 1-yr multi-center study
of 324 middle-aged subjects with upper body obesity and the insulin resistance syndrome (metabolic syndrome).
Subjects on metformin lost significantly more weight (1–2 kg) than the placebo group, and the study concluded
that metformin may have a role in the primary prevention of Type 2 diabetes (46).
The best trial of metformin, however, is the Diabetes Prevention Program, which enrolled individuals with
impaired glucose tolerance. Subjects were over 25 yr of age and overweight, with impaired glucose tolerance.
They were randomized to lifestyle (N = 1,079), metformin (N = 1,073) or usual care (N=1082). At the end of
2.8 yr, on average, the trial was terminated because lifestyle and metformin were clearly superior to usual care.
During this time, the metformin-treated group lost 2.5% of their body weight (p < 0.001 compared to usual
care), and the conversion to diabetes was reduced by 31% compared to placebo. Metformin was most effective
in reducing conversion to diabetes in those who were younger and more overweight (10). Although metformin
does not produce enough weight loss (5%) to qualify as a “weight-loss drug” using the FDA criteria, it would
appear to be a very useful choice for overweight individuals with diabetes or those at high risk for diabetes.
Pramlintide
Amylin is secreted from the beta cell along with insulin, and amylin is deficient in type 1 diabetes where beta
cells are immunologically destroyed. Pramlintide, a synthetic amylin analog, is approved by the FDA for the
treatment of diabetes. Unlike insulin, pramlintide is associated with weight loss. Maggs et al analyzed the data
from two 1-yr studies in insulin treated type 2 diabetic subjects randomized to pramlintide 120 mcg twice daily
or 150 mcg 3 times daily (47). Weight decreased by 2.6 kg and hemoglobin A1c decreased 0.5%. When weight
loss was analyzed by ethnic group, African Americans lost 4 kg, Caucasians lost 2.4 kg, Hispanics lost 2.3 kg,
and the improvement in diabetes correlated with the weight loss, suggesting that pramlintide is more effective
in an ethnic group with the greatest obesity burden. The most common adverse event was nausea, which was
344 Greenway and Cefalu
usually mild and confined to the first 4 wk of therapy. Thus, pramlintide should be considered in insulin treated
patients with obesity and type 2 diabetes.
Exenatide
Exendin-4 (exenatide) is a 39-amino-acid peptide that is produced in the salivary gland of the Gila monster
lizard and has been approved for the treatment of type 2 diabetes. It has 53% homology with GLP-1 but has
a much longer half-life. Exenatide decreases food intake and body weight gain in Zucker rats while lowering
HbA1c (48), inducing satiety and weight loss with peripheral administration and crossing the blood brain barrier
to act in the central nervous system (49,50). Exenatide increases beta-cell mass to a greater extent than would
be expected for the degree of insulin resistance (51). In humans, exenatide reduces fasting and postprandial
glucose levels, slows gastric emptying and decreases food intake by 19% (52). The side effects of exenatide in
humans are headache, nausea and vomiting that are lessened by gradual dose escalation (53). Exenatide at 10
mcg subcutaneously per day or a placebo was given for 30 wk to 377 type 2 diabetic subjects who were failing
maximal sulfonylurea therapy. In the exenatide group, the HbA1c fell 0.74% more than placebo, fasting glucose
decreased and there was a progressive weight loss of 1.6kg (54). In ongoing open-label clinical trials, the weight
loss at 18 mo is –4.5 kg without using behavior therapy or diet and –5.3 kg at 3 years (55).
Acarbose
Acarbose, an alpha glucosidase inhibitor that is approved for the treatment of diabetes, has been evaluated for
weight loss in a 9-mo trial randomizing 354 obese type 2 diabetic subjects to acarbose or placebo. The placebo
group gained 0.3 kg while the acarbose group lost 0.5 kg (56). Although this is a small weight loss, it was statisti-
cally significant, and even the lack of weight gain can be a victory in treating the obese type 2 diabetic individual.
DPP-4 Inhibitors
Sitagliptin, an inhibitor of DPP-4, is a recently approved class of medications for the treatment of diabetes, and
there are other DPP-4 inhibitors in development. DPP-4 is the enzyme that breaks down the incretin hormones
from the gut, like glucagon-like peptide-1 (GLP-1). Clinical trials with sitagliptin show it to be weight neutral
and to decrease glycohemoglobin by approximately 1% (57)
Diabetes Drugs Causing Weight Gain
Although the meglitinides seem to be weight neutral, sulfonylurea medication gives an average 0.42 kg weight
gain per year and insulin therapy gives an average 0.44 kg per year weight gain (58). Thiazolidinediones are the
most problematic diabetes drugs in terms of weight gain. Subjects gained an average of 15–20 pounds over 3 yr
of treatment that tended to plateau in subsequent years (59). Thus, this drug class presents the greatest challenge
to the obese type 2 diabetic patient needing to lose weight, despite its recognized efficacy in improving glycemic
control.
OBESITY SURGERY
As reviewed earlier in this chapter, behavior modification yields an approximate 10% weight loss, with similar
results from obesity drugs. Medical weight loss programs rarely last more than 2 yr, and weight maintenance
results have been disappointing. The prevalence of class III obesity, a BMI >40kg/m
2
and the degree of obesity
that would qualify for obesity surgery, increased from 0.5% in 1995 to 7.5% in 2002 in African-American women
alone (60). Individuals with class III obesity cannot, with rare exceptions, lose and keep off the weight needed
to achieve a healthy body weight with medical interventions. It is in that context that those with class III obesity
are turning in greater numbers to obesity surgery.
Surgical procedures have evolved since the 1950‘s, when the first operative attempts to treat obesity were
performed. The present surgical procedures in common use can be divided into those that restrict the stomach,
represented most commonly by the lap-band, and those that both restrict the stomach and have a malabsorptive
component, represented most commonly by the gastric bypass. Although there are other restrictive procedures
such as vertical gastric banding and other restrictive-malabsorptive procedures such as biliopancreatic bypass with
Chapter 20 / Obesity in Type 2 Diabetes 345
and without a duodenal switch, one can generalize the discussion to these 2 classes of surgical procedures. Thus,
this chapter will discuss these 2 classes of surgical procedures separately and comment on the greater efficacy of
restrictive-malabsorptive procedures in preventing and reversing type 2 diabetes.
Restrictive Procedures
The lap-band, a restrictive procedure, is the preferred operation in most of Europe owing to its minimal
distortion of the normal gastrointestinal anatomy and its ease of reversal. Despite these advantages, the weight loss
with this procedure is less (20–25% versus 30–35% of initial body weight) and the need for surgical revision is
higher (10% versus 5%) than restrictive-malabsorptive procedures like the gastric bypass (61). The improvement
in diabetes and other obesity associated diseases following restrictive procedures is proportional to the weight
loss. The Swedish Obese Study consisted mostly of restrictive procedures. Weight loss in the lap band group was
20–25% at 1 yr postoperatively but only 10–15% at 10 yr. Only 9 (47%) of the 19 subjects with diabetes had
resolution of their diabetes following the lap band placement. The incidence of developing diabetes at 10 yr was
7% in the surgical group and 24% in the medically treated control group (62). These incidence rate reductions
appear to be related to the weight loss, in contradistinction to the restrictive-malabsorptive procedures, in which
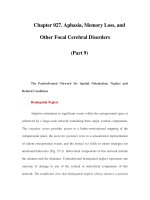
the incidence reduction in diabetes is greater than can be attributed to weight loss alone (63) (Fig. 6)
5
0
–5
–10
–15
Weight Change (%)
–20
Control
Banding
Vertical banded
gastroplasty
Gastric
bypass
–25
–30
–35
–40
–45
0.0
No.of Subjects
Control
Banding
Vertical banded gastroplasty
627
156
451
34
585
150
438
34
594
154
438
34
587
153
438
34
577
149
429
33
563
150
417
32
542
147
412
32
535
144
401
29
627
156
451
34
Gastric bypass
0.5 1.0 2.0 3.0 4.0
Years of Follow-up
6.0 8.0 10.0
Fig. 6. Weight changes among subjects in the SOS study over a 10-yr period. All data are for subjects who completed 10 yrs of
the study. The average weight change in the entire group of surgically treated subjects was almost identical to that in the subgroup
of subjects who underwent vertical banded gastroplasty. The I bars represent the 95 percent confidence intervals (Graph from SOS
study NEJM with lap bond).
346 Greenway and Cefalu
Restrictive-Malabsorptive Procedures
These surgical procedures cause food to bypass the upper gastrointestinal tract, reaching the distal small
intestine earlier and in a less digested state. This causes a decrease in the release of hormones from the upper
gastrointestinal tract, such as ghrelin, a hormone that initiates feeding. This decrease in upper gastrointestinal
hormones is not associated with medical weight loss (64). Hormones such as PYY-3-36 from the distal gut are
increased after gastric bypass: PYY-3-36 has been shown to decrease food intake by 30–35% after intravenous
infusion (65,66). Thus, PYY-3-36 may be partly responsible for the more efficient weight loss seen after bypass
operations compared to purely restrictive procedures. Glucagon-like peptide-1 (GLP-1), another distal gut hormone
that increases after gastric bypass may be partly responsible for the enhanced effect that bypass operations have on
reducing the prevalence of diabetes (67). GLP-1 inhibits pancreatic glucagon secretion stimulates insulin secretion
(68), and increases beta-cell mass (69). GLP-1 only stimulates insulin secretion at high glucose levels, so it is not
associated with hypoglycemia Exenatide, a GLP-1 analog, stimulates the GLP-1 receptor and is a treatment for
diabetes that causes weight loss, as described earlier in this chapter.
Possibly due, in part, to the effects of gastric bypass on gut hormones, the gastric bypass is much more efficient
in reversing diabetes. Pories et al and Hickey et al reported a 14-yr experience with gastric bypass surgery patients,
with an extraordinary 97% follow-up, in which 121 (82.9%) of the 146 patients with type 2 diabetes and 150 (99%)
of the 152 patients with IGT completely normalized their glucose metabolism (70,71) (Fig. 7). In a comparison study
of morbidly obese patients undergoing gastric bypass and morbidly obese controls, Long et al showed the gastric
bypass imparted a greater than 30-fold decrease in the risk of developing type 2 diabetes after weight loss (72).
The return to euglycemia, however, is rapid and is observed within 10 d postoperatively following gastric bypass,
before any significant weight loss occurs (70,71,73). Therefore, the reduction of food intake may be playing an
additional role. Scopinaro et al observed that serum glucose levels normalized in patients with preoperative type
Fig. 7. The gastric bypass produces durable weight loss. Weight loss of the entire cohort of 608 patients is shown in terms of
pounds and percentage loss of excess body weight. If the patients with failed staple lines and stretched anastomoses are removed,
the line is virtually straight (Graph from paries 14year follow-up).
Chapter 20 / Obesity in Type 2 Diabetes 347
2 diabetes as early as 1 mo postoperatively after BPD, when their excess weight was still more than 80% (74).In
addition, despite significant weight loss, many of these gastric bypass patients remain obese by definition. Hickey
et al measured the levels of fasting plasma insulin, glucose, leptin, insulin sensitivity; and dietary habits in 6
morbidly obese women whose weight was stable after gastric bypass and 6 morbidly obese preoperative control
subjects who also had a stable weight. Despite matching these patients for weight, body mass index, percent
body fat, body fat distribution, metabolic rates, and age, the surgical patients had significantly lower serum leptin,
fasting glucose, and fasting insulin, increased insulin sensitivity, and decreased food intake. This study suggests
that the gastric bypass effect on type 2 diabetes is likely secondary to decreased caloric intake and/or change in
gastrointestinal hormones rather than weight loss alone (71).
Support of decreased caloric intake as a mechanism for the effect of obesity surgery on type 2 diabetes is
shown in a study by Pories et al consisting of a sham operation. A patient who was taken to the operating
room for a gastric bypass was unable to undergo completion secondary to a full stomach. Postoperatively, this
patient received the same postoperative diet as those patients who had undergone the gastric bypass. The same
normalization of plasma glucose and insulin levels was observed in this patient while he remained on the diet
as in the patients who underwent gastric bypass. This experimental design is similar to pair-feeding experiments
in animals and suggests that caloric restriction is sufficient to explain the improvement in type 2 diabetes after
gastric bypass during active weight loss (70).
The observation that restrictive-malabsorptive procedures result in superior control of glucose and insulin levels
compared to the restrictive procedures suggests that the surgical bypass procedures may have a role, in addition to
weight loss, in the resolution of type 2 diabetes. Therefore, restrictive-malabsorptive procedures should be given
special consideration in patients with type 2 diabetes and type 3 obesity.
Clinical Considerations of Obesity Surgery
It is particularly important that the surgical treatment of obesity be a team effort. Preoperative evaluation for
sleep apnea and its postoperative management can be life saving. Dietary consultation and treatment to reduce
hepatic fat can increase the ease and safety of the operative procedure. Stopping the use of exogeneous estrogens
and instituting procedures to prevent thromboembolism are essential. Preoperative psychological evaluation to
screen for depression, eating disorders, and other problems common to the severely obese, with postoperative
follow-up, is of particular importance. The postoperative follow-up also involves management of pain without
nonsteroidals, paying close attention to pulmonary hygiene and fluid balance, and insuring against vitamin and
iron deficiency. Just as coronary bypass operations are done with greater safety in centers prepared to do them
and practiced in the procedure, the same is true of obesity surgery, in general, and laparoscopic restrictive-
malabsorptive procedures, in particular. In fact, Medicare has stopped reimbursement for obesity surgery except
in designated Centers of Excellence, which have a team in place and a volume of surgery to insure optimal safety.
For those interested in reading further on this subject, reference (75) is suggested.
CONCLUSIONS
Treatment with obesity pharmaceuticals can result in a 5–10% weight loss that is clinically significant, but
should be delivered in the context of a behavior and lifestyle change program, because such programs not only
increase weight loss efficacy economically, but they also promote healthy living. Restrictive-malabsorptive obesity
surgical procedures have beneficial effects on reversing type 2 diabetes above the weight loss they achieve, and
should be the first consideration for a surgical procedure, if a surgical solution to the obesity is sought in a diabetic
patient. In the case of medical therapy, physicians are often not prepared to administer the essential lifestyle
modification program, which should accompany the use of pharmacological therapy. The surgical treatment of
obesity is complex and requires interaction with dietitians and other health care professionals in addition to the
surgeon. Thus, the optimal treatment of obesity is a team discipline, whether the treatment is surgical or medical.
Fostering this interactive approach gives the best hope for optimal success in treating obesity and type 2 diabetes
which have both been increasing steadily in prevalence since the early 1980s.
REFERENCES
1. Bouchard C. Genetics and the metabolic syndrome. Int J Obes Relat Metab Disord 1995;12 (suppl 1):S52–S59.
348 Greenway and Cefalu
2. Liese AD, Mayer-Davis EJ, Haffner SM. Development of the multiple metabolic syndrome: An epidemiologic perspective. Epidemiol
Rev: 1998; 20: 157–172.
3. Klein S, Wadden T, Sugerman HJ. AGA technical review on obesity. Gastroenterology 2002; 123: 882–932.
4. Troiano RP, Frongillo Jr. EA, Sobal J, Levitsky DA. The relationship between body weight and mortality: a quantative analysis of
combined information from existing studies. Int J Obes Relat Metab Disord 1996; 20: 63–75.
5. Calle EE, Thun MJ, Petrelli MJ et al. Body-mass index and mortality in a prospective cohort of US adults. N Engl J Med 1999; 341:
1097–1105.
6. Flegal KM, Carroll MD, Kuczmarski RJ, Johnson CL. Overweight and obesity in the United States: Prevalence and trends, 1960–1994.
Int J Obes Relat Metab Disord 1998; 22: 39–47.
7. Kershaw EE, Flier JS. Adipose tissue as an endocrine organ. J Clin Endocrinol Metab 2004; 89; 2548–2556.
8. Wadden TA, Butryn ML, Byrne KJ. Efficacy of lifestyle modification for long-term weight control. Obes Res 2004;12 Suppl:
151S–162S.
9. Blackburn G. Effect of degree of weight loss on health benefits. Obes Res 1995;3 Suppl 2:211s–216s.
10. Knowler WC, Barrett-Connor E, Fowler SE, et al. Reduction in the incidence of type 2 diabetes with lifestyle intervention or metformin.
N Engl J Med 2002;346:393–403.
11. Khan MA, St Peter JV, Breen GA, Hartley GG, Vessey JT. Diabetes disease stage predicts weight loss outcomes with long-term
appetite suppressants. Obes Res 2000;8:43–48.
12. Hadden DR, Blair AL, Wilson EA, et al. Natural history of diabetes presenting age 40–69 years: a prospective study of the influence
of intensive dietary therapy. Q J Med 1986;59:579–598.
13. Ditschuneit HH, Flechtner-Mors M, Johnson TD, Adler G. Metabolic and weight-loss effects of a long-term dietary intervention in
obese patients. Am J Clin Nutr 1999;69:198–204.
14. Heshka S, Greenway F, Anderson JW, et al. Self-help weight loss versus a structured commercial program after 26 weeks: a randomized
controlled study. Am J Med 2000;109:282–287.
15. Heshka S, Anderson JW, Atkinson RL, et al. Weight loss with self-help compared with a structured commercial program: a randomized
trial. JAMA 2003;289:1792–1798.
16. Tsai AG, Wadden TA. Systematic review: an evaluation of major commercial weight loss programs in the United States. Ann Intern
Med 2005;142:56–66.
17. Finley C, Barlow C, Greenway F, Rock C, Rolls B, Blair B. Retention rates and weight loss in a commercial weight loss program. Int
J Obes Relat Metab Disord 2006;30:?-?
18. Rock C, Pakiz B, Flatt S, Quintana EL. Randomized trial of a multifaceted commercial weight loss program. Obes (Silver Spring).
2007;15:939–949.
19. NIH Consensus Development Conference Statement. Health implications of obesity. Ann Int Med 1985;103
:1973–1977.
20. Munro JF, MacCuish AC, Wilson EM, Duncan LJ. Comparison of continuous and intermittent anorectic therapy in obesity. Br Med
J 1968;1:352–354.
21. Glazer G. Long-term pharmacotherapy of obesity 2000: a review of efficacy and safety. Arch Intern Med 2001;161:1814–1824.
22. Arterburn DE, Crane PK, Veenstra DL. The efficacy and safety of sibutramine for weight loss: a systematic review. Arch Intern Med
2004;164:994–1003.
23. Bray GA, Blackburn GL, Ferguson JM, et al. Sibutramine produces dose-related weight loss. Obes Res 1999;7:189–198.
24. Apfelbaum M, Vague P, Ziegler O, Hanotin C, Thomas F, Leutenegger E. Long-term maintenance of weight loss after a very-low-
calorie diet: a randomized blinded trial of the efficacy and tolerability of sibutramine. Am J Med 1999;106:179–184.
25. James WP, Astrup A, Finer N, et al. Effect of sibutramine on weight maintenance after weight loss: a randomised trial. STORM Study
Group. Sibutramine Trial of Obesity Reduction and Maintenance. Lancet 2000;356:2119–2125.
26. Fujioka K, Seaton TB, Rowe E, et al. Weight loss with sibutramine improves glycaemic control and other metabolic parameters in
obese patients with type 2 diabetes mellitus. Diabetes Obes Metab 2000;2:175–187.
27. Zhi J, Melia AT, Guerciolini R, et al. Retrospective population-based analysis of the dose-response (fecal fat excretion) relationship
of orlistat in normal and obese volunteers. Clin Pharmacol Ther 1994;56:82–85.
28. O’Meara S, Riemsma R, Shirran L, Mather L, ter Riet G. A systematic review of the clinical effectiveness of orlistat used for the
management of obesity. Obes Rev 2004;5:51–68.
29. Hollander PA, Elbein SC, Hirsch IB, et al. Role of orlistat in the treatment of obese patients with type 2 diabetes. A 1-year randomized
double-blind study. Diabetes Care 1998;21:1288–1294.
30. Torgerson JS, Hauptman J, Boldrin MN, Sjostrom L. XENical in the prevention of diabetes in obese subjects (XENDOS) study: a
randomized study of orlistat as an adjunct to lifestyle changes for the prevention of type 2 diabetes in obese patients. Diabetes Care
2004;27:155–161.
31. Derosa G, Cicero AF, Murdolo G, et al. Efficacy and safety comparative evaluation of orlistat and sibutramine treatment in hypertensive
obese patients. Diabetes Obes Metab 2005;7:47–55.
32. Derosa G, Cicero AF, Murdolo G, Ciccarelli L, Fogari R. Comparison of metabolic effects of orlistat and sibutramine treatment in
Type 2 diabetic obese patients. Diabetes Nutr Metab 2004;17:222–229.
33. Wadden TA, Berkowitz RI, Womble LG, Sarwer DB, Arnold ME, Steinberg CM. Effects of sibutramine plus orlistat in obese women
following 1 year of treatment by sibutramine alone: a placebo-controlled trial. Obes Res 2000;8:431–437.
34. Aydin N, Topsever P, Kaya A, Karasakal M, Duman C, Dagar A. Orlistat, sibutramine, or combination therapy: which performs better
on waist circumference in relation with body mass index in obese patients? Tohoku J Exp Med 2004;202:173–180.
35. Kaya A, Aydin N, Topsever P, et al. Efficacy of sibutramine, orlistat and combination therapy on short-term weight management in
obese patients. Biomed Pharmacother 2004;58:582–587.
Chapter 20 / Obesity in Type 2 Diabetes 349
36. Sari R, Balci MK, Cakir M, Altunbas H, Karayalcin U. Comparison of efficacy of sibutramine or orlistat versus their combination in
obese women. Endocr Res 2004;30:159–167.
37. Gokcel A, Gumurdulu Y, Karakose H, et al. Evaluation of the safety and efficacy of sibutramine, orlistat and metformin in the
treatment of obesity. Diabetes Obes Metab 2002;4:49–55.
38. Wadden TA, Berkowitz RI, Womble LG, et al. Randomized trial of lifestyle modification and pharmacotherapy for obesity. N Engl J
Med 2005;353:2111–2120.
39. Redmon JB, Raatz SK, Reck KP, et al. One-year outcome of a combination of weight loss therapies for subjects with type 2 diabetes:
a randomized trial. Diabetes Care 2003;26:2505–2511.
40. Bilkei-Gorzo A, Racz I, Valverde O, et al. Early age-related cognitive impairment in mice lacking cannabinoid CB1 receptors. Proc
Natl Acad SciUSA2005;102:15,670–15,675.
41. Bensaid M, Gary-Bobo M, Esclangon A, et al. The cannabinoid CB1 receptor antagonist SR141716 increases Acrp30 mRNA expression
in adipose tissue of obese fa/fa rats and in cultured adipocyte cells. Mol Pharmacol 2003;63:908–914.
42. Despres JP, Golay A, Sjostrom L. Effects of rimonabant on metabolic risk factors in overweight patients with dyslipidemia. N Engl J
Med 2005;353:2121–2134.
43. Van Gaal LF, Rissanen AM, Scheen AJ, Ziegler O, Rossner S. Effects of the cannabinoid-1 receptor blocker rimonabant on weight
reduction and cardiovascular risk factors in overweight patients: 1-year experience from the RIO-Europe study. Lancet 2005;365:
1389–1397.
44. Pi-Sunyer FX, Aronne LJ, Heshmati HM, Devin J, Rosenstock J. Effect of rimonabant, a cannabinoid-1 receptor blocker, on weight
and cardiometabolic risk factors in overweight or obese patients: RIO-North America: a randomized controlled trial. JAMA 2006;295:
761–775.
45. Bray GA, Greenway FL. Current and potential drugs for treatment of obesity. Endocr Rev 1999;20:805–875.
46. Fontbonne A, Charles MA, Juhan-Vague I, et al. The effect of metformin on the metabolic abnormalities associated with upper-body
fat distribution. BIGPRO Study Group. Diabetes Care 1996;19:920–926.
47. Maggs D, Shen L, Strobel S, Brown D, Kolterman O, Weyer C. Effect of pramlintide on A1C and body weight in insulin-treated
African Americans and Hispanics with type 2 diabetes: a pooled post hoc analysis. Metabolism 2003;52:1638–1642.
48. Szayna M, Doyle ME, Betkey JA, et al. Exendin-4 decelerates food intake, weight gain, and fat deposition in Zucker rats. Endocrinology
2000;141:1936–1941.
49. Rodriquez de Fonseca F, Navarro M, Alvarez E, et al. Peripheral versus central effects of glucagon-like peptide-1 receptor agonists
on satiety and body weight loss in Zucker obese rats. Metabolism 2000;49:709–717.
50. Kastin AJ, Akerstrom V. Entry of exendin-4 into brain is rapid but may be limited at high doses. Int J Obes Relat Metab Disord
2003;27:313–318.
51. Gedulin BR, Nikoulina SE, Smith PA, et al. Exenatide (exendin-4) improves insulin sensitivity and {beta}-cell mass in insulin-resistant
obese fa/fa Zucker rats independent of glycemia and body weight. Endocrinology 2005;146:2069–2076.
52. Edwards CM, Stanley SA, Davis R, et al. Exendin-4 reduces fasting and postprandial glucose and decreases energy intake in healthy
volunteers. Am J Physiol Endocrinol Metab 2001;281
:E155–161.
53. Fineman MS, Shen LZ, Taylor K, Kim DD, Baron AD. Effectiveness of progressive dose-escalation of exenatide (exendin-4) in
reducing dose-limiting side effects in subjects with type 2 diabetes. Diabetes Metab Res Rev 2004;20:411–417.
54. Buse JB, Henry RR, Han J, Kim DD, Fineman MS, Baron AD. Effects of exenatide (exendin-4) on glycemic control over 30 weeks
in sulfonylurea-treated patients with type 2 diabetes. Diabetes Care 2004;27:2628–2635.
55. Klonoff DC, Buse JB, Nielsen LL, Guan X, Bowlus CL, Maggs DG. Exenatide effects on diabetes, obesity, cardiovascular risk factors
and hepatic biomarkers in patients with type 2 diabetes treated for at least 3 years. Curr Med Res Opin. 2007 Dec 3; [Epub ahead of print].
56. Wolever TM, Chiasson JL, Josse RG, et al. Small weight loss on long-term acarbose therapy with no change in dietary pattern or
nutrient intake of individuals with non-insulin-dependent diabetes. Int J Obes Relat Metab Disord 1997;21:756–63.
57. Ahrén B. DPP-4 inhibitors. Best Pract Res Clin Endocrinol Metab. Dec 2007;21(4):517–533.
58. Chaudhry ZW, Gannon MC, Nuttall FQ. Stability of body weight in type 2 diabetes. Diabetes Care 2006;29:493–497.
59. Bell DS, Ovalle F. Long-term glycaemic efficacy and weight changes associated with thiazolidinediones when added at an advanced
stage of type 2 diabetes. Diabetes Obes Metab 2006;8:110–115.
60. Roberts A, King J, Greenway F. Class III obesity continues to rise in African-American women. Obes Surg 2004;14:533–535.
61. Greenway FL. Surgery for obesity. Endocrinol Metab Clin North Am 1996;25:1005–1027.
62. Sjostrom L, Lindroos AK, Peltonen M, et al. Lifestyle, diabetes, and cardiovascular risk factors 10 years after bariatric surgery. N
Engl J Med 2004;351:2683–2693.
63. Greenway SE, Greenway FL, 3rd, Klein S. Effects of obesity surgery on non-insulin-dependent diabetes mellitus. Arch Surg
2002;137:1109–1117.
64. Cummings DE, Weigle DS, Frayo RS, et al. Plasma ghrelin levels after diet-induced weight loss or gastric bypass surgery. N Engl J
Med 2002;346:1623–1630.
65. Korner J, Bessler M, Cirilo LJ, et al. Effects of Roux-en-Y gastric bypass surgery on fasting and postprandial concentrations of plasma
ghrelin, peptide YY, and insulin. J Clin Endocrinol Metab 2005;90:359–365.
66. Batterham RL, Cohen MA, Ellis SM, et al. Inhibition of food intake in obese subjects by peptide YY3–36. N Engl J Med 2003;349:
941–948.
67. le Roux CW, Aylwin SJ, Batterham RL, et al. Gut hormone profiles following bariatric surgery favor an anorectic state, facilitate
weight loss, and improve metabolic parameters. Ann Surg 2006;243:108–114.
68. Mason EE. Ileal [correction of ilial] transposition and enteroglucagon/GLP-1 in obesity (and diabetic?) surgery. Obes Surg 1999;9:
223–228.
69. Gallwitz B. Glucagon-like peptide-1-based therapies for the treatment of type 2 diabetes mellitus. Treat Endocrinol 2005;4:361–370.
350 Greenway and Cefalu
70. Pories WJ, Swanson MS, MacDonald KG, et al. Who would have thought it? An operation proves to be the most effective therapy
for adult-onset diabetes mellitus. Ann Surg 1995;222:339–350; discussion 350–352.
71. Hickey MS, Pories WJ, MacDonald KG, Jr., et al. A new paradigm for type 2 diabetes mellitus: could it be a disease of the foregut?
Ann Surg 1998;227:637–643; discussion 643–644.
72. Long SD, O’Brien K, MacDonald KG, Jr., et al. Weight loss in severely obese subjects prevents the progression of impaired glucose
tolerance to type II diabetes. A longitudinal interventional study. Diabetes Care 1994;17:372–375.
73. Hughes TA, Gwynne JT, Switzer BR, Herbst C, White G. Effects of caloric restriction and weight loss on glycemic control, insulin
release and resistance, and atherosclerotic risk in obese patients with type II diabetes mellitus. Am J Med 1984;77:7–17.
74. Scopinaro N, Gianetta E, Adami GF, et al. Biliopancreatic diversion for obesity at eighteen years. Surgery 1996;119:261–268.
75. Martin L. Obesity Surgery. New York: McGraw-Hill, 2004.
21
The Liver in Type 2 Diabetes Mellitus
Anna Mae Diehl and Steve S. Choi
CONTENTS
Etiology of Liver Disease in Type 2 Diabetes
Prevalence of NAFLD
Pathogenesis of Diabetes-Related Liver Disease
Diagnosis of NAFLD
Natural History and Prognosis of NAFLD Associated with Type 2 Diabetes
Management of Diabetes-Associated Liver Disease
Future Directions
References
Summary
Type 2 diabetes mellitus is associated with nonalcoholic fatty liver disease (NAFLD). NAFLD is a spectrum of hepatic pathology that
ranges from simple steatosis, on the most clinically benign end of the spectrum, to cirrhosis on the opposite extreme where most liver-related
morbidity and mortality occur. Nonalcoholic steatohepatitis (NASH) is an intermediate lesion characterized by noticeably increased rates
of hepatocyte death, with accompanying inflammatory cell infiltration and variable degrees of fibrosis. Abdominal ultrasound surveys
of adult diabetic populations suggest that at least half have hepatic steatosis. That fatty liver is common among patients with type 2
diabetes is not surprising because work with animal models indicates that fat accumulation within hepatocytes stimulates hepatic production
of inflammatory cytokines that mediate muscle insulin resistance. Liver biopsy series of individuals with type 2 diabetes and hepatic
steatosis demonstrate that liver damage has progressed to NASH in most and that a sizeable proportion have advanced fibrosis, with
cirrhosis in some. There is growing evidence that liver disease contributes significantly to morbidity and mortality in patients with type
2 diabetes. Indeed, at least 3 recent studies indicate that liver-related mortality approaches death rates from cardiovascular disease and
cancer in patients with type 2 diabetes and NASH. Because hepatic insulin resistance appears to play a pivotal role in the pathogenesis
of NAFLD, treatment of NAFLD in individuals with type 2 diabetes focuses on optimizing insulin sensitivity with pharmacologic and
life-style interventions. This approach appears to reduce steatosis, improve hepatic necroinflammation, and lessen fibrosis in many, but not
all, patients. Individuals in whom liver damage progresses to cirrhosis are managed like patients who develop cirrhosis from other liver
diseases. Treatment options for such individuals include orthotopic liver transplantation. Unfortunately, however, NAFLD often recurs in
the engrafted organ, emphasizing the importance of life-long efforts to optimize insulin sensitivity in these patients.
Key Words: Nonalcoholic fatty liver disease; nonalcoholic steatohepatitis; cirrhosis; hepatocellular carcinoma; metabolic syndrome;
adipokines; inflammation; type 2 diabetes.
ETIOLOGY OF LIVER DISEASE IN TYPE 2 DIABETES
Type 2 diabetes mellitus is associated with nonalcoholic fatty liver disease (NAFLD). NAFLD is a spectrum
of hepatic pathology that ranges from simple steatosis (Fig. 1a and Color Plate 5, following p. 34), on the most
clinically benign end of the spectrum, to cirrhosis (Fig. 1c) on the opposite extreme where most liver-related
morbidity and mortality occur. Nonalcoholic steatohepatitis (NASH) is an intermediate lesion characterized by
noticeably increased rates of hepatocyte death, with accompanying inflammatory cell infiltration and variable
degrees of fibrosis (Fig. 1b). Hepatocyte injury and inflammatory cell infiltration generally are worse in the
perivenous, than in the periportal, areas of the liver (1). The pattern of fibrosis is typically pericellular and
sinusoidal (dubbed “chicken wire fibrosis”), with fibrous septa bridging portal and perivenous areas as cirrhosis
From: Contemporary Endocrinology: Type 2 Diabetes Mellitus: An Evidence-Based Approach to Practical Management
Edited by: M. N. Feinglos and M. A. Bethel © Humana Press, Totowa, NJ
351
352 Diehl and Choi
Fig. 1. Photomicrographs of macrovesicular steatosis (A), steatohepatitis with lymphocytic infiltrates (B), and macronodular
cirrhosis (Fig. 1C) that demonstrate the range of NAFLD. (A and B courtesy of Dr. M. Gottfried, Department of Pathology, Duke
University Medical Center) (see Color Plate 5, following p. 34).
evolves. Fibrosis is more common in NASH than in the more benign simple hepatic steatosis, the earliest stage
of NAFLD, suggesting that NASH is a more advanced form of liver damage than NAFL.
PREVALENCE OF NAFLD
Abdominal imaging studies, such as proton nuclear magnetic resonance (NMR) spectroscopy, permit accurate
quantification of liver fat content and this noninvasive approach has been used to derive “normal” liver fat content,
as well as to estimate the prevalence of hepatic steatosis in the general population. A recent proton-NMR study
of over 2,000 adults in one urban area in the United States suggests that values for liver triglyceride content are
≤5.5% in healthy, nonobese individuals (2). If values above this cut-off are considered to reflect abnormal hepatic
accumulation of fat, about a third of the general population has hepatic steatosis. The prevalence of steatosis
varies among different ethnic groups, being highest (45%) in Hispanic/Latino individuals, intermediate (33%) in
whites and lowest (24%) in African Americans.
Surveys of adult diabetic populations with abdominal ultrasonography, which is relatively insensitive for
detecting liver fat, show that at least half have hepatic steatosis, suggesting that fatty liver disease is much more
common in patients with type 2 diabetes than in the general adult population (3). This concept is supported
by analysis of data from other population-based studies, such as the National Health and Nutrition Evaluation
Survey (NHANES) III (4,5) and Dallas Heart Study (2). Both suggest that type 2 diabetes is highly correlated
with NAFLD.
Although advances in abdominal imaging technology have generated consensus that about one third of American
adults have fatty livers, the proportion of these individuals that have more advanced forms of liver disease (i.e.,
NASH or cirrhosis or HCC) remains obscure. This uncertainty reflects the fact that current noninvasive tests do
not reliably distinguish steatosis from steatohepatitis or stage the extent of liver fibrosis. Therefore, it has been
impossible to define the proportion of NAFLD patients in the general population who have NASH or cirrhosis. As
a result, most predictions about the overall burden of NASH and NAFLD-related cirrhosis have been extrapolated
from findings in patients who undergo evaluations for suspected liver disease. An unavoidable drawback of this
approach is that it might bias sampling in favor of more advanced liver damage. Mindful of this caveat, it is
instructive to review recent reports about the relative frequencies of NASH and cirrhosis in different groups with
NAFLD.
A recent review of health records from the predominantly Caucasian general population of Olmsted County,
Minnesota, identified 420 individuals with a diagnosis of NAFLD. The prevalence of cirrhosis in this group
was 5% and about 10% of the cirrhotic group developed hepatocellular carcinoma (HCC) (6). A retrospective
analysis of 247 Japanese patients with biopsy-proven NAFLD demonstrated a significantly higher prevalence of
advanced fibrosis. In that study, cirrhosis was demonstrated in 17% and about a quarter of those with cirrhosis
had co-incident HCC (7). Advanced liver fibrosis (stage F3) was documented in an additional 18% of the
Japanese patients, bringing the overall prevalence of stage F3-4 fibrosis to 35% in that population. Disparity
in the prevalence of cirrhosis in these studies suggests that genetic or environmental factors might modify the
prevalence of NAFLD-related cirrhosis. Of note, however, is the consistency of evidence that 10–20% of patients
with NAFLD-related cirrhosis develop liver cancer.
Chapter 21 / Liver in Type 2 Diabetes 353
Reports about liver histology obtained during bariatric surgery for morbid obesity also help us to determine
the prevalence of NASH and cirrhosis in NAFLD. Moreover, because adults selected for bariatric surgery are
relatively young and preoperative screening generally eliminates those with portal hypertension or significant liver
blood test abnormalities, such studies are likely to provide a conservative estimate of the relative frequencies of
NAFL, NASH, and NAFLD-related cirrhosis in a high-risk, morbidly obese population. A Chilean survey of 127
consecutive bariatric surgery patients demonstrated NAFL in 37%, NASH in 26%, and cirrhosis in 2% of their
patients (8). Recent analysis of liver histology from 689 US bariatric surgery patients demonstrated a similar preva-
lence of cirrhosis (i.e., 2%) (9). Another study of a smaller group of bariatric surgery patients (n = 39 patients)
reported a somewhat higher prevalence of NAFL (49%) and NASH (44%), but an identical prevalence of cirrhosis
(2%) (10). Finally, when liver biopsies were performed in 212 consecutive bariatric surgery patients who had no
cause for liver disease other than NAFLD, 93% were found to have NAFLD. Most of these had simple steatosis
(i.e., NAFL), but 26% had NASH, and 9% had bridging fibrosis or cirrhosis (11). Thus, in morbidly obese,
relatively young adults with NAFLD who have been screened to eliminate those with clinical or laboratory evidence
of advanced liver disease, the overall prevalence of NASH ranges from 26–44% and that of cirrhosis is about 2%.
As expected, the prevalence of advanced fibrosis in patients undergoing elective bariatric surgery is considerably
lower than the 13.8% prevalence of severe fibrosis that was reported in an autopsy series of morbidly obese,
nonalcoholic individuals (12). However, the ∼14% prevalence for advanced fibrosis in the autopsy series is fairly
similar to the 17% prevalence of cirrhosis that was noted in much leaner Japanese NAFLD patients (see previous
discussion). Both of these values resemble the 21% prevalence of advanced fibrosis that was noted in a recent
biopsy series of 132 US patients with NAFLD (13).
Hence, conservative interpretation of the aggregate data from population-based samples, bariatric surgery
patients, and individuals who are referred for liver biopsy suggests that at least 2%, and as many as 17%, of
NAFLD patients are cirrhotic. Others have bridging fibrosis, making the overall prevalence of advanced hepatic
fibrosis in NAFLD higher than these estimates. For comparison, note that the prevalence of cirrhosis in NAFLD is
within ranges that have been reported for nonhospitalized individuals undergoing evaluation for chronic hepatitis
C (0.5–24) (14,15). The prevalence of HCC in individuals with NAFLD is unknown. However, current evidence
suggests that when HCC develops in NAFLD, it is virtually always in the context of cirrhosis. Recent, published
series report HCC in as many as 10–20% of patients with NAFLD-related cirrhosis (6,7).
Using the most conservative extremes of the aforementioned prevalence estimates to derive numbers of US
adults afflicted with various stages of NAFLD generates the following approximations: 45 million US adults
have NAFLD (30% of 150 million adults in the US), 11 million have NASH (25% of 45 million individuals
with NAFLD), 900,000 have NAFLD-related cirrhosis (2% of 45 million with NAFLD), and 90,000 have HCC
(10% of the 900,000 with NAFLD-related cirrhosis). For comparison, 3 million US adults have chronic hepatitis
C (2% of 150 million US adults) and as many as 750,000 have hepatitis C virus (HCV)-induced cirrhosis (25%
of 3 million with chronic HCV) (14).
Liver biopsy series of individuals with type 2 diabetes and ultrasonographic findings of hepatic steatosis
demonstrate that liver damage has progressed to NASH in most. In a recent study of patients from a diabetes
clinic, 87% of those with fatty liver on ultrasound had NASH demonstrated by liver biopsy (3). Similar results
were noted in recent study in bariatric surgery patients. Also, in that group of morbidly obese subjects, having
overt type 2 diabetes mellitus increased the risk for cirrhosis by 75-fold (16). Hence, individuals with type 2
diabetes appear to differ dramatically from nondiabetics with NAFLD. Most type 2 diabetic patients with NAFLD
have NASH with fairly extensive fibrosis, whereas most of the nondiabetics with NAFLD have simple steatosis
(17). Advanced fibrosis is an antecedent for cirrhosis in various types of chronic liver disease. Cirrhosis, in turn,
generally increases the risk for HCC. The increased prevalence of NAFLD-related cirrhosis in type 2 diabetic
populations may explain why type 2 diabetes is a risk factor for HCC (18).
PATHOGENESIS OF DIABETES-RELATED LIVER DISEASE
Over the last decade, considerable progress has been made in delineating the mechanisms that cause steatosis
and steatohepatitis (19). It remains less evident why only a minority of individuals with these “early” stages of
fatty liver disease progress to cirrhosis or develop liver cancer.
354 Diehl and Choi
Briefly, in the early stages of fatty liver disease, fat accumulates within hepatocytes when mechanisms that
promote lipid removal (by oxidation or export) cannot keep pace with mechanisms that promote lipid import or
biosynthesis. Although alcohol consumption has long been known to promote lipid biosynthesis while inhibiting
lipid export, it has been appreciated only recently that the molecular mechanisms involved are very similar to
those that promote steatosis in nonalcoholic fatty liver disease.
Three of the best-characterized factors that modulate the evolution of fatty liver disease are fatty acids,
tumor necrosis factor (TNF), and adiponectin (20–22). Fatty acids routinely traffic between the liver and
adipose tissues. Fat and liver are also important sources of TNF and adiponectin (23). Interestingly, the latter 2
proteins regulate fatty acid turnover within hepatocytes. Adiponectin generally reduces lipid accumulation within
hepatocytes by inhibiting fatty acid import and increasing fatty acid oxidation and export. It is also a potent
insulin-sensitizing agent (24). TNF antagonizes the actions of adiponectin, and thereby promotes hepatocyte
steatosis and insulin resistance.
Situations that increase TNF relative to adiponectin promote hepatic steatosis and insulin resistance (20).
TNF also increases mitochondrial generation of reactive oxygen species (ROS), promotes hepatocyte apoptosis,
and recruits inflammatory cells to the liver. Hence, protracted exposure to TNF generates oxidative and apoptotic
stress that sometimes overwhelms antioxidant and antiapoptotic defenses, leading to steatohepatitis (25). Studies in
mouse models of NASH, as well as mice with ethanol-induced steatohepatitis, prove that overproduction of TNF
relative to adiponectin causes steatohepatitis, because treatments that inhibit TNF or that increase adiponectin
improve steatohepatitis in all of these models (19). In addition, studies in humans with NASH demonstrate that
the relative risk of developing steatohepatitis correlates with increases in TNF or decreases in adiponectin
levels (26).
Given strong experimental and clinical evidence that unopposed TNF activity promotes steatosis and steato-
hepatitis, it is interesting that there is now compelling evidence that the simple accumulation of fatty acids within
hepatocytes is sufficient to trigger these cells to produce TNF (27). Fatty acids induce signaling in hepatocytes
that activates kinases, such as Inhibitor Kappa Kinase (IKK) beta that, in turn, activate the Nuclear Factor-B
(NF-B) transcription factor, driving hepatocyte synthesis of TNF and IL-6 (27,28). Recent studies in transgenic
mice with hepatocyte-specific overexpression of IKK-beta demonstrate that hepatocyte-derived IL-6 is responsible
for systemic insulin-resistance (28). Therefore, like adipose tissue, fatty livers (and specifically, fatty hepatocytes)
also make soluble factors that circulate to distant tissues and contribute to systemic insulin resistance (i.e., the
metabolic syndrome).
Nonobese individuals can clearly develop alcohol-induced steatohepatitis (29), and may also develop NASH
(30). The mechanisms for liver damage in nonobese and obese individuals may be similar, and involve excessive
hepatocyte exposure to fatty acids, fatty acid-inducible inflammatory mediators (i.e., TNF), and reactive oxygen
species (ROS). In support of this concept, an important role for the intestinal microflora in regulating intestinal
uptake of diet-derived lipids, as well as hepatic fatty acid synthesis, has been identified recently (31). Thus, it
is conceivable that the gut bacteria of some nonobese individuals might promote excessive hepatic accumulation
of fatty acids, as well as exposure to other bacterial factors (e.g., lipopolysaccharide) that trigger hepatic TNF
and ROS production. As in obese individuals, increased TNF would antagonize adiponectin activity, and promote
steatosis, steatohepatitis, and insulin resistance.
It is generally believed that progression from fatty liver disease to cirrhosis is predominantly dictated by the
severity of oxidant stress and consequent necroinflammation that occurs in individuals with steatohepatitis (32,33).
However, findings in animal models of steatohepatitis cast some doubt on this assumption because mice that
develop severe steatohepatitis do not uniformly progress to cirrhosis (34). In fact, progression to cirrhosis is also
poorly predicted by the gravity of the injurious insult in human fatty liver disease. For example, although there is
no doubt that alcohol is hepatotoxic, most lifelong heavy drinkers do not become cirrhotic (35). Similarly, although
obesity clearly increases exposure to fat-derived inflammatory mediators, some morbidly obese individuals have
normal livers at the time of gastric bypass surgery (36).
These apparent paradoxes might be explained by the fact that liver damage is determined by the adequacy of liver
repair mechanisms, as well as the severity of a particular noxious insult. Individuals who are “poor repairers” suffer
more net liver damage for any given level of injury than those who are “average repairers,” whereas those who
are “super repairers” may survive relatively unscathed, with little evidence of liver damage despite a significant
Chapter 21 / Liver in Type 2 Diabetes 355
noxious exposure. Viewed from this perspective, individuals who merely develop steatosis despite constant
bombardment with inflammatory factors might be “super-repairers,” whereas those who develop steatohepatitis
have only “average” repair capabilities, and the minority with “poor repair” abilities develop cirrhosis.
Indeed, the possibility that differences in repair responses might contribute to liver disease outcome merits
consideration in fatty liver disease because this condition is often associated with obesity, and adipose tissue is an
important source of various mediators that modulate wound-healing responses (20–22). Indeed, hepatic stellate
cells (HSC) express receptors for several of the adipose-derived factors that modulate HSC activation, including
leptin, angiotensin, adiponectin, and norepinephrine (37). Studies in mice demonstrate that leptin, angiotensin
and norepinephrine promote HSC proliferation, upregulate HSC expression of profibrogenic cytokines, such as
transforming growth factor- (TGF-), and induce collagen gene expression (37,38). Conversely, adiponectin
appears to inhibit HSC activation and decrease liver fibrosis (39). It is likely that plasminogen activator inhibitor-1
(PAI-1) also regulates HSC because it has been shown to influence fibrosis in other tissues (40).
Studies of patients with fatty liver disease support a role for adipose-derived factors in progression to cirrhosis.
For example, obesity is an independent risk factor for cirrhosis in alcoholic fatty liver disease (41). In addition,
increases in adrenergic tone and angiotensin receptor activity mediate hypertension in individuals with the
metabolic syndrome. Hypertension has been identified as an independent risk factor for advanced liver fibrosis
in nonalcoholic fatty liver disease (42). Consistent with the latter concept, a small open-label trial of angiotensin
receptor blockade in individuals with NASH and hypertension suggested that this treatment decreased liver fibrosis
and slowed disease progression (43).
In summary, studies of animal models and patients with fatty liver disease suggest that the early-intermediate
stages of this condition (i.e., steatosis and steatohepatitis) are caused by excessive exposure to fatty acids and
inflammatory cytokines that induce hepatocyte steatosis, threaten hepatocyte viability, and promote hepatic and
systemic insulin resistance. Resultant increases in the rate of liver cell death trigger repair responses. The latter
are modulated by various factors that regulate the activation of hepatic stellate cells. In some individuals, the
net effect of this process is “unhealthy” repair, with resultant cirrhosis. More research is needed to clarify the
molecular basis for inter-individuals differences in repair responses that are triggered by chronic fatty liver injury.
Improved understanding of such pathobiology should enhance identification of individuals who are at greatest
risk for developing cirrhosis, as well as the development of effective treatments to abort disease progression.
DIAGNOSIS OF NAFLD
History
Like most patients with chronic liver disease, patients with NAFLD are typically asymptomatic or have
nonspecific symptoms, such as fatigue and malaise (44–46). Some complain of vague right upper quadrant
pain, prompting a search for gallbladder, stomach or pancreatic disease. However, workup for such pathology is
generally negative and cholecystectomy, sphincterotomy, or antireflux treatments seldom improve this symptom.
Suspicion of fatty liver disease is often engendered when liver enzyme elevations are noted incidentally, and
hepatic steatosis is demonstrated during imaging tests. It is important to emphasize that there are 2 major types
of fatty liver disease: alcoholic fatty liver disease (AFLD) and nonalcoholic fatty liver disease (NAFLD). Neither
abdominal imaging tests nor liver histology can distinguish AFLD from NAFLD. Blood tests are also ineffective
for this purpose. Hence, NAFLD can only be diagnosed after obtaining a careful history that excludes excessive
alcohol consumption. To date, there have been no systematic studies to determine if type 2 diabetes lowers the
threshold for alcohol-induced liver damage. “Safe” levels of alcohol ingestion are generally considered to be one
or fewer drinks per day in women and 2 or fewer drinks per day in men (one drink = 10 g ethanol) (47). Thus,
fatty liver is presumed to be owing to NAFLD in individuals who drink less than this, and who lack other reasons
for hepatic steatosis, such as certain heritable conditions or ingestion of steatosis-inducing drugs (Table 1).
Physical Examination
Physical examination of patients with NAFLD is generally most notable for overweight/obesity and mild-modest
hepatomegaly (44–46). Some patients exhibit overt features of insulin resistance, such as acanthosis nigricans or
multiple skin tags. Signs of parenchymal failure, such as jaundice or coagulopathy, and portal hypertension, such
356 Diehl and Choi
Table 1
Levels of evidence for therapeutic interventions for NAFLD
Therapeutic approach
Grade of
recommendation
Clarity of
risk/benefit
Measures to Reduce Adiposity
Diet and exercise 1B Clear
Intestinal fat absorption inhibitors 1C+ Clear
Bariatric surgery 1C Clear
Inhibitors of Inflammation and Oxidant Stress
Vitamin E 2B Unclear
Betaine 2B Unclear
S-adenosylmethionine 2C Unclear
Silymarin 2C Unclear
Pentoxifylline 2C Unclear
Probiotics 2C Unclear
Thiazolidinediones 2B Unclear
Insulin-sensitizing agents
Metformin 2B Unclear
as spider angiomata, palmar erythema, splenomegaly, ascites, lower extremity edema, and/or encephalopathy are
unusual, and signify that the liver disease has progressed to cirrhosis.
Blood Tests
Although elevated levels of serum aspartate and/or alanine aminotransferases (AST, ALT) and alkaline
phosphatase (AP) are typically used to identify individuals who may have liver disease, these tests can be entirely
normal in individuals with NAFLD (48). Moreover, liver enzyme values in NAFLD are seldom increased more
than 5-fold, and the magnitude of the abnormalities in these tests correlates poorly with the degree of tissue
damage found on liver biopsy (45,46). As in other liver diseases, serum albumin and bilirubin, prothrombin time
and platelet count are better indicators of hepatic reserve, with decreases in albumin and/or platelet count and
increases in bilirubin and/or prothrombin time heralding advanced liver damage. The latter is also suggested by
progressive decline in AST values, particularly when the ratio of ALT to AST values exceeds 2 (46). A high
ALT to AST ratio also raises concern that AFLD, rather than NAFLD, is causing the liver damage (49).
Much current research is focused on developing novel biomarkers that can distinguish early from advanced
liver damage in various liver diseases, including NAFLD. To date, no one test or panel of markers is sufficient
to accomplish this task because test values in individuals with different degrees of liver damage tend to overlap
(50). As a result, only a few of these putative fibrosis markers have become clinically available (51). Values
for such tests tend to be much lower in subjects who have little or no liver damage than in those with more
significant liver injury. Hence, very low or normal fibrosis marker results tend to have a reasonably good negative
predictive value and may be useful in identifying a subset of NAFLD patients who are unlikely to have advanced
fibrosis (52).
Unlike many other types of chronic liver disease, NAFLD cannot be identified by any one blood test. Thus, it
remains a diagnosis of exclusion that is suggested when blood tests for other causes of chronic liver disease, such
as viral hepatitis, iron overload, copper accumulation, -1 antitrypsin deficiency and autoimmune liver diseases,
are negative. However, emerging evidence demonstrates that NAFLD may coexist with other liver diseases, such
as hepatitis C or iron overload, and worsen their prognosis (46,53). In addition, it has become apparent that
antinuclear antibody and other autoantibodies are often increased in patients with NAFLD, confounding efforts
to distinguish NAFLD from autoimmune hepatitis without liver histology (54).
In individuals with elevated aminotransferases or steatosis on abdominal imaging studies (see below) and
negative tests for other liver diseases, evidence for other parameters of the metabolic syndrome provide additional
support for the diagnosis of NAFLD (55). Patients with type 2 diabetes already have a major component of the
Chapter 21 / Liver in Type 2 Diabetes 357
metabolic syndrome, namely insulin resistance, and findings of dyslipidemia (increased total cholesterol, low
high density lipoprotein values, hypertriglyceridemia), and/or hyperuricemia further strengthen the likelihood that
NAFLD is their underlying liver disease.
Imaging Studies
The accumulation of fat within hepatocytes is the hallmark of NAFLD. This can be demonstrated by various
abdominal imaging tests, including ultrasound, CT scan, or magnetic resonance imaging. Currently, the most
sensitive approach to detect fatty liver is proton-nuclear magnetic resonance (NMR) spectroscopy, a technique
that permits accurate quantification of hepatic fat content (2).
Although proton-NMR spectroscopy is the most sensitive, noninvasive technique for estimating liver fat content,
this approach is not widely used in practice because of its expense and relatively limited availability. Instead,
abdominal ultrasonography is the most popular approach for evaluating hepatic fat (46). Although the ease and
relatively low cost of abdominal ultrasound justify this practice, sonography is far less sensitive than proton-NMR
spectroscopy for detecting hepatic steatosis, and probably misses many cases. In addition, the echo pattern that
suggests hepatic steatosis is nonspecific, and misclassification of other types of liver damage as fatty liver can
occur. Mindful of these caveats, ultrasonography is reasonably useful for identifying hepatic steatosis. However,
all noninvasive imaging tests are relatively insensitive for estimating the severity of liver damage and fibrosis
because portal blood flow must be altered sufficiently to induce splenomegaly, varices and/or ascites before a
diagnosis of cirrhosis is even suggested by abdominal imaging studies.
Liver Biopsy
The lack of specific blood tests for NAFLD, and the limited capability of abdominal imaging tests to detect liver
damage and fibrosis, make liver biopsy the most reliable test for diagnosing and staging NAFLD (46). Although
invasive, liver biopsy is a relatively safe procedure that is generally done in an outpatient setting without sedation.
Biopsy-induced bleeding is the major cause of significant adverse events (56). Clinically significant bleeding
occurs in fewer than 1 in 1,000 procedures, provided patients are screened to eliminate individuals who are taking
medications that interfere with platelet or clotting factor function or who have prothrombin times above 15 s
and/or platelet counts below 75,000/mL. Patients with coagulopathy can undergo liver biopsy via a transvenous
or laprascopic approach, but still have a somewhat increased risk for bleeding from the biopsy site.
The main justification for liver biopsy is that the acquired tissue permits reliable estimation of the cause and
stage of liver damage (57). Indeed, liver histology is very useful in distinguishing fatty liver disease from other
causes of chronic hepatitis. On the other hand, as mentioned earlier, biopsy cannot differentiate AFLD from
NAFLD as the cause of steatosis or steatohepatitis. Also, when liver damage has progressed to cirrhosis, steatosis
and steatohepatitis sometimes disappear, making it difficult to prove that NALFD was the cause for cirrhosis. Such
cases are generally given a histologic diagnosis of cryptogenic cirrhosis. Retrospective reviews of cryptogenic
cirrhosis cases from several centers suggest that up to 70% occur in individuals who have risk factors for NAFLD
(particularly type 2 diabetes and/or obesity), some of whom had an earlier liver biopsy that demonstrated steatosis
or steatohepatitis (58–60). Thus, liver biopsy is generally an effective strategy for confirming the clinical suspicion
of NAFLD by excluding other causes of chronic hepatitis. The latter is most helpful in patients with type 2
diabetes who have serologic evidence for iron overload, autoimmune disease, or infection with hepatitis viruses.
Biopsy is also the current gold standard for staging the extent of liver damage and fibrosis in all types of chronic
liver disease, including NAFLD. Unfortunately, however, sampling error somewhat limits test performance in this
regard (61). Tissue cores that are smaller than 1.5 cm in length, particularly those that are obtained with small-
diameter biopsy needles, may provide false estimates of overall liver damage and fibrosis (62). Even seemingly
adequate samples are subject to sampling artifact, as demonstrated by a recent study that showed variations in
the damage grade and fibrosis stage when liver cores were obtained by inserting the biopsy needle at different
angles (63). Nevertheless, despite these limitations, biopsy is currently the most sensitive and specific means for
judging the severity of liver damage and fibrosis.
Recently, an NIH-supported consortium of hepatic pathologists, generated standards for grading and staging
NAFLD (64). These criteria have been dubbed the NASH Clinical Research Network (CRN) scoring system or
NAS. Biopsy samples are rated for steatosis, hepatocyte injury (demonstrated by ballooning, Mallory hyaline