Management of Organic Waste Part 8 pptx
Bạn đang xem bản rút gọn của tài liệu. Xem và tải ngay bản đầy đủ của tài liệu tại đây (507.14 KB, 15 trang )
6
Co-Digestion of Organic Waste and Sewage
Sludge by Dry Batch Anaerobic Treatment
Beatrix Rózsáné Szűcs
1
, Miklós Simon
1
and György Füleky
2
1
Eötvös József College
2
Szent István University
Hungary
1. Introduction
Organic waste and waste water sludges can be stabilized both in anaerobic and in aerobic
processes. The advantage of the anaerobic treatment of the waste is that biogas develops
during the degradation process. Instead of energy consumption which is a usual
characteristic of aerobic-processes it is accompanied with energy production, which can be
utilized as energy source (Kayhanian & Tchobanoglous, 1992; Cout et al., 1994).
The anaerobic processes can be further classified according to the dry mater content and the
feeding of the fermenting reactor. According to Tchobanoglous (1993) and his work team,
we can talk about semidry procedures in the range of 15-20% dry matter contents. If the dry
matter content is high, only batch reactors operated with the principle of filling and
emptying can be applied, in order to avoid difficulties due to the continuous feeding.
On waste water treatment plants of small and medium capacity, the waste water sludge
can not be economically stabilized by the conventional anaerobic treatment of low dry
matter content and continuous feeding. Thus, the sludge is usually stabilized by
composting in that cases. At waste water treatment plants of great capacity, the sludge is
stabilized by anaerobic treatment of liquid, continuous technology which is often
followed by composting, in order to achieve better material characteristics of the end
product.
The municipal waste management directives require that the organic content of the wastes
to be dumped should be reduced. The realization of the waste management goals requires
the stabilization of municipal organic wastes, where generally composting is applied. The
sewage sludge and the organic fraction of municipal solid waste, called vegetable, fruit and
garden (VFG) waste are different from each other regarding their materials and quality, yet
for their stabilization, combined treatment is more and more often applied. The quantity
and quality of the VFG varies with time and space, depending on the season, the structure
of the settlement and the standard of living.
The novel dry batch BIOCEL technology was introduced for the treatment of municipal
solid organic waste in the Netherlands. It has the advantage that it is simple to operate, and
Management of Organic Waste
98
its specific reactor volume projected to the treated material flow is low (Brummeler et al.,
1991; Brummeler, 2000; Simon, 2000). The investment costs of the dry batch BIOCEL
technology are lower by 40% than those of the continuous anaerobic systems (Brummeler et
al., 1992). Its advantage over composting by state-of-the-art technology comes from a
simpler technical solution and a more economical operation.
We assume that the dry batch anaerobic treatment could be used for combined anaerobic
treatment of VFG wastes and municipal sewage sludge. When treating the waste water
sludge and other municipal organic wastes together by anaerobic method, the possible too
high easily degradable organic content of the VFG might be a problem, because in lack of
sufficient seeding material, it can lead to acidification of the system. A number of
literature reports about the anaerobic treatment of different organic wastes separately
(Brummeler, 1993), but there are no results available regarding co-digestion by dry
anaerobic treatment.
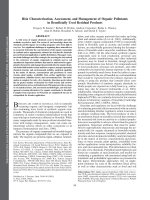
The effective anaerobic conversion of organic substances into methane depends on the
activity of miscellaneous microbial populations. A diagram of the consecutive metabolic
stages, which can be distinguished in anaerobic digestion, is shown in figure 1. In well
balanced digestion, all products of a previous metabolic stage are converted into the next
one. The overall result is a nearly complete conversion of the biodegradable organic material
in the waste into end products such as methane, carbon dioxide, hydrogen sulphide,
ammonia, etc. without significant build-up of intermediate products.
The products of the fermentation vary depending on quality of raw material and
environmental conditions applied. Low pH values decreases the relative amount of acetic
acid and increases the relative amount of propionic acid (Breure & van Andel, 1984). Partial
pressure of hydrogen in the gas phase can significantly influence the kind of products
formed by fermentative bacteria (Wolin & Miller, 1982). Hanaki et al. (1981) stated that β-
oxidation of long-chain fatty acids is thermodynamically unfavourable unless the hydrogen
partial pressure is maintained at a very low level. The dependence of a low hydrogen partial
pressure makes, that long chain fatty acids degradation can be inhibited indirectly by
inhibition of hydrogen consuming organisms (Koster, 1989).
The high substrate affinity of the hydrogen-consuming micro organisms makes it possible to
maintain low hydrogen concentrations. According to Robinson & Tiedje (1982), the
Michaelis-Menten half-saturation constant (K
m
) for hydrogen is in the range of 5.8-7.1 µM.
Zehnder et al. (1982) stated, that in a well balanced methane fermentation, the hydrogen
partial pressure does not exceed 10
-4
atm and in most cases approximately 10
-6
atm.
Macro and micro nutrients contents of the treated raw material effects the yield of micro
organisms. Lettinga et al. (1981) advised for macro nutrients a COD to nitrogen to
phosphorus ratio in a range of 350 : 5 : 1 – 1000 : 5 : 1.
The precondition of the efficient application of the anaerobic batch reactors is the
establishment of the balance between the acid production and the methane production, in
the absence of the reactor getting acidified (Benedek, 1990). During the anaerobic
degradation of the organic material, four consecutive metabolic steps can be distinguished:
hydrolysis, acidogenesis, acetogenesis, and methanogenesis (Batstone et al., 2002).
Co-Digestion of Organic Waste
and Sewage Sludge by Dry Batch Anaerobic Treatment
99
Fig. 1. Metabolic stages and products in anaerobic digestion of complex organic material
Among them, the usual rate-limiting factor of the whole procedure is the methagonesis
(Gosh & Klass, 1978). The rate of the acid production is great compared to that of the
methane production. At a balanced anaerobic degradation process, the elimination rate of
the biologically degradable organic dry material is almost equal to that of the methane
production (Gujer & Zehnder, 1983), because the biomass production is negligible.
The research and the thermodynamic calculations show that 70% of the methane is
generated during the decarboxylation of the acetic acid, and the remaining 30% comes from
the reduction of the carbon dioxide (Jeris & McCarthy, 1965; Kaspar & Wuhrmann, 1978).
CH
3
COOH → CH
4
+ CO
2
(∆G° = - 39,5 kJ)
CO
2
+4 H
2
→ CH
4
+ 2 H
2
O (∆G° = - 145 kJ)
So, the efficiency of the methane production is characterized not only by measuring the
methane content, but also by determining the hydrogen content. In case the hydrogen is
accumulated and is not converted to methane, then the accumulated hydrogen will
immediately inhibit the oxidation of the propionic acid and the accumulated acetic acid.
This will result in decrease in pH and, thus, in acidification of the reactors. This again will
Management of Organic Waste
100
affect the oxidation of the hydrogen, decreasing the reaction efficiency and increasing the
partial pressure of the hydrogen (Gujer & Zehnder, 1983).
To keep the degradation process balanced, seeding material is needed. A significant effect in
balancing the process can be achieved by properly setting the ratio of the methanogen
seeding material. However, the determination of the optimal amount of the seeding material
is a complex issue which is of great importance to the operation of batch reactors being
economical. Low seeding material ratio, in extreme cases, can lead to acidification of the
reactor or, in better cases, moderates the process rate. This can be compensated by extending
the retention time associated with increased reactor volume.
The increase of the biogas production and the decrease of the treatment time can be
achieved also by increasing the quantity of the seeding material since this way a more
effective degradation can be counted on. However, increasing the quantity of the seeding
material can result in the increase of the reactor volume, too.
The optimal waste to seeding material ratio in the case of municipal solid organic wastes is
1:2.3 in laboratory, while less than 1 : 1 in full scale conditions (Brummeler, 1993). According
to related literature data, the duration of the treatment in cases of municipal organic waste is
around 30-36 days (Brummeler et al., 1991, 1992); however in cases of a low seeding material
ratio, the duration of the treatment can be 50 days or more (Brummeler et al., 1992). There is
no published data about seeding material demand for the dry, batch anaerobic co-treatment
of the biowaste and waste water sludge.
We assume that the combined dry batch treatment of VFG waste generated on settlements
and of sewage sludge has many advantages. As a result of the co-digestion, because of the
different easily degradable organic contents of the sewage sludge and VFG, we can count on
the increase of the gas yield projected to reactor volume, compared to a separate treatment
of the VFG and sludge. We can assume as an advantage that a more balanced quality of the
sewage sludge can have a positive effect on the co-digestion with organic wastes having
quality varying with time and space. A further advantage can be, from the aspect as a
potential of anaerobic treatment of the sewage sludges generated on smaller settlements,
that the increased waste flow with VFG can make it economical. Nevertheless, it is necessary
to investigate the appropriate seeding material ratio, the determination of which does not
depend only on the achievable methane yield but on the required duration of the treatment
and on the targeted stabilization goal of organic material, too.
Our aim is to study the combined dry batch treatment of VFG and sewage sludge. Our goal
is to evaluate the aspects of determination of the optimal seeding material ratio, besides the
study of the avoidance of acidification of the reactors, the achievable greater degradation
rate of organic material and the maximal gas yield.
2. Materials and methods
In order to achieve our goals, we carried out laboratory experiments with dry batch reactors.
2.1 Materials
To ensure the repeatability of experiments, we modelled the biowaste (mixture of sewage
sludge and VFG) generated in the settlements with a material mixture of fixed ratio as
Co-Digestion of Organic Waste
and Sewage Sludge by Dry Batch Anaerobic Treatment
101
follows: 50% municipal excess sludge, 50% VFG consisting 25% fresh grass and 25% kitchen
waste. The excess sludge came from the activated sludge technology of a municipal waste
water plant, which can be characterized with a 20-day sludge retention time. The kitchen
waste consisted of 25% potato peel, 15% lettuce, 15% bread, 15% cucumber peel, 10%
cabbage, 10% paper and 10% coffee grounds.
The amount of total solids (furthermore as TS), volatile solids (furthermore as VS) and the
value of chemical oxygen demand (furthermore as COD) of the waste and the sludge are
presented in Table 1.
Materials
Total solids
(TS %)
Volatile solids
(VS %)
Chemical oxygen demand (COD )
(g O
2
.
kg TS
-1
)
methanogenic seed
(digested sludge)
24.54 56.86 667
excess sludge 28.87 48.22 556
fresh grass 31.30 92.20 985
potato peel 18.51 94.33 1 074
lettuce 7.69 85.67 1 193
bread 65.35 97.36 1 094
cucumber peel 4.82 84.44 1 486
cabbage 8.79 90.98 1 086
paper 92.49 98.98 1 288
coffee grounds 34.30 99.28 1 145
Table 1. Characteristics of waste and sludge used for the experiment
To characterize the seed, we defined its stability and methanogenic activity. The seed was
not stable, it could be degraded by a further 13%. The organic degradation occurred mostly
within the first 30 days. The digested sludge came from a completely stirred tank reactor
operated with 20 days hydraulic retention time. The methanogenic activity of the seed was
0.026 CH
4
-COD
.
g VS
-1
.
d
–1
, which shows the maximum methane production measured in
chemical oxygen demand (COD) of digested sludge for a unit of volatile solid in a unit of
time.
2.2 Methods
The TS content and the volatile solids (VS) content of the samples were determined by
drying and burning to constant weight at a temperature of 105°C and 650°C, respectively.
The chemical oxygen demand (COD) of the sludges was measured by the standard method
MSZ 21976-10:1982.
The amount of biogas generated, was measured by an „A1” type, Schlumberger wet gas
meter. The methane and hydrogen content of biogas was measured by a Shimadzu 2014 gas
chromatograph. The temperature of the column was 60°C, the temperature of the injector
was 170°C, and the temperature of the detector was 250°C. As carrier gas we used nitrogen
with 20 mL/min gas flow. In the 3.0-m long, 3.00-mm internal diameter glass column,
Supelco Molecular sieve filling was put. The detection was done with TCD detector. We
measured the quantity and the methane content of the biogas every day at the beginning,
and then, when the amount of the biogas decreased, every other and then every fifth day.
Management of Organic Waste
102
To determine the methanogenic activity of the seeding material we used neutralized acetic
acid as a substrate. To decrease the retardatory effects we added macro- and micro-nutrients
(Biotechnion, 1996), and incubated the samples on the temperature of 35°C. We used liquid-
phased mixed reactors to decrease the substrate-gradient. The amount of biogas generated,
was calculated on the basis of pressure changes in the head-part of the 1.5 dm
3
reactors. To
remove the generated CO
2
, NaOH pellets were placed in the heads-part of the reactors.
Specific methanogenic activity of the seed was calculated on the basis of cumulative
methane production graphs by taking the tangent of the deepest slope of the curve.
The acidity of the sludge was checked by a pH meter (340i WTW) pH/mV measuring
device, to which a SenTix 41 type electrode was connected.
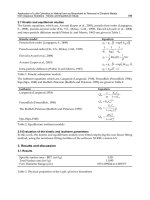
2.3 The experimental setup
We performed the examination of the effects of the seeding material on the dry batch
anaerobic treatment by a series of reactors of a total capacity of 6 dm
3
, which consisted of 4
reactors, each of a capacity of 1.5 dm
3
, connected in parallel. By these set ups, the disturbing
effects (opening of reactors) occurring during the pH measurements were reduced (Figure
2). The reactors were connected to gas-collecting bags.
Fig. 2. Set of dry batch anaerobic reactors
As experimental variable we checked five different seeding material ratios. We set the
organic waste to seeding material ratios projected to the quantity of dry organic material, to
these values: 1:0.5; 1:1; 1:1.5; 1:2, and 1:3. We measured the gas production of the seeding
material (digested sludge) in a control reactor, thus, the degradation rate of the biowaste
could be calculated separately. We compared the treatments when the sewage sludge is
treated alone and when is co-digested with VFG waste, with the 1:1 seeding material ratio
usually applied in the practice for the anaerobic treatment of municipal organic wastes. We
kept the reactors in a room of a constant temperature of 34°C.
Co-Digestion of Organic Waste
and Sewage Sludge by Dry Batch Anaerobic Treatment
103
Each reactor was filled with an equal amount and quality (TS=22%) of waste. In order to
prevent the disturbing effects caused by the oxygen, we flushed the heads of the reactors
with nitrogen gas after the sampling. The diluting effect of the head-space was considered at
the calculation of the results.
2.4 The quantification of anaerobic degradation
The COD of methane produced in the anaerobic degradation of organic substrate
corresponds with the COD of the removed organic mass (Lettinga & Hulshoff Pol, 1990).
The amount of organic matter removed during the anaerobic treatment, the degree of
degradation, was determined by measuring the total amount of methane produced during
the period (T), which was converted to COD, taking into account that 1 Ndm
3
methane is
equivalent to 2.86 g CH
4
-COD. Based on this, the degree of degradation of the organic
material was defined by the formula below:
D
T
% = (∑CH
4
COD
T
/ sludge COD) × 100 (1)
We fitted a logistic function-relation (D
T
% = D
max
/ (1 + e
-k(t-t0)
)) to the measuring results
with SPSS 14.0 software. We used sludge as seeding material and the substrate for the tests
after storing at 5°C, therefore we had to calculate with the lag phase in the beginning by
choosing the logistic function-relation. The logistic curves take into consideration the start-
up phase, pursuant to the Monod and the Briggs-Haldane model.
We determined the value of maximum degradation (D
max
) in case of biowaste and sludge
for the fitting as 65% and 50% respectively, which values were based on our former own
measuring results (Rózsané et al, 2011) and on technical literature data (Haug, 1980). We
determined the k invariant of reaction speed and the t
0
time defining the inflexion point in a
way that the function-relation would have the best fit (R
2
) of the measuring results.
In the case of methane production projected to the volume of reactor, we did not deduce the
methane production of the seeding material, but we used the results for the whole volume
of the mixture of waste and seeding sludge. In case of the measuring results used for the
volume of the reactor, we fitted the function-relation in a way identical with the previous,
where the maximal degree of methane production (CH
4max
) was determined with the
account of substrate to seeding material mixing rates and the maximal degradability. To
characterize the speed of the degradation process, in the case of both measuring results, we
determined the values of the starting v
10d
and v
30d
degradation speed as the direction
tangent to the fitted curves.
3. Results and evaluation
We assumed that the balance of the multi-stage anaerobic digestion process can be
influenced by setting the ratio of the seeding material which results in greater degradation
of the organic content of the treated waste, as well as in greater methane production.
We evaluated the experimental results based on two aspects:
- based on the degradation of the organic material achievable with different seeding
material ratios; and
Management of Organic Waste
104
- based on the gas production achievable during the treatment, referred to the unit of
reactor volume.
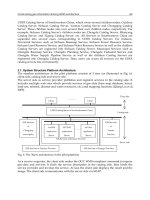
3.1 The results of the organic matter degradation
The actual methane production of different mixtures of organic wastes and seed, referred to
one unit of treated organic material, is shown in Figure 3. The methane production of the
seeding material present in the reactor was deducted from the methane production of the
mixture of the waste and seeding material. As a result, because of the relatively high
degradability of the seeding material, in the case of unbalanced reactors caused by low
seeding material ratios, we had even negative methane production in the first 20 days which
was indicated as zero value.
Fig. 3. Actual methane production referred to one unit of treated organic material
We reached the highest methane yield with the 1:3 biowaste to seed ratio. With the increase
of the seed ratio, the methane production grew, too. The methane yield was very low in the
case of 1:0.5 and 1:1 biowaste to seed ratios. Due to the low seed ratio, the waste became
acidified (pH 5.5-5.8), so thus the process of methane production was also inhibited. Since
our goal was to determine the optimal seeding ratio, we carried out the test in these reactors
only for 15 days. The maximal methane production of the seeding material (digested sludge)
occurred on day 10, however its extent was one eighth of that of the balanced reactors and
the methane production decreased to zero after the 30 days.
Having compared the treatability of the sewage sludge and of the biowaste, with the 1:1
seed ratio applied in practice, we can state that in the case of the sewage sludge, a more
balanced reactor performance can be observed. The results suggest that in the case of reactor
0
5
10
15
20
25
30
35
40
0 102030405060708090
Methane production (CH
4
-COD g
.
kg VS
-1 .
d
-1
)
Time (d)
seed 1:0.5 biowaste:seed 1:1 biowaste:seed 1:1.5 biowaste:seed
1:2 biowaste:seed 1:3 biowaste:seed 1:1 sludge:seed
Co-Digestion of Organic Waste
and Sewage Sludge by Dry Batch Anaerobic Treatment
105
containing VFG as well, the easily degradable organic material content was higher than in
the case of the reactor containing only sewage sludge. The fatty acid accumulated the in
reactor containing VFG which led to the acidification of the reactor, in the end. Against the
acidification of the biowaste, in the case of the sludge, the values of pH and hydrogen
concentration were better than the critical level even in the initial critical phase of the
treatment. This calls the attention to that, because of the varying quality of VFG waste, the
determination of the seeding material ratio has to be estimated case by case in each practical
application.
We can calculate the degradation of organic material of the waste from the quotient of the
methane production totalled in the time and of the chemical oxygen demand of the waste
mixture. Figure 4 shows the rate of degradation against time for different seeding rates and
substrates (the methane production of the seeding material is deducted). Onto the
measurement results we fitted the logistic function describing biological processes (Dt% =
D
max
/ (1 + e
-k(t-t0)
). The reaction kinetic parameters are shown in Table 2. The value of k
reaction rate constant rose with the increase of the seeding material ratio which resulted in
decrease of the value of t
0
. Significant differences cannot be detected in the values of k and t
0
of the 1:1.5 and 1:2 mixing ratios.
Fig. 4. The degradation rate of organic wastes against time
According to our measurement results, with a 60-days treatment with 1:3 biowaste to seed
ratio, 54% organic material degradation can be achieved. In the case of biowaste to seed
mixtures of 1:1.5 and 1:2 ratios, only 41-43% of the organic material became decomposed
during the same period of time. Thus, when increasing the amount of seeding material with
improving the initial conditions of the treatment, a considerable impact in the degradation
rate of organic material can be achieved for the whole treatment period.
0
10
20
30
40
50
60
0 102030405060
Rate of degradation (D%)
Time (d)
1:1.5 biowaste:seed 1:2 biowaste:seed 1:3 biowaste:seed 1:1 sludge:seed
Management of Organic Waste
106
The description of the sample
k
(1
.
d
-1
)
t
0
(d)
R
2
v
10d
(D%
.
d
-1
)
v
30d
(D%
.
d
-1
)
1:1.5 biowaste:seed 0.055 44.33 0.936 0.424 0.788
1:2 biowaste:seed 0.054 42.58 0.918 0.453 0.782
1:3 biowaste:seed 0.078 28.29 0.939 0.820 1.256
1:1 sludge:seed 0.060 31.38 0.876 0.526 0.749
Table 2. Kinetic parameters of the degradation process
Considering the rates of actual methane production, we can see that the actual rates
measured on day 10 significantly increase with the growth of the amount of seeding
material. At the values related to day 30, the effect of seed ratio onto the methane
production can be still well detected. The actual rate of the methane production further
increased from day 30 also in each cases, which suggests that we can count on a
considerable degree of degradation even after day 30. This is confirmed by the t
0
value, as
well.
To characterize the process of the anaerobic degradation, we checked the hydrogen content
of the biogas, as well as the temporal evolution of the pH of the reactors in the most critical
initial phase of the treatment (Table 3). The hydrogen content of the biogas was above the
value of the detection limit only in the first 9 days.
Type of the reactor
2nd da
y
3rd da
y
5th da
y
7th da
y
9th da
y
H
2
(%)
pH
H
2
(%)
pH
H
2
(%)
pH
H
2
(%)
pH
H
2
(%)
pH
1:0.5 biowaste:seed 9.66 5.47 0.38 5.51 1.08 5.55 0.08 5.65 0.06 5.70
1:1 biowaste:seed 4.27 5.70 0.19 5.80 0.13 5.75 0.02 5.78 0.02 5.83
1:1.5 biowaste:seed 3.58 5.90 0.14 5.84 0.10 6.13 0.02 6.06 0.01 6.34
1:2 biowaste:seed 1.40 6.27 0.04 6.32 0.02 6.34 0.01 6.43 0.01 6.59
1:3 biowaste:seed 0.37 6.10 0.05 6.23 <dl 6.45 0.01 6.65 0.01 6.72
1:1 slud
g
e:seed 0.62 6.68 <dl 6.94 <dl 7.09 <dl 7.28 <dl 7.37
Table 3. The hydrogen content of biogas and the pH of wastes in the case of different wastes
and seeding ratios
It is seen in the case of biowaste that, by the increase of seeding ratio, the hydrogen content
of the biogas decreases and the pH of the waste in reactors increased. During the test period,
the hydrogen content of the biogas also decreases and then, following day 9, it is under the
value of detection limit. The critical hydrogen concentration, above the 0.01 % as calculated
based on the literature (Zehnder et al., 1982), measured in the first 5 days had a negative
effect on the methane production in the case of each seeding ratio (Figure 3). By the increase
of the seeding, above the ratio of 1:1.5, the hydrogen concentration decreased below the
critical value from day 9 and the methane production started to increase. The unfavourable
values of hydrogen and pH measured in the case of 1:0.5 and 1:1 ratios led to the
acidification of the reactors. The pH of the reactors increased during the test which resulted
in the rise of biogas production. During the anaerobic treatment of the sewage sludge, we
did not measure significant hydrogen quantity in the biogas even in the case of 1:1 sludge to
seed mixing ratio. This can be explained by that there is less easily degradable organic
material in the sewage sludge than in the tested biowaste which is responsible for the
Co-Digestion of Organic Waste
and Sewage Sludge by Dry Batch Anaerobic Treatment
107
accumulation of hydrogen and volatile fatty acids. At sewage sludge digestion, often the
hydrolysis appears as the process limiting step (Koster, 1989) which could contribute to the
more favourable values measured in the case of sludge.
We compared our measurement results with the operation data of a full scale BIOCEL plant
(Brummeler, 1993) (Table 4.). The literature refers the biogas quantities to wet waste mass, to
standard condition. For comparability we recalculated the literature data to the CH
4
-COD g
.
kg VS
-1
unit used by us.
Time
(d)
Cumulative methane production
(CH
4
-COD g
.
kg VS
-1
)
Degradation of the organic material
(D%)
Full scale
BIOCEL
plant
1
Laboratory scale
Full scale
BIOCEL
plant
2
Laboratory scale
1:3 seed to
biowaste
2
1:1 seed to
sludge
1:3 seed to
biowaste
2
1:1 seed to
sludge
5 110.0 22.9 18.4 7.7 1.2 1.6
10 297.7 157.2 98.1 20.9 13.4 8.4
20 660.0 278.7 173.9 46.3 23.7 14.9
40 - 453.5 286.5 - 38.6 24.6
60 - 551.6 325.9 - 47.0 28.0
1
Value calculated according to Brummeler (1993), 450 m
3
reactor, waste TS 36%, VS 65%
2
Methane production together with the methane production of the seeding material
Table 4. Comparison of the laboratory results with the operation data of a full scale BIOCEL
plant treating VFG
The results of Table 4 show that the results of the methane production referring to VFG
waste reviewed in the literature, at the same moment, significantly exceed the results of the
co-digestion of the biowaste with sewage sludge. In our experiment, the difference resulting
from the lag phase as well as the lower degradability of the biowaste containing sludge and
VFG can be definitely pointed. In our experiment half of the waste mixture was sewage
sludge. The sewage sludge applied by us was less degradable than the biowaste, thus, the
degradability of one unit of waste mixture (and so the amount of methane production from
it, too) was lower.
The results of Table 4 show that higher gas yield referred to one unit of organic matter can
be reached in the case of co-digestion of VFG and sewage sludge than in the case of sewage
sludge digestion alone.
3.2 The results of methane production referred to reactor volume
We assume that the seed ratio, as a result of two opposing effects, influences the methane
production per reactor volume unit. The increase of the seed ratio makes the anaerobic
process balanced but at the same time decreases the amount of degradable organic matter
per reactor volume unit. That is a question, to what extent the already digested material
should be recycled for seeding. Another question is how the co-digestion of the easily
degradable VFG and sewage sludge affects the gas production of the reactors. To answer the
question, we checked the values of the totalled methane production referred to reactor
Management of Organic Waste
108
volume unit for the sewage sludge and biowaste (consisting of 50% sludge and 50% VFG) at
seed ratios shown in Figure 5.
Fig. 5. Summarized, specific methane production on the basis of reactor volume against time
Figure 5 shows that in the case of methane production referred to reactor volume, the
methane production of the sewage sludge above 30-day retention time is lower than that of
the combined treatments, so thus, we can achieve higher gas yield from one unit of reactor
volume when the sewage sludge and the biowastes are treated together than in case the
sewage sludge is applied alone. We achieved maximal methane production with co-
digestion at the 1:1.5 waste to seed ratio, this is followed by the 1:3 and 1:2 waste to seed
ratios, however, significant difference between the measurement results cannot be detected.
The increase of the seed ratio, in spite of the more inert material filling up the reactor
volume, did not considerably reduce the methane production projected to reactor volume
unit until day 30 of the treatment. A great increase of the amount of the seeding material,
however, results in increase of the reactor volume necessary to the actual treatment capacity
which, at the same time, is associated with the same rate of increase in gas production.
Taking into consideration also the goal of stabilization, based on the comparison of Figures 4
and 5, we can state that is may be worth to count on the reduction of the retention time
while increasing the seed ratio, for the purpose of optimization of the gas yield, degradation
and volume demand.
The reaction kinetic parameters of results referred to the reactor volume are shown in Table
5. It is apparent from the results of the table that the values of the maximal methane
production are nearly the same, no significant differences can be detected. The value of k
reaction rate constant is the highest in the case of 1:1.5 biowaste to seed ratio and its value
equals to the k value relating to the sewage sludge.
0
5
10
15
20
25
30
0 102030405060
Methane produced (CH
4
-COD g
.
dm
-3
)
Time (d)
1:1.5 biowaste:seed 1:2 biowaste:seed 1:3 biowaste:seed 1:1sludge:seed
Co-Digestion of Organic Waste
and Sewage Sludge by Dry Batch Anaerobic Treatment
109
Type of the reactor
CH
4
produced
(CH
4
-COD g
.
dm
-3
)
v
10d
(CH
4
-COD g
.
dm
-3
.
d
-1
)
v
30d
(CH
4
-COD g
.
dm
-3
.
d
-1
)
k
(1
.
d
-1
)
t
0
(d)
1:1.5 biowaste:seed 23.56 0.529 0.503 0.143 20.85
1:2 biowaste:seed 21.68 0.505 0.485 0.123 20.59
1:3 biowaste:seed 22.26 0.586 0.442 0.127 18.75
1:1 sludge:seed 19.97 0.578 0.305 0.144 17.49
Table 5. Kinetic parameters of summarized methane production appertaining to the volume
of the reactor
In the case of the values of actual methane production relating to day 10, we did not gain in
each case higher v
10
value when increasing the seeding ratio. The v
30
value relating to day 30
is in all cases less than the v
10
value which indicates the decrease of methane production. In
the case of v
30
values, we experienced that, when increasing the seeding, the value of actual
methane production referred to reactor volume unit and relating to day 30 decreased.
We assume that the treatment period (retention time) affects the gas production of the
reactor. The question is, taking into account the enhancement of gas production in the
reactor and at the same time the degradation rate indicating the efficiency of the treatment,
what retention time the reactors ought to be designed to. Figure 6 shows the average
methane production determined for the treatment period (specific methane production
referred to time and volume unit) depending on the duration of the treatment.
Figure 6 clearly shows the differences between the sewage sludge and the biowaste
containing VFG, too. At the biowaste, as a result of the higher proportion of the easily
degradable organic material due to the VFG, with the reduction of the retention time from
30 to 10 days, the gas yield grew in the case of 1:2 and 1:3 seeding ratios. At the 1:1.5 seeding
ratio, because of the initial unfavourable conditions (pH, hydrogen), this effect occurred
later between day 20 and 40. Because of the sludge being less degradable, the methane
production gradually increased until day 40.
Fig. 6. Average methane production in the case of different biowaste : seed ratios
0.00
0.05
0.10
0.15
0.20
0.25
0 102030405060
Reactor-specific CH
4
prod. (Ndm
3.
dm
-3 .
d
-1
)
Time (d)
1:1.5 biowaste:seed 1:2 biowaste:seed 1:3 biowaste:seed 1:1 sludge:seed
Management of Organic Waste
110
Figure 6 shows that in each case of waste to seed mixture, the average methane production
reaches its maximum after day 10 and then after day 30 it starts to decline. This means that
the retention time has to be minimum 30 days in the case of a combined dry batch treatment
of VFG waste and sewage sludge. In the case of higher seeding ratios, following 30-40 days,
the average methane production is almost the same in the case of each seeding, so thus, the
effect of the seeding prevails less. Figure 6 confirms, that optimizing the anaerobic
treatment, it is worth to check, together with the increase of the seed ratio, the option of
reducing the retention time. It can be stated that the application of the seeding in 1:3 ratio
has no negative impact on the gas production of the reactors even above a 40-day retention
time assuring high grade stabilization.
4. Conclusion
Based on the test results we stated that the sewage sludge can be well degraded also
through co-digestion by dry batch treatment together with VFG waste. We stated that in the
case of 1:0.5 and 1:1 biowaste to seed ratios, the reactors became acidified. Even in the case
of higher seeding ratios 9-day initial „lag” phase can occur. The hydrogen content of the
biogas and the pH in the reactors indicate an initial accumulation of fatty acids in the
reactor. We measured the highest, 54% organic material degradation in the case of 1:3
biowaste to seed ratio. Comparing our measurement results with literature data, it can be
stated that the total methane production projected to one unit of organic material and the
organic material degradation is nearly the same in total. Our laboratory-scale experiment,
however, was influenced by the relatively long „lag” phase. Based on our tests it can be
stated that it is a complex task to determine the optimal seeding ratio and retention time
where a universal value cannot be given. In practice, the optimal values have to be
determined one by one, taking into consideration the degradation target together with the
specific gas yield projected to the reactor. From the aspects of costs reduction regarding the
investment and operation, based on the values of the gas productions referred to the reactor
volume, the 1:1.5 biowaste to seed ratio seemed to be the most efficient. This lets the
conclusion be drawn that it is not worth to recycle the seeding material in the reactors in a
higher ratio than this. According to the above, the compromising waste to seed ratio taking
into consideration the different aspects is minimum 1:1.5 which takes into account the
higher degradation of the organic material, as well as the quantity of the methane
producible from one unit of reactor volume and the demand for low investment costs.
In the case of the same seed ratio, we experienced great difference in the efficacy of the
treatment in case of biowaste containing VFG and the sewage sludge. During a co-digestion
of sewage sludge and VFG wastes, because of the VFG waste having a quality varying in
space and time, it is advisable to determine the suitable seed ratio through degradation tests
in advance.
5. Acknowledgment
This research was funded by the Scientific Fund of the Eötvös József College.
6. References
Batstone, D. J., Keller, J., Angelidaki, R. I., Kalyuzhnyi, S. V., Pavlostathis, S. G., Rozzi, A.,
Sanders, W. T. M., Siegrist H., & Vavilin V. A. (2002). Anaerobic Digestion Model No.