Update in Intensive Care and Emergency Medicine - part 3 potx
Bạn đang xem bản rút gọn của tài liệu. Xem và tải ngay bản đầy đủ của tài liệu tại đây (356.64 KB, 42 trang )
and its clearance by the flow. In an extreme case in which aerobic metabolism is
zero, the metabolic production of CO
2
(VCO
2
) is also zero, and the venous content
equals the arterial content.
However, although ‘increased VCO
2
’ cannot occur in anaerobiosis, there is no
doubt that venous PCO
2
(or tissue PCO
2
from gastric tonometry) is increased
during energy failure. The meaning of this phenomenon becomes clear if we
consider the relationship between the CO
2
content (CvCO
2
) and the CO
2
tension
(PvCO
2
), also called the CO
2
dissociation curve. This is reasonably linear in the
PCO
2
range of 20 to 80 mmHg. However, its position is strongly influenced by the
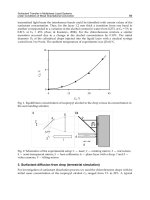
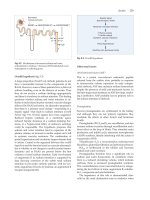
acid base status ofthe medium(Fig. 2).During thepassageinto the tissue, in normal
conditions the decrease in oxygen saturation is associated with binding of H
+
to
hemoglobin. This effect (Haldane) ‘buffers’ in part the acid-base changes induced
by the addition of VCO
2
from the tissue. The overall pictureis dramaticallychanged
when a strong ion, such as lactate, is added from the tissue to venous blood. In this
case, part of the [H
+
] increase due to the increase of the strong ion lactate, is
buffered by HCO
3
–
which ‘liberates’ dissolved CO
2
(PvCO
2
) according to the
following reaction:
Added H
+
+ HCO
3V
–
→ CO
2V
+ H
2
O
Indeed for a given venous CO
2
content, adding acid sharply increases the PvCO
2
.
The phenomenon is quite clear if we consider the CO
2
dissociation curve, at
different BE, as shown in Figure 2. For the same CO
2
content, the change in BE
Fig. 2. CO
2
dissociation curve. CO
2
content (ml % of whole blood) vs. CO
2
tension (PCO
2
). Each
curve is described at constant base excess (BE). As shown, for the same CO
2
content, changing
the base excess causes a great change in PCO
2
(see the broken line parallel to axes).
‘Adequate’ Hemodynamics: A Question of Time? 77
(i.e., the addition of strong ions such as lactate) results in a great change in PCO
2
.
Indeed, the large increase in venous PCO
2
during critical hypoxia (or during
mitochondrial dysfunction) is not the result of the increased anaerobic VCO
2
production but instead of the acidity change induced (for a given CO
2
content) by
the added strong ion. Due to the increased PvCO
2
, the expired CO
2
may tran-
siently increase, before the new steady state is reached. This transient increase in
expired CO
2
must not be confused with the VCO
2
metabolic production. Exhaled
CO
2
equals the metabolic CO
2
production only at steady state. The increase in
PvCO
2
is a very strong signal, and this is a reason why it has been proposed as a
‘useful marker’ of hypoxia [44, 45]. The distinction between content and tension
helps to explain some of the contradictory findings in the theoretical and experi-
mental literature [46].
Hemodynamic Adequacy in the Clinical Scenario
As discussed above, the energy failure due to hemodynamic failure, to mitochon-
drial dysfunction, or both, implies an adaptive response which consists of in-
creased glycolysis (increased lactate, decreased BE, acidosis, and increased
PvCO
2
) associated with a relative dumping of the energy expenditure (oxygen
conformance, i.e., VO
2
/DO
2
dependency). The distinction between hemodynamic
inadequacy and mitochondrial dysfunction, either due to direct insult (primitive
dysfunction) [47–50] or to mitochondrial structural disruption due to prolonged
hypoxia (secondary dysfunction), may be clinically relevant. In fact, aggressive
hemodynamic treatment is useless and potentially dangerous if the energy failure
derives from mitochondrial dysfunction and not from inadequate hemodynamic
status.
To roughly discriminate between the two causes of energy failure (beside the
baseline S
V
O
2
, low in hemodynamic failure), two challenge tests are available: the
volume load and the dobutamine tests. Thefirst does not imply, per se, an increased
oxygen consumption [51], and the second may contribute to an increased energy
expenditure due to the direct thermogenic effects of dobutamine [52–57]. If the
primary cause of the energy failure is tissue hypoxia due to inadequate hemody-
namics and the volume infusion or the dobutamine test are able to increase the
oxygen transport, the response should be an increased VO
2
(reduction of the
adaptive response of oxygen conformity), and a decrease in lactate and its corre-
lates (reduction of the adaptive response of increased anaerobic energy produc-
tion). Such responses indicate that the mitocondrial function is still adequate. If
the challenge test increases the oxygen transport but the VO
2
does not increase,
this suggests that the mitochondria are unable to work properly either because of
direct insult, as in sepsis, or because the hypoxia was so prolonged that the
mitochondria were structurally impaired.
78 L. Gattinoni, F. Valenza, and E. Carlesso
Volume Load Test
This was the subject of two studies conducted by Haupt [58] and Gilbert [59]. The
entry criteria (sepsis and circulatory failure), treatment (fluid load), and results
were similar. In both studies, some patients were experiencing energy failure (as
indicated by increased blood lactate levels). Of these, a subset responded to vol-
ume challenge with an increase in DO
2
and VO
2
, indicating, from an energy point
of view, oxygen supply dependency (oxygen conformance) and still adequate
mitochondrial function. On the contrary, other patients with energy failure (high
lactate) were unable to increase DO
2
while VO
2
did not significantly change or
even decreased. A volume load test alone does not allow the discrimination in
these patients between pump failure (cardiac failure) or a primary oxygen ma-
chinery defect (mitochondrial failure). To discriminate between these two possi-
ble mechanisms of hemodynamic inadequacy, a dobutamine test may be of use.
Dobutamine Test
In patients with energy failure (high lactate), a controlled infusion of dobutamine
may reveal cardiac pump failure either when patients are hemodynamically stable
[60] or not responsive to volume load [61]. An increased VO
2
, following an
increased DO
2
, suggests that the oxygen machinery (mitochondria) is still func-
tioning adequately.
More complex is the interpretation of the test in septic patients without energy
failure (normal lactate). Several studies have included these patients [60, 62–65].
Vallet [63] and Rhodes [65] prospectively tested the dobutamine response, strati-
fying between patients that were able (responders) or not able (non-responders)
toincreaseVO
2
by more than 15%of the baselinevalue. They found that responders
showed a much greater increase in DO
2
than non-responders, and had a lower
mortality. Since the patients were not in energy failure (normal lactate), it is
difficult to hypothesize a ‘masked oxygen debt’, which is just an adaptive response
(oxygen conformance) to the energy failure. It is possible that the responders had
just a physiological response to the increased metabolic requirements due to the
dobutamine. Indeed these patients had adequate hemodynamic response and
adequate mitochondrial function. The non-responders, on the contrary, were not
able to cope with the increased oxygen demand due to the dobutamine, suggesting
both an inadequacy of hemodynamics and/or an inadequacy of mitochondrial
function. In fact, considering the dobutamine test as an ‘increased energy demand
challenge’, the non-responders developed energy failure with its typical responses
(oxygen conformance and anaerobic metabolism) [63].
‘Adequate’ Hemodynamics: A Question of Time?
Based on the observation that survivors of high risk operations had significantly
higher mean cardiac index, DO
2
, and VO
2
than non-survivors [66], and on the
results of a prospective trial in which supranormal hemodynamic values used as a
‘Adequate’ Hemodynamics: A Question of Time? 79
therapeutic goal were associated with improved outcome [1], several studies have
been conducted on the so called ‘hemodynamic optimization’. After more than 20
years, the matter is still debated. Two recent meta-analyses provided different
conclusions [67, 68]. However, a few points must be stressed. First, most studies
were targeted to increased DO
2
. From what we have discussed so far, it is quite
evident that the crucial issue is not a given value of DO
2
but instead an oxygen
supply sufficient to match the energy needs. Only two studies [69, 70] investigated
a different target, i.e., a ‘normal’ SvO
2
, which more closely reflects the relationship
between oxygen demand and supply. These two studies led to different results.
Considering all the studies together, the difficulty in comparing them is quite
evident. The study populations were different (high risk surgical patients, trauma
patients, sepsis patients, etc.). The time of intervention was also not comparable
(perioperative, in the emergency room, and in the intensive care unit [ICU]).
Moreover, we do not know how many of the treated patients were at risk of energy
failure and how many of them were actually in energy failure.
It is beyond the scope of this chapter to attempt any detailed analysis of this
controversialmatter, however we wouldlike tofocuson thetiming of interventions.
As we discussed above, the adaptive responses to the energy failure (anaerobic
energy production and oxygen conformance) are not long-standing mechanisms.
It is likely that early interventions may reverse the energy failure more than
interventions performed later, when the mitochondria are structurally impaired.
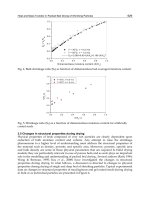
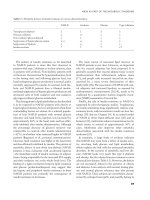
Figure 3 shows, on an ideal time axis, three prototypical randomized controlled
trials on hemodynamic treatment. In the study by Shoemaker et al., patients were
investigated perioperatively [1]; the study by Rivers et al. was conducted on septic
patients very early in the emergency room [69]; while that by Gattinoni et al. was
a late study conducted on a general ICU population [70]. The main results are
presented trying to focus the attention of the reader on time. As shown from the
above mentioned meta-analysis [68], the earlier the intervention and the greater
the physiological response to treatment, the better the outcome. If one could
imagine a cell under impending energy failure, it becomes obvious that the earlier
a clinician can correct a possible underlying hemodynamic failure, the greater the
likelihood of the cell not to suffer from hypoxia or any insult originating from
mediators.
Therefore, time is the essence.We believethat this isclearly shown bycomparing
our study of SvO
2
targeted treatment and the study by Rivers et al. The baseline
SvO
2
of Rivers’ patientsin the emergency room was 49% [69]; this strongly suggests
that their septic patients had an associated severe hemodynamic impairment. The
early correction of the VO
2
/DO
2
mismatch (SvO
2
target 70%) was associated with
a remarkable decrease in the blood lactate levels, suggesting that the treatment was
able to reverse, at least in part, the energy failure. In our study [70], the patients
were treated later in the ICU and their SvO
2
at entry was already close to the target
(68%, with the target of 70%). Indeed all our hemodynamic manipulations were in
the patients in whom most of the possible hemodynamic failure had already been
corrected. It is then possible that when we started to treat the patients the game was
already ‘over’. Of note, however, the tremendous importance of the hemodynamic
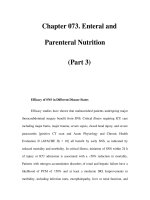
status in the course of the disease, as shown in Figure 4. The patients who were not
able to reach a normal SvO
2
had very high mortality rates.
80 L. Gattinoni, F. Valenza, and E. Carlesso
Fig. 3. Results of three prototypical studies on
hemodyamic treatment in critically ill patients, synopti-
cally presented under a ‘time’ frame. ER: emergency
room;ICU:intensivecareunit;CI:cardiacindex
(ml/min/m
2
); VO
2
: oxygen consumption (ml/min/m
2
);
DO
2
: oxygen delivery (ml/min/m
2
); SvO
2
:venousoxygen
saturation (%); CVP: central venous pressure (mmHg);
*significant difference between treatments
‘Adequate’ Hemodynamics: A Question of Time? 81
Conclusion
Energy failure is a life threatening condition. Energy failure induces two adaptive
responses: oxygen conformance (i.e., a decrease in energy expenditure due to
partial metabolic shut-down) and increased anaerobic energy production (i.e.,
increased lactate and acidosis). Energy failure may occur because of primitive
mitochondrial impairment or insufficient oxygen supply (inadequate hemody-
namics). This condition, if prolonged long enough, unavoidably leads to secon-
dary mitochondrial failure. In patients, the prevalent mechanism of energy failure
may be roughly assessed by considering the SvO
2
(low SvO
2
suggests tissue hy-
poxia with adequate mitochondrial function). A volume load test and dobutamine
challenge may also be of value in discriminating these two conditions. Early
treatment to correct hemodynamic failure, before secondary irreversible mito-
chondrial damage occurs, is likely associated with improved survival. Time is
essential.
References
1. Shoemaker WC, Appel PL, Kram HB, Waxman K, Lee TS (1988) Prospective trial of supra-
normal values of survivors as therapeutic goals in high-risk surgical patients. Chest
94:1176–1186
Fig. 4. Sub-analysis of the SvO
2
study [70]. Percent mortality as a function of the percent of time
that the patients maintained the target (SvO
2
>= 70%) during the 5-day study. 0% = never on
target, i.e., SvO
2
always below 70%, 100% = patients always on target (SvO
2
>= 70%). Note that
patients (n=84) who were able to maintain the SvO
2
target for 0–20% of the time had a mortality
close to 90%.
82 L. Gattinoni, F. Valenza, and E. Carlesso
2. Brunelle JK, Chandel NS (2002) Oxygen deprivation induced cell death: an update. Apoptosis
7:475–482
3. Rolfe DF, Brown GC (1997) Cellular energy utilization and molecular origin of standard
metabolic rate in mammals. Physiol Rev 77:731–758
4. Walford GA, Moussignac RL, Scribner AW, Loscalzo J, Leopold JA (2004) Hypoxia potentiates
nitric oxide-mediated apoptosis in endothelial cells via peroxynitrite-induced activation of
mitochondria-dependent and -independent pathways. J Biol Chem 279:4425–4432
5. Elfering SL, Haynes VL, Traaseth NJ, Ettl A, Giulivi C (2004) Aspects, mechanism, and
biological relevance of mitochondrial protein nitration sustained by mitochondrial nitric
oxide synthase. Am J Physiol Heart Circ Physiol 286:H22–H29
6. Boutilier RG (2001) Mechanisms of cell survival in hypoxia and hypothermia. J Exp Biol
204:3171–3181
7. Hochachka PW, Lutz PL (2001) Mechanism, origin, and evolution of anoxia tolerance in
animals. Comp Biochem Physiol B Biochem Mol Biol 130:435–459
8. Hand SC, Hardewig I (1996) Downregulation of cellular metabolism during environmental
stress: mechanisms and implications. Annu Rev Physiol 58:539–563
9. St-Pierre J, Brand MD, Boutilier RG (2000) The effect of metabolic depression on proton leak
rate in mitochondria from hibernating frogs. J Exp Biol 203 Pt 9:1469–1476
10. Boutilier RG, St-Pierre J (2002) Adaptiveplasticity of skeletal muscle energetics in hibernating
frogs: mitochondrial proton leak during metabolic depression. J Exp Biol 205:2287–2296
11. Buck LT, Hochachka PW (1993) Anoxic suppression of Na(+)-K(+)-ATPase and constant
membrane potential in hepatocytes: support for channel arrest. Am J Physiol
265:R1020–R1025
12. Cherniack NS (2004) Oxygen sensing: applications in humans. J Appl Physiol 96:352–358
13. Vallet B (2002) Endothelial cell dysfunction and abnormal tissue perfusion. Crit Care Med
30:S229–S234
14. Vallet B (1998) Vascular reactivity and tissue oxygenation. Intensive Care Med 24:3–11
15. Wenger RH (2000) Mammalian oxygen sensing, signalling and gene regulation. J Exp Biol
203 Pt 8:1253–1263
16. Semenza GL (2000) Expression of hypoxia-inducible factor 1: mechanisms and consequences.
Biochem Pharmacol 59:47–53
17. Seagroves TN, Ryan HE, Lu H, et al (2001) Transcription factor HIF-1 is a necessary mediator
of the pasteur effect in mammalian cells. Mol Cell Biol 21:3436–3444
18. Ratcliffe PJ, O’Rourke JF, Maxwell PH, Pugh CW (1998) Oxygen sensing, hypoxia-inducible
factor-1 and the regulation of mammalian gene expression. J Exp Biol 201 Pt 8:1153–1162
19. Schumacker PT, Chandel N, Agusti AG (1993) Oxygen conformance of cellular respiration in
hepatocytes. Am J Physiol 265:L395–L402
20. Braems G, Jensen A (1991) Hypoxia reduces oxygen consumption of fetal skeletal muscle cells
in monolayer culture. J Dev Physiol 16:209–215
21. Arthur PG, Giles JJ, Wakeford CM (2000) Protein synthesis during oxygen conformance and
severe hypoxia in the mouse muscle cell line C2C12. Biochim Biophys Acta 1475:83–89
22. Casey TM, Pakay JL, Guppy M, Arthur PG (2002) Hypoxia causes downregulation of protein
and RNA synthesis in noncontracting Mammalian cardiomyocytes. Circ Res 90:777–783
23. Gnaiger E (2003) Oxygen conformance of cellular respiration. A perspective of mitochondrial
physiology. Adv Exp Med Biol 543:39–55
24. Laffey JG, O’Croinin D, McLoughlin P, Kavanagh BP (2004) Permissive hypercapnia - role in
protective lung ventilatory strategies. Intensive Care Med 30:347–356
25. Gores GJ, Nieminen AL, Wray BE, Herman B, Lemasters JJ (1989) Intracellular pH during
“chemical hypoxia” in cultured rat hepatocytes. Protection by intracellular acidosis against
the onset of cell death. J Clin Invest 83:386–396
26. Koop A, Piper HM (1992) Protection of energy status of hypoxic cardiomyocytes by mild
acidosis. J Mol Cell Cardiol 24:55–65
‘Adequate’ Hemodynamics: A Question of Time? 83
27. Reipschlager A, Portner HO (1996) Metabolic depression during environmental stress: the
role of extracellular versus intracellular pH in Sipunculus nudus. J Exp Biol 199:1801–1807
28. Atsma DE, Bastiaanse EM, Van der Valk L, Van der Laarse A (1996) Low external pH limits
cell death of energy-depleted cardiomyocytes by attenuation of Ca2+ overload. Am J Physiol
270:H2149–H2156
29. Margaria R, Edwards HT, Dill DB (1933) The possible mechanisms of contracting and paying
the oxygen debt and the role of lactic acid in muscular contraction. Am J Physiol 106:689–713
30. di Prampero PE, Ferretti G (1999) The energetics of anaerobic muscle metabolism: a reap-
praisal of older and recent concepts. Respir Physiol 118:103–115
31. Siegel JH, Fabian M, Smith JA, et al (2003) Oxygen debt criteria quantify the effectiveness of
early partial resuscitation after hypovolemic hemorrhagic shock. J Trauma 54:862–880
32. Rixen D, Raum M, Holzgraefe B, Sauerland S, Nagelschmidt M, Neugebauer EA (2001) A pig
hemorrhagic shock model: oxygen debt and metabolic acidemia as indicators of severity.
Shock 16:239–244
33. Boekstegers P, Weidenhofer S, Pilz G, Werdan K (1991) Peripheral oxygen availability within
skeletal muscle in sepsis and septic shock: comparison to limited infection and cardiogenic
shock. Infection 19:317–323
34. Boekstegers P, Weidenhofer S, Kapsner T, Werdan K (1994) Skeletal muscle partial pressure
of oxygen in patients with sepsis. Crit Care Med 22:640–650
35. Boekstegers P, Weidenhofer S, Zell R, et al (1994) Changes in skeletal muscle pO2 after
administration of anti-TNF alpha-antibody in patients with severe sepsis: comparison to
interleukin-6 serum levels, APACHE II, and Elebute scores. Shock 1:246–253
36. Neviere R, Mathieu D, Chagnon JL, Lebleu N, Millien JP, Wattel F (1996) Skeletal muscle
microvascular blood flow and oxygen transport in patients with severe sepsis. Am J Respir
Crit Care Med 153:191–195
37. James JH, Luchette FA, McCarter FD, Fischer JE (1999) Lactate is an unreliable indicator of
tissue hypoxia in injury or sepsis. Lancet 354:505–508
38. Bundgaard H, Kjeldsen K, Suarez Krabbe K, et al (2002) Endotoxemia stimulates skeletal
muscle Na+-K+-ATPase and raises blood lactate under aerobic conditions in humans. Am J
Physiol Heart Circ Physiol 284:H1028–H1034
39. McCarter FD, Nierman SR, James JH, et al (2002) Role of skeletal muscle Na+-K+ ATPase
activity in increased lactate production in sub-acute sepsis. Life Sci 70:1875–1888
40. Chrusch C, Bautista E, Jacobs HK, et al (2002) Blood pH level modulates organ metabolism
of lactate in septic shock in dogs. J Crit Care 17:188–202
41. Levraut J, Ichai C, Petit I, Ciebiera JP, Perus O, Grimaud D (1902) Low exogenous lactate
clearance as an early predictor of mortality in normolactatemic critically ill septic patients.
Crit Care Med 31:705–710
42. Gutierrez G, Wulf ME (1996) Lactic acidosis in sepsis: a commentary. Intensive Care Med
22:6–16
43. Stewart PA (1983) Modern quantitative acid-base chemistry. Can J Physiol Pharmacol
61:1444–1461
44. Jin X, Weil MH, Sun S, Tang W, Bisera J, Mason EJ (1998) Decreases in organ blood flows
associated with increases in sublingual PCO2 during hemorrhagic shock. J Appl Physiol
85:2360–2364
45. Weil MH, Nakagawa Y, Tang W, et al (1999) Sublingual capnometry: a new noninvasive
measurement for diagnosis and quantitation of severity of circulatory shock. Crit Care Med
27:1225–1229
46. Gutierrez G (2004) A mathematical model of tissue-blood carbon dioxide exchange during
hypoxia. Am J Respir Crit Care Med 169:525–533
47. Crouser ED, Julian MW, Blaho DV, Pfeiffer DR (2002) Endotoxin-induced mitochondrial
damage correlates with impaired respiratory activity. Crit Care Med 30:276–284
48. Brealey D, Brand M, Hargreaves I, et al (2002) Association between mitochondrial dysfunc-
tion and severity and outcome of septic shock. Lancet 360:219–223
84 L. Gattinoni, F. Valenza, and E. Carlesso
49. Welty-Wolf KE, Simonson SG, Huang YC, Fracica PJ, Patterson JW, Piantadosi CA (1996)
Ultrastructural changes in skeletal muscle mitochondria in gram-negative sepsis. Shock
5:378–384
50. Simonson SG, Welty-Wolf K, Huang YT, et al (1994) Altered mitochondrial redox responses
in gram negative septic shock in primates. Circ Shock 43:34–43
51. Hansen PD, Coffey SC, Lewis FR Jr (1994) The effects of adrenergic agents on oxygen delivery
and oxygen consumption in normal dogs. J Trauma 37:283–291
52. Bhatt SB, Hutchinson RC, Tomlinson B, Oh TE, Mak M (1992) Effect of dobutamine on oxygen
supply and uptake in healthy volunteers. Br J Anaesth 69:298–303
53. Ensinger H, Weichel T, Lindner KH, Grunert A, Ahnefeld FW (1993) Effects of no-
repinephrine, epinephrine, and dopamine infusions on oxygen consumption in volunteers.
Crit Care Med 21:1502–1508
54. Uusaro A, Hartikainen J, Parviainen M, Takala J (1995) Metabolic stress modifies the
thermogenic effect of dobutamine in man. Crit Care Med 23:674–680
55. Karzai W, Lotte A, Gunnicker M, Vorgrimler-Karzai UM, Priebe HJ (1996) Dobutamine
increases oxygen consumption during constant flow cardiopulmonary bypass. Br J Anaesth
76:5–8
56. De Backer D, Berre J, Moraine JJ, Melot C, Vanfraechem J, Vincent JL (1996) Effects of
dobutamine on the relationship between oxygen consumption and delivery in healthy volun-
teers: comparison with sodium nitroprusside. Clin Sci (Lond) 90:105–111
57. Scheeren TW, Arndt JO (2000) Different response of oxygen consumption and cardiac output
to various endogenous and synthetic catecholamines in awake dogs. Crit Care Med
28:3861–3868
58. Haupt MT, Gilbert EM, Carlson RW (1985) Fluid loading increases oxygen consumption
inseptic patients with lactic acidosis. Am Rev Respir Dis 131:912–916
59. Gilbert EM, Haupt MT, Mandanas RY, Huaringa AJ, Carlson RW (1986) The effect of fluid
loading, blood transfusion, and catecholamine infusion on oxygen delivery and consumption
in patients with sepsis. Am Rev Respir Dis 134:873–878
60. Vincent JL, Roman A, De Backer D, Kahn RJ (1990) Oxygen uptake/supply dependency.
Effects of short-term dobutamine infusion. Am Rev Respir Dis 142:2–7
61. Qiu HB, Yang Y, Zhou SX, Liu SH, Zheng RQ (2001) Prognostic value of dobutamine stress
test in patients with septic shock. Acta Pharmacol Sin 22:71–75
62. De Backer D, Berre J, Zhang H, Kahn RJ, Vincent JL (1993) Relationship between oxygen
uptake and oxygen delivery in septic patients: effects of prostacyclin versus dobutamine. Crit
Care Med 21:1658–1664
63. Vallet B, Chopin C, Curtis SE, et al (1993) Prognostic value of the dobutamine test in patients
with sepsis syndrome and normal lactate values: a prospective, multicenter study. Crit Care
Med 21:1868–1875
64. De Backer D, Moraine JJ, Berre J, Kahn RJ, Vincent JL (1994) Effects of dobutamine on oxygen
consumption in septic patients. Direct versus indirect determinations. Am J Respir Crit Care
Med 150:95–100
65. Rhodes A, Lamb FJ, Malagon I, Newman PJ, Grounds RM, Bennett ED (1999) A prospective
study of the use of a dobutamine stress test to identify outcome in patients with sepsis, severe
sepsis, or septic shock. Crit Care Med 27:2361–2366
66. Bland RD, Shoemaker WC, Abraham E, Cobo JC (1985) Hemodynamic and oxygen transport
patterns in surviving and nonsurviving postoperative patients. Crit Care Med 13:85–90
67. Heyland DK, Cook DJ, King D, Kernerman P, Brun-Buisson C (1996) Maximizing oxygen
delivery in critically ill patients: a methodologic appraisal of the evidence. Crit Care Med
24:517–524
68. Kern JW, Shoemaker WC (2002) Meta-analysis of hemodynamic optimization in high-risk
patients. Crit Care Med 30:1686–1692
69. Rivers E, Nguyen B, Havstad S, et al (2001) Early goal-directed therapy in the treatment of
severe sepsis and septic shock. N Engl J Med 345:1368–1377
‘Adequate’ Hemodynamics: A Question of Time? 85
70. Gattinoni L, Brazzi L, Pelosi P, et al (1995) A trial of goal-oriented hemodynamic therapy in
critically ill patients. SvO2 Collaborative Group. N Engl J Med 333:1025–1032
86 L. Gattinoni, F. Valenza, and E. Carlesso
Limits and Applications
of Hemodynamic Monitoring
Arterial Pressure: A Personal View
D. Bennett
Introduction
Three thousand years ago, the Chinese, during the reign of The Yellow Emperor,
realized that there was an association between a pulse that was difficult to com-
press and the subsequent development of stroke. However, it was not until more
than 2500 years later that blood pressure was first quantified. In 1731, the Rever-
end Stephen Hales measured the blood pressure of a horse by inserting a brass
tube one sixth of an inch in diameter connected to a glass tube which was nine feet
in length into the crural artery. After releasing the ligature, which had previously
been tied around the artery, he found that the blood rose in the tube to a height of
eight feet above the level of the left ventricle.
Hales made a further series of measurements in animals and calculated that the
blood pressure in humans would be about seven feet. Some progress occurred over
the next 100 years in developing techniques for measuring blood pressure in
patients but it was not until 1876 that Von Basch made a simple sphygmomanome-
ter which allowed him to assess systolic pressure with a fair degree of accuracy and
for the first time made it possible to collect data on blood pressure from a large
number of patients. Twenty years later, Rocci developed the mercury sphygmoma-
nometer, which haschanged little in thelast 100 years.Probably the mostimportant
development in the measurement of blood pressure was the recognition by
Korotkoff that it was possible to define accurately both systolic and diastolic
pressure by listening with a stethoscope over the brachial artery below the inflated
cuff as the pressure was slowly lowered. It is worth noting that Korotkoff’s descrip-
tion was in 1904 so that thisyear isthe 100th anniversary ofthat event. The principle
involved in non-invasive blood pressure has changed little in the last 100 years
although several technological developments have occurred during this period.
These developments include the automated auscultatory method that uses a
microphone to detect the Korotkoff sounds but this method was sensitive to noise
artifact and was found to be inaccurate when measuring in patients with low blood
pressure. This technique measures the systolic and diastolic pressures from which
the mean pressure is calculated.
In contrast, the oscillatory method, which was devised to overcome the inaccu-
racies of the auscultatory method, measures the mean pressure from which the
systolic and diastolic pressures are calculated, calculations which are prone to
error. Other technologies introduced to overcome these problems include infra
sound to detect the very low frequency components of the Krotokoff sounds below
50 Hz, which are inaudible. Ultrasonic technology has been used combined with
other technologies to measure blood pressure but these techniques tend to be very
operator dependent.
More recently two other techniques have been developed in the hope of over-
coming some of the problems that clearly exist with all the existing methods.
Impedance plethysmography as its name implies monitors the change in electrical
impedance at the measurement site. This changes with local volumetric changes
associated with local pulsatile arterial distension occurring with each cardiac cycle.
Arterial tonometry applies a carefully measured compressing pressure to the
arterial site The applied pressure is measured by sensors and this allows an arterial
waveform to be constructed using an algorithm which is claimed to be very similar
to that directly recorded intra-arterially. A recent report using this technique,
however, has not shown a good correlation with directly measured pressure [1].
Non-invasive measurement of blood pressure is one of the most widely under-
taken procedures in clinical medicine and the data it provides are crucial in
monitoring patients with hypertension. However non-invasive techniques are only
used in a minority of intensive care unit (ICU) patients and this is for several
reasons [2–4].
Accuracy of measurement is of utmost importance in managing critically ill
patients particularly when they are cardiovascularly unstable when blood pressure
is low. It is vital to know that the mean arterial pressure is 65 mmHg and not 75
mmHg as this is likely to make a fundamental difference to the treatment given [5].
Clinical experience has demonstrated that in these circumstances, particularly if
the peripheral circulation is shut down, intra-arterial pressure measurement is
much more precise. In addition, it allows continuous monitoring of pressure which
none of the invasive techniques can offer. Even in less sick patients with stable
circulations, intra-arterial monitoring has the advantage of comfort. Frequently
repeated cuff inflations cause significant discomfort and adds tothe level of anxiety
in an already anxious patient. Finally the presence of an intra-arterial line allows
almost unlimited blood sampling mainly for blood gas analysis but also for routine
blood tests. Intra-arterial cannulation has therefore become a routine procedure
in the vast majority of ICU patients. It is not within the scope of this chapter to
discuss the various techniques of arterial cannulation or indeed of the technology
behind the measurement of intra- arterial pressure.
Blood pressure is of course determined by the relationship between flow and
peripheral resistance and therefore plays a fundamental role in determining per-
fusion to various organs, particularly the kidneys, heart, and brain. Thus, in
situations where global flow may be normal or high, for example in septic shock, a
low peripheral resistance must be associated with low mean pressure which inevi-
tably leads to reduced flow to the kidneys once pressure falls below the lower limit
of the auto-regulatory mechanism. This lower limit in the typical older patient
commonly seen in the ICU, may be relatively high and may be one of the reasons
that acute renal failure is a common finding in such patients. The adjustment of
the mean pressure to some `optimal’ level is vital in trying to minimize the risk of
developing acute renal failure although pressure aloneis not the only factor leading
to the development of renal dysfunction [6].
90 D. Bennett
What levelof mean pressure should be targeted is a controversial question about
which there is not a clear consensus. Most clinicians aim for a pressure that results
in urine production and is associated with the reduction in the metabolic acidosis
commonly seen in these circumstances. The majority of clinicians now feel that
manipulation of pressure in such patients should only be undertaken with knowl-
edge of cardiac output. This is to prevent vasoconstrictors being administered
where pressure is low due to hypovolemia and a low cardiac output. Similarly,
careful manipulation of blood pressure plays an essential role in the management
of patients with significantly impaired left ventricular function, for example, post
infarction or in patients with severe left ventricular failure.
The normal left ventricle is able to maintain a constant cardiac output over a
wide range of mean blood pressure. This is not true when left ventricular function
is significantly impaired so that as blood pressure rises cardiac output rapidly falls.
This is the reason that afterload reduction can be so effective in treating patients
with left ventricular failure. Furthermore, as peripheral resistance is a prime
determinant of myocardial oxygen consumption its reduction can play an impor-
tant role in the managementofmyocardial ischemia. The question thenarises again
as to what should the target blood pressure be in such patients with significantly
impaired left ventricular function with or without evidence of continuing myocar-
dial ischemia This emphasizes why it is so important that when manipulation of
blood pressure and cardiac output are to be undertaken, they should be performed
with continuous and accurate measurements of both pressure and flow.
Thus, if peripheral vasodilators are used it is very helpful to document that as
pressure is lowered, stroke volume and cardiacoutput increase appropriately.How
much pressure should be reduced is dependent on the clinical response of the
patient. Peripheral resistance is often very high in these patients because of the low
cardiac output and exaggerated sympathetic response resulting in intense periph-
eral vasoconstriction. As the vascular bed dilates, blood pressure falls, cardiac
output increases, and peripheral perfusion improves with improvement in urine
flow and correction of metabolic disturbance, usually lactic acidosis. Clearly the
pressure that is associated with optimal clinical response should be the target.
It should also be remembered that patients who present acutely with left ven-
tricular failure and high peripheral resistance are often inappropriately treated
with diuretics which leads to occult hypovolemia [7]. Peripheral vasodilators are
usually given and dilating both the venous and arterial beds the hypovolemia
becomes obvious with a sudden severe fall in cardiac output and mean arterial
pressure. Apart from the obvious effect on peripheral perfusion, the fall in diastolic
arterial pressure can have profound effects on myocardial perfusion exacerbating
any underlying ischemic potential. These rapid changes in the physiological status
of the patient further confirm the importance of adequate invasive monitoring in
such clinical situations.
Blood Pressure and Prognosis in Acute Hypovolemia and Sepsis
Blood pressure has been and is still used as a therapeutic target in the manage-
ment of acute hypovolemia in the emergency room, particularly in patients with
Arterial Pressure: A Personal View 91
trauma. Based mainly on anecdotal experience, a systolic pressure of 100 mmHg is
the usual target, together with a heart rate not in excess of 120 beats/minute. This
is mainly achieved by fluid resuscitation, initially with crystalloid and then blood
and colloid depending on the clinical situation.
However, this protocol is not without considerable controversy [8, 9], particu-
larly in the management of penetrating trauma such as gunshot and stab wounds.
It is argued that systolic pressure should be maintained between 70 and 80 mmHg
by restricting fluid resuscitation to a minimum. The protagonists of this protocol
argue that this minimizes the delay in getting the patient to the operating room and
more importantly reduces the risk of thrombus that may have formed at the site of
the vascular injury from being `blown off’ by inappropriate systolic pressure.
Although the concept of the `golden hour’ in which resuscitation should be
optimized is widely accepted, there is unfortunately little scientific evidence justi-
fying a systolic pressure of 100 mmHg as a means of achieving this goal. Indeed
studies [8] have demonstratedno correlation between pressureand simultaneously
measured oxygen delivery. This protocol is usually undertaken by emergency
room physicians.
In contrast, patients with septic shock are more likely to be managed within the
ICU where the blood pressure target is usually a mean pressure of 65 to 70 mmHg.
It is not at all clear why this difference has emerged although it may be related to
the fact that measurements of cardiac output are much more likely to be made in
the ICU environment.This almost certainly leads tobetter control of the circulation
particularly when markers of perfusion such as lactate, base deficit, and mixed
venous oxygen saturation are also monitored.
Although there are several studies demonstrating the prognostic values of base
deficit and lactate [10, 11], in trauma patients blood pressure is still considered the
most important physiological variable whilst flow is rarely measured in the emer-
gency room. This is perhaps understandable because of the practical difficulties in
making such measurements in the acute situation. It is of particular interest,
therefore, that Rivers et al. [12] used central venous saturation as a surrogate for
cardiac output in severely septic patients admitted to an emergency room and
showed that the group where central venous saturation was maintained at 75% had
a significantly lower mortality than the control group where saturation was main-
tained at around 68%. The mean blood pressure was significantly higher in the
treatment group at 6 hours as a result of more aggressive fluid resuscitation.
However, there was a subgroup of 63 patients (Rivers, unpublished data, per-
sonal communication) who had raised lactate levels and low central venous satu-
rations where the mean arterial blood pressure was greater than 100 mmHg. These
were younger and otherwise fitter patients with less comorbidity. The patients
assigned to the control group had a 60-day mortalityof almost 70%. In very marked
contrast, the patients in the treatment group had a 60-day mortality of only 24%.
This is an extraordinary difference in outcome even though it is a relatively small
number of patients. Indeed the mortality in these control patients was 13% higher
than that of the control group from the whole study. How can these differences be
explained?
The patients in this study were clearly severely hypovolemic as reflected by the
very low centralvenous saturations ofless than 50% on admissionto theemergency
92 D. Bennett
room. As these patients in the subgroup were younger than those in the main body
of the study, their cardiovascular reflexes were more likely to be intact resulting in
profound arteriolar constriction to maintain mean blood pressure above 100
mmHg. As the authors point out, it is well known that mean blood pressure is well
maintained as blood is lost by a proportional increase in systemic vascular resis-
tance until about 18% of the total blood volume has been lost, even though cardiac
output will have fallen significantly. It is only then, as peripheral resistance reaches
a plateau, that the continuing loss of blood volume is associated with a steep fall in
both cardiac output and mean arterial pressure.
These results are similar to the findings in normal subjects [13] where hypovo-
lemia has been produced by prolonged passive 50° head up tilt. This led to a 9%
rise in mean arterial pressure, a 37% fall in cardiac output, a rise in peripheral
resistance of 41%, and rise in heart rate of 48%. After 30 minutes, the subjects
became pre-syncopal and mean arterial pressure fell to 20% below baseline value
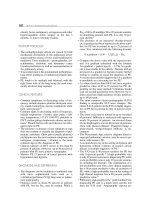
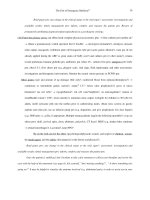
Fi.g. 1 Two different arterial pressure profiles during Valsalva maneuvers in 2 normal individuals,
both in supine position. A: “typical” response. B: “square” response usually associated with large
intrathoracic volumes. a, phase I; b, early phase II; c, late phase II; d, phase III; e, phase IV. [32]
Arterial Pressure: A Personal View 93
and heart rate exactly to base line. Simultaneously measured central venous satu-
ration fell linearly from 75 to 60% during this period. These findings suggest that
in the very acute situation with rapid changes in vascular volume, blood pressure
probably is not the optimal physiological variable to be monitored and indeed in
some circumstances relying on blood pressure alone may result in an increase in
mortality. Rivers (unpublished data, personal communication) has suggested that
in his study, the subgroup of patients with mean BP above 100 mmHg in the control
group received less aggressive volume resuscitation thus prolonging tissue hypop-
erfusion and hypoxia.
Studies in ICU patients, where the focus has been the maintenance of blood
pressure, have not been particularly fruitful. Most intensivists accept that pressure
needs to be kept at a level which allows adequate tissue perfusion particularly of
the kidneys and heart and that alpha agonists are the most widely used agents to
achieve this. More recently there has been increased interest in studying the role
of vasopressin [14–16] and its analogs in patients with hypotension due to sepsis.
The results of these studies are awaited. Renewed interest in the use of steroids in
similar patients has shown small but significant benefit particularly in those
patients who have an ablated adrenal response to synacthin [17]. A larger scale
study of this approach is being planned.
The hypothesis that the hypotension of sepsis is due to excess production of
nitric oxide (NO)resulting from activation ofinducible NOsynthase in the vascular
endothelium led to a large double blind randomized study of NO synthase inhibi-
tion using N(G)-monomethyl-L-arginine(L-NMMA) [18]. Unfortunatelythe treat-
ment group showed no benefit and indeed had a higher mortality than the patients
receiving placebo. This was despite the fact that preliminary animal and patient
data suggested significant improvement. The result of this study raises important
issues of design and appropriate patient recruitment. Were the dosageof L-NMMA
and the target blood pressure too high, and was enough attention paid to cardiac
output where it was measured?
It might be concluded from the tenor of this chapter thus far that the importance
of blood pressure monitoring and its use as a therapeutic target has been down-
played and this is true toa certain extent. As discussed earlier, routineintra-arterial
monitoring of blood pressure has become standard for a variety of reasons in the
ICU. Until fairly recently this had been done purely for reasons of convenience and
patient comfort. For a long time, however a minority of investigators have shown
that analysis of the arterial pulse wave contour obtained from an intra-arterial line
can provide a great deal of information over and above just the value for arterial
pressure [19–21]. This has led to the development of two commercially available
technologies for the continuous monitoring of cardiac output obtained by analyz-
ing the pulse wave contour obtained from intra-arterial catheters placed in either
the radial or femoral arteries.
Each of these technologies uses rather different protocols for measuring the area
under the pressure wave form but both calibrate the area using transpulmonary
thermodilution in the case of PiCCO, and lithium dye dilution in the caseof LiDCO.
These technologies have clearly added a new dimension to arterial pressure moni-
toring and provide beat-by-beat information on stroke volume and cardiac output
[22–25].
94 D. Bennett
Intriguingly, these technologies are being used to determine whether critically
ill ventilated patients will respond to volume loading based on a considerable
literature [26–28]. A greater than 10 or 12% variability of systolic pressure and/or
pulse pressure caused by the positive pressure associated with peak inspiration
indicates that the patient is probably hypovolemic and is likely to respond to fluid
resuscitation. This is an important technological development because occult
hypovolemia is probably not uncommon in critically ill patients and if unrecog-
nized is likely to contribute to an increase in both morbidity and mortality.
Thus, if systolic or pulse pressure variability increases and exceeds 10 to 12% it
implies developing hypovolemia and should allow much earlier recognition and
treatment with volumereplacement beingadministered more precisely tothe point
where variability is less than 10%. This approach can only be used in ventilated
patients although there are probably a significant number of non-ventilated ICU
patients who are relatively hypovolemic, which again is unrecognized.
As a future development, it would be interesting to study such patients using the
response of the intra-arterial pressure trace to the Valsalva maneuver as an indi-
cator of fluid status. There is, of course, an extensive literature [29–32] describing
various applications of the maneuver but thesquare wave response in patients with
left ventricular failure is probably the best known.
Figure 1a demonstrates the sinusoidal response of a group of normal subjects
with the early rise in blood pressure as intra-thoracic pressure rises, followed by
the tachycardia and subsequent sharp fall due to a reduction in stroke volume
related to the decline in myocardial transmural pressure and ventricular volumes.
Following release of breath holding, the over shoot in stroke volume is reflected by
the increase in systolic pressure and bradycardia.
In contrast, Figure 1b shows the response to the maneuver in the same subjects
who had been made hypervolemic by ingestion of a volume of 0.9% saline equiva-
lent to 2% of their lean body mass. The difference is very obvious with a typical
square response, classical of volume overload. Hypovolemia was then produced by
administering 30 mg of furosemide. The study also showed that the maximal fall
in systolic pressure was greatestin the hypovolemicsubjectsand least in the volume
loaded subjects [32].
Conclusion
Blood pressure is one of the most frequently measured variables in medicine and
is obviously of great importance in detecting patients with clinical hypertension
and monitoring their subsequent treatment. However, in critically ill unstable
patients its use may have been overemphasized. The reliance on systolic pressure
in trauma patients may well be cloaking important hypovolemia that can only be
detected by direct measurement of flow or surrogates such as central or mixed
venous saturation, base deficit, and lactate.
Similarly the reliance on mean pressure in septic patients may be misleading,
particularly when it is high and the optimal level at which to maintain pressure in
such patients is still unclear. Furthermore, there is still uncertainty about which
agent to use to achieve the desired pressure. The notion that so much reliance is
Arterial Pressure: A Personal View 95
placed on pressure is related to thefact that ithas for a verylongtime been relatively
easy to measure and it is only rather more recently that flow measurements have
become routine in most ICUs.
It isgratifying, therefore, that with the adventof pulse contour analysis, pressure
and flow data can be obtained from a single signal from which the state of volemia
can be estimated. It is not the intention of the author to discourage clinicians from
measuring blood pressure but to encourage better understanding of the relation-
ship between pressure and flow. The emergence of the new technologies may go a
long way to achieving this end.
References
1. Weiss BM, Spahn DR, Rahmig H, Rohling R, Pasch T (1996) Radial artery tonometry:
moderately accurate but unpredictable technique of continuous non-invasive arterial pres-
sure measurement. Br J Anaesth 76:405–111
2. Bur A, Hirschl MM, Herkner H, et al (2000) Accuracy of oscillometric blood pressure
measurement according to the relation between cuff size and upper-arm circumference in
critically ill patients. Crit Care Med 28:371–376
3. Bur A, Herkner H, Vlcek M, et al (2003) Factors influencing the accuracy of oscillometric
blood pressure measurement in critically ill patients. Crit Care Med 31:793–799
4. Hirschl MM, Binder M, Herkner H, et al (1996) Accuracy and reliability of noninvasive
continuous finger blood pressure measurement in critically ill patients. Crit Care Med
24:1684–1689
5. Dellinger RP, Carlet JM, Masur H, et al (2004) Surviving sepsis campaign guidelines for
management of severe sepsis and septic shock. Crit Care Med 32:858–873
6. Partrick DA, Bensard DD, Janik JS, Karrer FM (2002) Is hypotension a reliable indicator of
blood loss from traumatic injury in children? Am J Surg 184:555–559
7. Johnson A, Mackway-Jones K (2001) Towards evidence based emergency medicine: best BETs
from the Manchester Royal Infirmary. Frusemide or nitrates in acute left ventricular failure.
Emerg Med J 18:59–60
8. Dutton RP, Mackenzie CF, Scalea TM (2002) Hypotensive resuscitation during active hemor-
rhage: impact on in-hospital mortality. J Trauma 52:1141–1146
9. Stern SA (2001) Low-volume fluid resuscitation for presumed hemorrhagic shock: helpful or
harmful? Curr Opin Crit Care 7:422–430
10. Randolph LC, Takacs M, Davis KA (2002) Resuscitation in the pediatric trauma population:
admission base deficit remains an important prognostic indicator. J Trauma 53:838–842
11. Davis JW, Parks SN, Kaups KL, Gladen HE, O’Donnell-Nicol S (1996) Admission base deficit
predicts transfusion requirements and risk of complications. J Trauma 41:769–774
12. Rivers E, Nguyen B, Havstad S, et al (2001) Early goal-directed therapy in the treatment of
severe sepsis and septic shock. N Engl J Med 345:1368–1377
13. Madsen P, Iversen H, Secher NH (1993) Central venous oxygen saturation during hypovolae-
mic shock in humans. Scand J Clin Lab Invest 53:67–72
14. Sharshar T, Blanchard A, Paillard M, Raphael JC, Gajdos P, Annane D (2003) Circulating
vasopressin levels in septic shock. Crit Care Med 31:1752–1758
15. Russell JA(2003) Vasopressin in septic shock: clinical equipoise mandates a time for restraint.
Crit Care Med 31:2707–2709
16. Peters MJ, Booth RA, Petros AJ (2004) Terlipressin bolus induces systemic vasoconstriction
in septic shock. Pediatr Crit Care Med 5:112–115
96 D. Bennett
17. Annane D, Sebille V, Charpentier C, et al (2002) Effect of treatment with low doses of
hydrocortisone and fludrocortisone on mortality in patients with septic shock. JAMA
288:862–871
18. Grover R, Zaccardelli D, Colice G, Guntupalli K, Watson D, Vincent JL (1999) An open-label
dose escalation study of the nitric oxide synthase inhibitor, N(G)-methyl-L-arginine hydro-
chloride (546C88), in patients with septic shock. Glaxo Wellcome International Septic Shock
Study Group. Crit Care Med 27:913–922
19. Dos Santos P, Coste P, Bernadet P, Durrieu-Jais C, Besse P (1994) [Continuous monitoring
of cardiac output by analysis of the pulse contour] Arch Mal Coeur Vaiss 87:65–74
20. Zollner C, Haller M, Weis M, et al (2000) Beat-to-beat measurement of cardiac output by
intravascular pulse contour analysis: a prospective criterion standard study in patients after
cardiac surgery. J Cardiothorac Vasc Anesth 14:125–129
21. Della Rocca G, Costa MG, Coccia C, et al (2003) Cardiac output monitoring: aortic transpul-
monary thermodilution and pulse contour analysis agree with standard thermodilution
methods in patients undergoing lung transplantation. Can J Anaesth 50:707–711
22. Linton RA, Band DM, Haire KM (1993) A new method of measuring cardiac output in man
using lithium dilution. Br J Anaesth 71:262–266
23. Hamilton TT, Huber LM, Jessen ME (2002) PulseCO: a less-invasive method to monitor
cardiac output from arterial pressure after cardiac surgery. Ann Thorac Surg 74:S1408–1412
24. Della Rocca G, Costa MG, Pompei L, Coccia C, Pietropaoli P (2002) Continuous and intermit-
tent cardiac output measurement: pulmonary artery catheter versus aortic transpulmonary
technique. Br J Anaesth 88:350–356
25. Cottis R, Magee N, Higgins DJ (2003) Haemodynamic monitoringwith pulse-induced contour
cardiac output (PiCCO) in critical care. Intensive Crit Care Nurs 19:301–307
26. Pizov R, Cohen M, Weiss Y, Segal E, Cotev S, Perel A (1996) Positive end-expiratory pressure-
induced hemodynamic changes are reflected in thearterial pressure waveform. Crit Care Med
24:1381–1387
27. Preisman S, DiSegni E, Vered Z, Perel A (2002) Left ventricular preload and function during
graded haemorrhage and retranfusion in pigs: analysis of arterial pressure waveform and
correlation with echocardiography. Br J Anaesth 88:716–718
28. Perel A (2003) The value of functional hemodynamic parameters in hemodynamic monitor-
ing of ventilated patients. Anaesthesist 52:1003–1004
29. Wilkinson PL, Stowe DF, Tyberg JV, Parmley WW (1997) Pressure and flow changes during
Valsalva-like maneuvers in dogs following volume infusion. Am J Physiol 233:H93–H99
30. Zema MJ, Caccavano M, Kligfield P (1983) Detection of left ventricular dysfunction in
ambulatory subjects with the bedside Valsalva maneuver. Am J Med 75:241–248
31. Parisi AF, Harrington JJ, Askenazi J, Pratt RC, McIntyre KM (1976) Echocardiographic
evaluation of the Valsalva Maneuver in healthy subjects and patients with and without heart
failure. Circulation 54:921–927
32. Fritsch-Yelle JM, Convertino VA, Schlegel TT (1999) Acute manipulations of plasma volume
alter arterial pressure responses during Valsalva maneuvers. J Appl Physiol 86:1852–1857
Arterial Pressure: A Personal View 97
Central Venous Pressure: Uses and Limitations
T. Smith, R. M. Grounds, and A. Rhodes
Introduction
A key component of the management of the critically ill patient is the optimization
of cardiovascular function, including the provision of an adequate circulating
volume and the titration of cardiac preload to improve cardiac output. In spite of
the appearance of several newer monitoring technologies, central venous pressure
(CVP) monitoring remains in common use [1] as an index of circulatory filling
and of cardiac preload. In this chapter we will discuss the uses and limitations of
this monitor in the critically ill patient.
Defining Central Venous Pressure
What is the Central Venous Pressure?
Central venous pressure is the intravascular pressure in the great thoracic veins,
measured relative to atmospheric pressure. It is conventionally measured at the
junction of the superior vena cava and the right atrium and provides an estimate
of the right atrial pressure.
The Central Venous Pressure Waveform
The normal CVP exhibits a complex waveform as illustrated in Figure 1. The
waveform is described in terms of its components, three ascending ‘waves’ and
two descents. The a-wave corresponds to atrial contraction and the x descent to
atrial relaxation. The c wave, which punctuates the x descent, is caused by the
closure of the tricuspid valve at the start of ventricular systole and the bulging of
its leaflets back into the atrium. The v wave is due to continued venous return in
the presence of a closed tricuspid valve. The y descent occurs at the end of
ventricular systole when the tricuspid valve opens and blood once again flows
from the atrium into the ventricle. This normal CVP waveform may be modified
by a number of pathologies.
1. In atrial fibrillation, the a wave is lost and the c wave may become more
prominent; if there is coarse fibrillation of the atria, fibrillation waves may be
visible in the CVP waveform.
2. In the presence of A-V dissociation or junctional rhythm where atrial contrac-
tion may occur during ventricular systole, extremely tall canon a waves occur
due to atrial contraction against a closed tricuspid valve.
3. In tricuspid regurgitation, blood is ejected backwards during ventricular systole
from the right ventricle into the right atrium. This produces a large fused c-v
wave on the CVP trace.
4. In tricuspid stenosis, forward movement of blood from the right atrium into the
ventricle occurs against a greater than normal resistance leading to an accentu-
ated a-wave and an attenuated y-descent.
5. Similarly, if right ventricular compliance is decreased by either myocardial or
pericardial disease the a-wave will be accentuated.
6. With pericardial constriction, a short steep y-descent will also be seen which
allows differentiation from cardiac tamponade where the CVP will be mono-
phasic with a single x-descent.
Determinants of Central Venous Pressure
The CVP must clearly be influenced by the volume of blood in the central venous
compartment and the compliance of that compartment. Starling and co-workers
demonstrated the relationships between CVP and cardiac output and between the
venous return and the CVP [2, 3]. By plotting the two relationships on the same set
of axes it can be seen that the ‘ventricular function curve’ and the ‘venous return
curve’ intersect at only one point, demonstrating that if all other factors remain
constant, i.e., if nothing happens to alter the shape of either of the two curves, a
given CVP can, at equilibrium, be associated with only one possible cardiac output
and, similarly, a given cardiac output (or venous return) will, at equilibrium, be
Fig. 1. Central venous pressure waveform from a ventilated patient (bottom) with time synchro-
nized electrocardiograph trace (top). The a-wave represents atrial contraction and occurs imme-
diately after atrial depolarization as represented by the p wave on the EKG. The c-wave represents
bulging of the tricuspid valve in early ventricular systole and is followed by the v-wave, caused by
atrial filling during ventricular systole.
100 T. Smith, R. M. Grounds, and A. Rhodes
associated with a specific CVP. Both curves can of course be affected by a number
of factors: total blood volume, and the distribution of that blood volume between
the different vascular compartments (determined by vascular tone) will affect the
venous return curve. The inotropic state of the right ventricle will affect the shape
of the ventricular function curve. When any one of these factors is altered there
will be an imbalance between cardiac output and venous return, which will persist
for a short time until a new equilibrium is reached at a new central venous blood
volume and/or an altered central venous vascular tone.
As the superior vena cava, where the CVP is measured, is a thoracic structure
pressure changes in the thoracic cavity will affect the measured CVP. This has
important practical implications for the measurement of CVP as the intrathoracic
pressure changes cyclically with breathing. There are also important implications
for the accuracy of CVP measurements in patients with either extrinsically applied
or intrinsic positive end expiratory pressure (PEEP) as the intrathoracic pressure
will not return to atmospheric pressure at any time during the respiratory cycle.
Additionally, as discussed in the previous section, tricuspid valve disease, myo-
cardial and pericardial disease and cardiac rhythm abnormalities will all affect the
CVP waveform.
A summary list of factors affecting the CVP is given in Table 1.
Table 1. Factors affecting the measured CVP
Central venous blood volume • Venous return/cardiac output
• Total blood volume
• Regional vascular tone
Compliance of central compartment • Vascular tone
• Right ventricular compliance
– Myocardial disease
– Pericardial disease
– Tamponade
Tricuspid valve disease • Stenosis
• Regurgitation
Cardiac rhythm • Junctional rhythm
• AF
• A-V dissociation
Reference level of transducer • Positioning of patient
Intrathoracic pressure • Respiration
• Intermittent positive pressure ventilation (IPPV)
• Positive end-expiratory pressure (PEEP)
• Tension pneumothorax
Central Venous Pressure: Uses and Limitations 101
How is the CVP Monitored?
The CVP is commonly measured by means of a fluid filled cannula with its tip in
the superior vena cava connected to either a fluid filled manometer or, more
commonly in the critical care setting, to an electronic pressure transducer linked
to a monitor which will display a continuous pressure wave.
In order to accurately measure CVP, it is important to appropriately set the
reference level of the pressure measuring device, whether a fluid filled manometer
or electrical transducer, at the level of the right atrium. In the supine patient, this
point is best estimated by using the intersection of the fourth intercostal space with
the midaxillary line, however, this reference may not be as accurate in patients not
in the supine position [4].
If the CVP is to be used as an index of cardiac preload then, theoretically, the
most relevant pressure to measure from the CVP trace is the pressure at the onset
of the c wave. The c wave marks the closure of the tricuspid valve at the beginning
of ventricular systole and immediately before its onset the measured pressure
should be equivalent to the right ventricular end diastolic pressure (except in the
case of tricuspid stenosis where a pressure gradient will always exist between the
two chambers). Where no c wave is clearly visible, it is conventional to take the
average pressure during the a-wave. Where no a wave is visible (e.g., in atrial
fibrillation) the pressure at the Z-point (that point on the CVP wave which corre-
sponds with the end of the QRS complex on the electrocardiogram [EKG]) should
be used. It is worthy of note that many of the commercially available monitoring
systems do not measure the CVP in this way but simply generate a mean CVP
during the whole cardiac cycle and average this value over a number of cycles.
As can be seen from the above although CVP is used as an index of circulatory
filling and preload many factors can affect the CVP waveform and the measured
pressure (Table 1).
Potential Uses of the CVP
Utility of CVP to Predict Cardiac Preload
Theoretical objections
In 1895, Otto Frank demonstrated that the pressure generated in an isometrically
contracting ventricle was proportional to the end diastolic volume of the chamber
[5]. Starling and his co-workers expanded this work to show that the stroke
volume of the contracting heart was proportional to the end diastolic volume up
to a point where a plateau was reached and increasing volume would no longer
increase the stroke volume (Fig. 2). It is a common practice in critical care medi-
cine to maximize the cardiac output by using intravenous fluid administration to
increase the preload and, therefore, stroke volume. However, excessive infusion of
fluid carries its own problems and is therefore to be avoided; the aim therefore is
102 T. Smith, R. M. Grounds, and A. Rhodes
to ensure that the preload places the heart at the top of the ascending part of the
Starling curve, i.e., the minimum preload to attain maximal stroke volume.
Preload is the length of the cardiac muscle fibers at the end of diastole. The use
of CVP as an index of preload therefore relies on two assumptions: that CVP is
equivalent to the filling pressure of the heart and that myofibril length is propor-
tional to the cardiac filling pressure.
Unfortunately, the measured CVP often does not truly correspond to the pres-
sure distending the right atrium at the end of diastole. As discussed above the most
relevant pressure in this context is the pressure at the onset of the c wave and this
is not the pressure displayed by many monitoring systems. Also, the pressure that
dilates the ventricle is not the intravascular pressure but the transmural pressure,
i.e., the difference between the pressure within the ventricle (intravascular pres-
sure) and the intrathoracic pressure (extravascular pressure). Changes in in-
trathoracic pressure affect the intravascular pressure, for example the changes in
CVP seen duringthe respiratory cycle, and if changes in intrathoracic pressure were
completely transmitted across the vessel wall the transmural pressure would re-
main constant. However, it is not possible to determine for an individual patient
the extent to which these pressure changes are transmitted and so the transmural
pressure cannot be accurately determined. One solution would be to manually
measure the end-diastolic CVP at the end of expiration and in the absence of PEEP
(either intrinsic or extrinsic) when the intrathoracic pressure is equal to atmos-
pheric pressure and the transmural pressureis, therefore, equal to the intravascular
pressure. However, thisis not possiblewith all monitors or inall patients. We would
suggest that, to maximize the reliability of the measurement, where CVP is to be
used to as an index of cardiac preload the end expiratory end diastolic CVP should
be manually measured in the same manner that a pulmonary artery occlusion
pressure (PAOP) would be measured.
Fig. 2. Ventricular function and venous return curves
Central Venous Pressure: Uses and Limitations 103