Mass Transfer in Multiphase Systems and its Applications Part 3 potx
Bạn đang xem bản rút gọn của tài liệu. Xem và tải ngay bản đầy đủ của tài liệu tại đây (9.79 MB, 40 trang )
Surfactant Transfer in Multiphase Liquid Systems
under Conditions of Weak Gravitational Convection
69
transmitted light beam the interference bands could be identified with certain values of the
surfactant concentration. Thus, for the layer 1.2 mm thick a transition from one band to
another corresponded to a variation in the alcohol content in water from 0.27% at С
0
= 5% to
0.81% at С
0
= 45% (Zuev & Kostarev, 2006). For the chlorobenzene mixture a similar
transition occurred due to a change in the alcohol concentration by 0.10%. The initial
diameter D
0
of the cylindrical drops injected into the liquid layer with a medical syringe
varied from 3 to 9 mm. The ambient temperature of experiments was (23±1)°С.
C
d
, %
0
8
16
0153045
C
0
, %
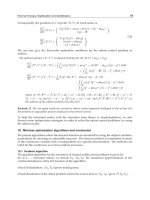
Fig. 1. Equilibrium concentration of isopropyl alcohol in the drop versus its concentration in
the surrounding solution
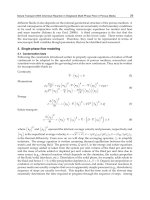
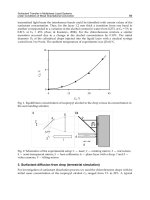
Fig. 2. Schematics of the experimental setup: 1 — laser; 2 — rotating mirror; 3 — micro-lens;
4 — semi-transparent mirror; 5 — lens-collimator; 6 — plane layer with a drop; 7 and 8 —
video cameras, 9 — tilting mirror
3. Surfactant diffusion from drop (terrestrial simulation)
For investigation of surfactant dissolution process we used the chlorobenzene drops with he
initial mass concentration of the isopropyl alcohol C
d
ranged from 1% to 20%. A typical
I
II
Mass Transfer in Multiphase Systems and its Applications
70
series of interferograms of the concentration field generated around a dissolving drop of the
mixture containing surfactant is shown in Fig. 3. It is seen that the process of surfactant
diffusion begins concurrently with the formation of the drop (Fig. 3,a) and even earlier and
has three-dimensional character despite a small thickness of the layer and its horizontal
position. The alcohol, escaping from the drop, did not have time to mix with water due to a
low diffusion and therefore it floated up forming a thin layer along the upper boundary of
the cell. A similar situation could be observed inside the drop — chlorobenzene, which had
already got rid of the alcohol, sank along the lateral walls of the drop and moved along the
bottom towards its center. As a result, vertical gradients of the surfactant concentration were
formed both in the drop and in the layer. Capillary convection occurred practically
immediately after formation of the drop. It developed in the form of three-dimensional
nonstationary cells symmetrically formed at both sides of the interface. In a short time the
size of the cells became comparable with the drop radius, which provided conditions for a
rapid decrease of the surfactant concentration due to a continuing transfer of the mixture
from the central region of the drop to the interface. Note that the capillary flow had a rather
weak effect on the gravitational flow responsible for the propagation of the concentration
front in a direction away from the drop boundary (such level of the interaction manifests
itself in a dramatic distinction between two types of the convective motion shown in
Fig. 3,b). At the same time, the boundary of the concentration front had still the traces of the
originating cell flow (Figs. 3,b–3,d).
A decrease of the surfactant content in the drop smoothed down the concentration
differences at the interface and the capillary flow decayed. After this the evolution of the
concentration field was governed solely by the buoyancy force, which essentially simplified
its structure (Fig. 3,c). As long as the amount of surfactant in the drop remained rather high,
regeneration of the vertical solutal stratification at the interface led again to the development
of the intensive capillary convection (Fig. 3,d). However, the arising cell motion continued
for no more than a few seconds and was followed by the gravitational flow with essentially
lower characteristic velocities. Depending on the initial surfactant concentration the number
of such "outbursts" of the capillary convection could vary in the range from one or two at
С
d
= 5% to eight at С
d
= 20% (it is to be noted that the number of outbursts markedly varied
from test to test at the same value of С
d
). The period of the alternation of different
convective flow patterns was rather short (it lasted approximately two minutes at С
d
= 20%
for a drop with D
0
= 5.6 mm). Completion of the surfactant dissolution from the drop
proceeded under conditions of quasi-diffusion. Depending on the values of С
d
and D
0
the
time of full dissolution varied from 7 to 10 minutes, which was tens times shorter than the
characteristic times of diffusion.
At described series of interferograms the transmitted beam passed through the optical
medium, whose properties were changing along direction of the light propagation. This
rendered the interpretation of the current interference pattern impossible (because in the
considered situation it was the main source of information concerning the two unknown
quantities — the amount and extent of the concentration inhomogeneity). On the other
hand, the visualized distribution of the isolines of equal optical path length was formed by
the field of surfactant concentration which enabled us to watch its propagation throughout
the cell volume, to estimate the intensity of its variation using the rate of change of the
interference bands at the selected points (e.g. in drop center) and also to define the
characteristic times of the main stages of the dissolution process (Kostarev et al., 2007).
Surfactant Transfer in Multiphase Liquid Systems
under Conditions of Weak Gravitational Convection
71
a) d)
b)
e)
c)
f)
Fig. 3. Distribution of concentration during dissolution of the alcohol from the drop.
D
0
= 4.7 mm with С
d
= 15% in a horizontal layer 1.2 mm thick. t, sec: 1 (а), 7 (b), 13 (c), 15 (d),
49 (e), 580 (f)
In view of the fact that on the interferogram a transition from one interference band to
another cannot be correlated with a certain variation of the concentration value, the
relationships describing evolution of the concentration field will be presented without
revaluation, i.e. as time variation of the number of interference bands N at the selected
points. However we propose to retain the term "distribution of concentration" for discussion
of the visualization results bearing yet in mind that the field structure is three-dimensional.
Mass Transfer in Multiphase Systems and its Applications
72
N
0
20
40
0 200 400 600
t, sec
Fig. 4. Time variation of surfactant concentration in center of a drops with diameter of
D
0
= 5.0 mm at different initial surfactant concentrations: С
d
, %: 10 (1); 15 (2); 20 (3)
N
0
30
60
0 200 400 600
t, sec
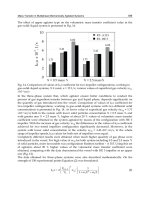
Fig. 5. Time variation of concentration of surfactant for drops at С
d
= 15% with different
initial diameters D
0
, mm: 4.2 (1); 6.2 (2); 8.8 (3)
As it is evident from the presented interferograms, the process of surfactant dissolution
from the drop proceeds in a quite symmetrical manner, suggesting that at the center of the
drop concentration of the surfactant is kept maximal. Fig. 4 shows its variation with time for
drops having close diameters but different initial surfactant concentration. It is readily seen
that over the selected range of С
d
the obtained curves coincide. Since observation of the drop
has been made up to the moment of complete surfactant dissolution, such behavior of the
curves means that by the time of first measurements, coinciding with the time of cessation of
the intensive Marangoni convection (see Fig. 3,c), the content of the surfactant at the center
1
2
3
4
1
2
3
Surfactant Transfer in Multiphase Liquid Systems
under Conditions of Weak Gravitational Convection
73
of the drops with different С
d
reaches the same value. From this observation follows the
conclusion that a reduction of the difference in the initial surfactant content between
different drops (even by two times) occurs at the stage of their formation and development
of intensive capillary motion, i.e. during the first 10–12 seconds elapsed after the start of
surfactant dissolution.
As we know now, in a horizontal layer, over a rather wide range of С
d
variation of
surfactant concentration in the drops is described by the same relationship, no matter how
many "outbursts" of capillary convection interrupting the gravitational mode of dissolution
have occurred. Therefore it is of interest to us to investigate variation of surfactant
concentration at the center for drops with different initial diameters (Fig. 5). As might be
expected the time of complete withdrawal of the surfactant increases with the size of the
drop.
r, mm
0
10
20
0 200 400 600
1 2 3 4 5 6 7
t, sec
Fig. 6. Time variation of concentration front position for drops with different initial
surfactant concentrations: C
0
, %: 1 (1), 3 (2), 5 (3), 10 (4), 15 (5), 20 (6), 30 (7)
The experiments made have revealed also some specific features of the dissolution process
for drops with a low content of the surfactant. Among these is the non-linear dependence of
the diffusion front velocity on the surfactant concentration (curves 2 and 3 in Fig. 6). It has
been found that intensification of the dissolution is caused by the oscillations of the free
surface of a quiescent drop, which occurs due to a periodic onset of the local capillary
convection at low alcohol concentrations (С
d
~ 3-5%). Further increase in the initial
surfactant concentration results in cessation of the surface oscillations (by this time the
Marangoni convection spreads over the whole surface of the drop), which reduces the rate
of dissolution (at С
d
from 7 to 11%, curve 4). It should be noted that similar periodic
ejections of the surfactant from the interface at small values of С
d
can be observed in the case
of free (spherical) drops of a binary mixture which dissolves in hydroweightlessness
conditions (Plateau technique). They occur as weak vertical oscillations of the drop or as
periodic up-and-down motions of the emulsion over the drop surface (at С
d
~1%) (Kostarev,
2005).
Mass Transfer in Multiphase Systems and its Applications
74
a)
d)
b) e)
c) f)
Fig. 7. Distribution of concentration during dissolution of the alcohol from the drop
D
0
= 5.1 mm with С
d
= 10% in the inclined layer, 1.2mm thick. Angle of inclination α = 9°.
t, sec: 1 (а), 4 (b), 15 (c), 35 (d), 62 (e), 111 (f)
Since our interest in dissolution of a drop in a thin horizontal layer is primarily dictated by
the prospects for simulation of the diffusion processes in liquid systems with non-uniform
distribution of surfactants in microgravity, it seems reasonable to give special attention to a
change in the structure of the concentration field in a slightly inclined layer. Shown in Fig. 7
are the series of interferograms of the concentration field generated during surfactant
dissolution from the drop in the layer inclined at an angle α = 9°.
As in the case of a horizontal layer, the diffusion of the surfactant began already in the
course of drop formation (Figs. 7,a–7,b) and the alcohol escaping from the drop spread
chiefly in the direction of layer rising (Fig. 7,c). The concentration field inside the drop also
Surfactant Transfer in Multiphase Liquid Systems
under Conditions of Weak Gravitational Convection
75
underwent rearrangement — the zone of maximum surfactant concentration shifted and
ceased to coincide with the geometrical center of the drop (Fig. 7,d). Although the capillary
convection is formally independent of the direction and the magnitude of gravitational
force, nonetheless the latter has indirect effect on the process. An "outburst" of the
Marangoni convection began at the upper part of the drop, accumulating alcohol, which had
already permeated through the drop surface but had not left it yet (Fig. 7,e). Thereafter the
wave of the capillary motion began to spread downward along the interface. As in the
previous case, the process of dissolution ceased in a quasi-diffusion mode, during which the
center of the concentration field remained shifted relative the drop center (Fig 7,f).
The tests demonstrated that despite the rearrangement of the concentration field the
intensity of mass transfer from the drop does not change with increasing α (at least up to α ~
12°). Evidently this is because the change in the concentration field is nothing but its
displacement as a whole with respect to the drop center at a distance proportional to the
angle of inclination (Fig. 8). In this case, a decrease in the total flux of the surfactant from the
lower part of the drop into the surrounding medium is compensated by an increase of the
flux from the upper part.
Z, mm
0
0.7
1.4
0 5 10 15
α, sec
Fig. 8. Displacement of the concentration field center in the drop relative its center during
surfactant dissolution in the inclined layer. D
0
~ 5.0 mm; С
d
= 10%
4. Surfactant diffusion from drop (space experiment)
4.1 Experimental setup
To obtain the drop in microgravity conditions we used a mixture containing 85% (by mass)
of chlorobenzene and 15% of isopropyl alcohol. The distilled water was used as a fluid
surrounding the drop. To prevent air bubble formation during long-time storage in
microgravity conditions the water and the binary mixture before pouring into the cuvette
were degassed by heating them for a long time up to the boiling point. For our experiment
we designed and manufactured a small-scale Fizeau interferometer (Fig. 9) (Kostarev et al.,
2007).
Mass Transfer in Multiphase Systems and its Applications
76
Fig. 9. Scheme of the setup for studying heat/mass transfer processes in microgravity
conditions: 1 — laser; 2 —micro-lens; 3 — semi-transparent mirror; 4 — lens-collimator;
5—Hele-Show cell with a drop; 6 and 7 — video cameras, 8 – device for drop formation
The collimator block of the interferometer consisting of microlens 2, semitransparent mirror
3, and lens-collimator 4 generated a plane-parallel coherent light beam of diameter 38 mm,
emerging from a semiconductor laser 1. The interferometer was equipped with two analog
video cameras 6 and 7, operating respectively with the reflected beam and the beam
transmitted through the cuvette 5. Camera 6 registered the interferograms of the
temperature and concentration fields in the whole volume of the cuvette and camera 7 was
intended to make more detailed records of the process evolution in the central part of the
cuvette. The frequency of both cameras was 25 frames a second and the resolving power
was 540×720 lines.
For experimental cuvette we chose the Hele-Shaw cell, which was a thin gap 1.2 mm thick
between two plane-parallel glass plates l with semitransparent mirror coating (Fig. 10). The
cell was encased in a metal frame 2 and formed a working cell of the interferometer adjusted
to a band of the infinite width. The insert 3 placed in the gap had a hollow, which was used
as a cuvette working cavity 35 mm in diameter. The cavity was filled with a base fluid
through the opening 4 which was then used to locate a thermal expansion compensator 5. A
drop of a binary mixture was formed with the help of a needle of medical syringe which
was placed along the cavity diameter. The needle was connected to the binary mixture
supply system, which included a bellows for a liquid mixture, multi-step engine with a cam
gear, and a device for needle decompression. The backbone of this device is a movable bar
connected by means of inextensible thread to a cam mechanism. Prior to experiment the bar
was inserted in the needle and the gap between them was sealed. After voltage was applied
to the engine the cam began to rotate and first removed the bar from the needle and then
bore against the wall of the bellows. As a result, the channel of the needle turned to be open
to a flow of the binary mixture from the bellows to the cuvette cavity, where it wetted the
2
1
3
7
4
5
6
8
27 cm
Surfactant Transfer in Multiphase Liquid Systems
under Conditions of Weak Gravitational Convection
77
side glass walls and formed a cylindrical drop of prescribed volume at the center of the
cuvette. After this the engine was automatically stopped.
Fig. 10. Scheme of Hele-Show cell for studying mass transfer processes:
1 — interferometric glasses, 2 — metal frame, 3 — plastic insert, 4 — opening, 5 — thermal
expansion compensator, 6 — tube for drop formation
To determine the flow structure formed during experiment we used the ability of the
composed liquid system to form a non-transparent emulsion of water in chlorobenzene and
emulsion of chlorobenzene in water while the alcohol diffused through the interface.
Focusing the camera 7 (see Fig. 9) on the mid-plane of the cuvette turned the drops of
emulsion into analogues of small light – scattering particles which provided flow
visualization inside and outside the drop on the background of interferogram of the
concentration field.
The total time of the test was 52 minutes. The experiment was carried out at ambient
temperature (20±1)°С.
4.2 Results
The analysis of video records showed perfect consistency between the performed
experiment and its cyclogram. As the experimental program envisaged during first five
minutes records of the interefernce patterns were made by video camera shooting the
central part of the cuvette. The absence of the alcohol distribution near the end of the
syringe needle suggested that its hermetic sealing was kept up to the beginning of the
experiment. There were no air bubbles on the video records made by the camera, and
neither there were the intereference bands on the periphery of the images which could be
indicative of non-uniform heating of the cuvette.
After switching on the multi-step engine the needle is unsealed so that the binary mixture
can be readily supplied to water filling the cuvette. It is to be noted that at first a rather large
volume of aqueous solution of the alcohol (up to 6.5 μl ) is ejected from the needle (Fig. 11,a)
and only after this the needle forms a drop of a binary mixture with a clear-cut interphase
Mass Transfer in Multiphase Systems and its Applications
78
boundary (Fig. 11,b). The maximal concentration of the alcohol in this drop is about 5.5%.
The reason for appearance of the aqueous solution of the alcohol in the needle is penetration
of water from the cavity into the channel of the needle after removal of the sealing bar.
a) d)
b) e)
c)
f)
Fig. 11. Evolution of the concentration field and flow structure during the drop formation.
External diameter of needle is 1.0 mm. Time from the test outset t, sec: 4.5 (a), 4.9 (b), 5.1 (c),
8.2 (d), 8.6 (e), 10.2 (f)
Since ejection of the drop is precede by appearance of the alcohol solution the drop during
first seconds of its existence is in a quiescent state being surrounded by a similar media.
Then as the drop grows it comes into contact with pure water which leads to initiation of
intensive solutocapillary motion of the drop surface due to generation of the surface tension
difference. As a result, the drop executes several oscillatory motions with large amplitude
(Fig. 11,c) like a drop in the known Lewis and Pratt experiment (Lewis & Pratt, 1953). The
oscillations of the drop extend the boundaries of the region containing liquid enriched with
Surfactant Transfer in Multiphase Liquid Systems
under Conditions of Weak Gravitational Convection
79
the alcohol. This leads to a decrease of the concentration gradient at the interface and the
growing drop again quiets down. Approximately at the same time the drop reaches the
lateral boundaries of the cavity gradually changing its shape from a spherical to a
cylindrical. As the drop turns into a cylindrical drop its internal structure becomes more and
more observable.
Further increase of the drop size is accompanied by formation of several internal solutal
zones in the vicinity of its boundary. In these zones transfer of the surfactant occurs with
quasi- diffusional velocities (the flow of the mixture caused by injection of the solution into
the drop is concentrated in its central part, Fig. 11,d). A jump-wise increase of the feeding
velocity by 2 times (at t = 8.3 sec) causes an abrupt intensification of the motion inside the
drop, which breaks down the established concentration field. Again the vortex flow spreads
over the whole drop while pure water reaches the surface of the drop in the zone of its
contact with needle. This leads to a repeated outburst of capillary convection (Fig. 11,e)
Development of the Marangoni convection is accompanied by deformation of the drop itself
and the surrounding front of surfactant concentration, which gains a quasi-periodic
structure. Then, as in the first case, a flow of the diffused surfactant into the zone, where
pure water comes into contact with the solution of the drop, causes retardation of the
capillary motion, which coincides in time with cessation of mixture supply to the drop
(Fig. 11,f). At this moment the maximal diameter d
0
of drop reaches 6.2 mm.
When the forced motion in the drop ceases, the water emulsion, captured during surfactant
diffusion at the time of intensive convection and kept near the drop surface, begins to
penetrate deep into the drop. The penetrating emulsion forms a clearly delineated layer
(Fig. 12,a). In the gap between this layer and the drop surface one can watch the formation
of a light layer of the mixture, which has lost most of the surfactant due to diffusion (a
decrease in the surfactant concentration leads to an abrupt change in the index of light
refraction, Fig. 12,b). Propagation of emulsion with velocities of about 0.2 mm/sec is
supported by a slow large-scale motion of the mixture in the drop caused by capillary
eddies formed near the needle (Fig. 12,c).
The source of eddy formation is the alcohol, which diffuses from the needle after cessation
of mixture supply. It creates a surfactant concentration difference at the free surfaces of the
air bubbles, generated near the needle due to a decrease of air solubility in the fluid of the
drop, in which alcohol concentration decreases. Most of the bubbles are formed at the drop
boundary and then migrate deeper and deeper into the drop under the action of capillary
forces. The average diameter of the bubble is of order 0.1 mm, and the maximum diameter is
~ 0.3 mm. Apart from the eddy flow there is a slow capillary motion of the mixture over the
drop surface toward its far pole (opposite to the tip of the needle). This flow also contributes
to the emulsion motion.
The motion of emulsion is accompanied by coalescence of part of its droplets, which settle
down on the walls of the cavity. (The arising droplets can be seen due to a trace of emulsion
kept in the stagnation zone behind them, Fig. 12,d). As the emulsion layer moves away from
the boundary, one can observe development of a small-cell motion near the bubbles, which
are in the diffusion gradient of the surfactant at the drop boundary. What is interesting,
detachment of these bubbles from the drop interface as well as the local displacement of the
drop boundary due to reduction of its area during diffusion of the surfactant causes a
specific stochastic fluttering of the drop surface.
Mass Transfer in Multiphase Systems and its Applications
80
a)
d)
b)
e)
c)
f)
Fig. 12. Evolution of the concentration field and flow structure during surfactant dissolution
process. Time from the test outset t, sec: 15.5 (a), 38.7 (b,) 88.4 (c), 163 (d), 251 (e), 273 (f)
The cell motion reaches maximum intensity at the drop pole opposite to the tip of the needle
(evidently due to the absence of flows generated earlier in this region). The air bubbles
formed in the immediate neighborhood, accelerates the motion of mixture from the center of
the drop and also favors the development of the cell motion. The arising flow is of three-
dimensional pattern and as the times goes it occupies an increasingly growing space and
even deforms the solutal front, which moves away from the drop (Fig. 12,e). Simultaneously
there occurs another interesting phenomenon – settling of gas bubbles at the cavity walls.
During sedimentation the bubbles take the form of irregular semi-spheres. This effect can be
observed at the time when the bubbles are in the emulsion cloud.
After five minutes from the beginning of drop formation the velocity of the fluid flow in the
drop decreases practically to zero (Fig. 12,f) and the volume of the drop reduces to 0.9 of its
maximum (Fig. 13).
Surfactant Transfer in Multiphase Liquid Systems
under Conditions of Weak Gravitational Convection
81
V/V
max
0.0
0.5
1.0
1 10 100 1000 10000
t, sec
Fig. 13. Variation of the relative volume of dissolving drop with time
Fig. 14 shows a series of interferograms of the concentration field in the vicinity and inside
the drop at different moments of time. As it is seen from the figure, in the following, after
first five minutes, the only observable events are gradual dissolution of the emulsion and
variation of the surfactant concentration gradient in the radial direction. Apart from this a
decrease of the alcohol concentration in the region near the drop boundary leads to a growth
of the surface tension and, as a result, to local jump-wise displacement of the drop boundary
while the area of the latter decreases.
Hence, based on the analysis of the obtained video records we can draw a conclusion that
during diffusion of the surfactant from the drop at least three times there were favorable
conditions for the development of the intensive Marangoni convection. However, all the
observed capillary flows rapidly decayed. In the first two cases – during drop formation and
a change in the mixture feeding regime – the Marangoni convection decay was provoked by
a flow of a surrounding fluid with higher surfactant concentration into the zone of the
capillary motion, which eliminates the concentration difference along the interface. On the
other hand, generation of such surfactant distribution in the vicinity of the drop was made
possible only in the absence of the Archimedean force with the result that molecular
diffusion became a governing factor in the process of mass transfer outside the drop. In the
third case, when the Marangoni convection was initiated near the gas bubbles inside the
drop, the reason of its decay was a decrease of surfactant percentage in the mixture filling
the needle channel and rapid recovery of the surfactant distribution homogeneity in the
region near the bubbles due to convective mixing.
Video recording of the central part of the cuvette has made it possible to trace the evolution
of initiated flows, whereas records of the general view of the drop (Fig. 15,a) allow us to
investigate propagation of the concentration front from the dissolving drop of the binary
mixture and to establish the relationship between the position of its boundary and time
(Fig. 15,b). It is readily seen that propagation of the concentration front is described fairly
Mass Transfer in Multiphase Systems and its Applications
82
well by the power law with the exponent 1/3. Over the whole period of the experiment
position of the concentration front changed by 5 mm suggesting that propagation of the
surfactant occurred with diffusion velocities. According to measurements made in the
second half of the experiment, the concentration filed has no preferential direction of
propagation, which allows us to suppose that the value of the residual accelerations on the
satellite "Foton-M 3" during the experiment was no higher than 10
-4
g
o
.
a)
b)
c)
Fig. 14. Evolution of the concentration field and flow structure during surfactant dissolution
process. Time from the test outset t, min: 15.2 (a), 19.3 (b), 28.8 (c)
Surfactant Transfer in Multiphase Liquid Systems
under Conditions of Weak Gravitational Convection
83
a)
b)
R, mm
0
3
6
0 1000 2000 3000
t, sec
Fig. 15. View of distribution of surfactant concentration around drop (a) and variation of the
boundary position (b) of concentration field with time
A detailed structure of the concentration field generated by surfactant diffusion (Fig. 16)
was defined by making use of the computer–aided overlapping of images obtained from
both video cameras (such an approach was used to solve the problem with relatively low
value of their resolving power). Since only one video recorder was used for recording, we
chose for overlapping the images shot by different camera with the shortest time span
between them. It should be emphasized that distribution of the surfactant concentration
outside the drop was obtained by way of direct measurements, which were made based on
the interferograms starting from the field (front) boundary. It was impossible to apply this
approach inside the drop because of the unknown value of the surfactant concentration at
the drop boundary. This value remained unknown due its jump-wise change provoked by a
difference in the chemical potentials. We determined it from the curves, which were plotted
based on the coefficient of the equilibrium distribution of the isopropyl alcohol in the
chlorobenze-water system under the assumption that the dissolution process was quasi-
equilibrium due to predominance of diffusion. For the selected system of fluids the value of
this coefficient was 0.12 in 15% water solution of the alcohol and as the alcohol
concentration decreased, this coefficient also decreased to 0.10.
As it follows from Fig. 17, alcohol concentration at the drop surface at the time when the
motion of the mixture in the drop ceases, is ~ 14%, which actually coincides with the initial
concentration of the alcohol in the binary mixture of the drop. Note that at the end of the test
the surfactant concentration at the drop boundary decreased approximately by two times.
This reduction can be approximated with the least error by the exponential relationship. For
the sake of comparison, on the Earth under conditions of maximum suppression of the
gravitational convection the drop of the same volume completely lost the alcohol in a matter
of ten minutes.
Mass Transfer in Multiphase Systems and its Applications
84
C, %
0
5
10
15
0369
r, mm
Fig. 16. Radial distributions of surfactant concentration in the vicinity and inside the drop
at various time moments. t, min: 4.9 (1), 21.3 (2), 31.0 (3), 42.5 (4), 50.7 (5)
C, %
0
5
10
15
0 1200 2400 3600
t, sec
Fig. 17. Variation of surfactant concentration in water near the drop surface with time
5. Drop saturation by surfactant from homogeneous solution
In this series of test the initial mass concentration С
0
of the alcohol in the solution ranged
from 1% to 50%. Fig. 18 shows two series of the interferograms reflecting the evolution of
the alcohol distribution in the drop at different initial concentrations of alcohol in the
solution. It is seen that at С
0
≤ 10% absorption of alcohol occurs without the development of
the capillary convection in spite of the interference of the gravity force, which generates the
vertical concentration gradient and, accordingly, the gradient of the surface tension. The
1
2
3
4
5
d
0
Surfactant Transfer in Multiphase Liquid Systems
under Conditions of Weak Gravitational Convection
85
latter seemed to be not large enough to produce shear stresses capable of deforming the
adsorbed layer, which was formed at the interface from the impurities found in water
(Birikh et al., 2009). In the absence of the Marangoni convection, alcohol was slowly
accumulated at the upper part of the drop. As soon as an increasingly growing thickness of
the alcohol layer caused an additional optical beam path difference of half of the light wave
length, the color of the drop on the interferogram changed (Figs. 18,b-18,c).
a) d)
b)
e)
c)
f)
Fig. 18. Saturation of the chlorobenzene drop with isopropyl alcohol from its solution filling
a horizontal Hele-Shaw cell. С
0
= 10%, D
0
= 5.2 mm; t, min: 0.5 (a), 7.0 (b), 10.0 (с);
С
0
= 20%, D
0
= 5.4 mm; t, min: 0.1 (d), 1.0 (e), 6.0 (f)
At С
0
~ 20% the gradients of surfactant concentration become higher than the threshold
values which results in the development of a fine-cell capillary motion at the drop surface.
With the growth of surfactant concentration the velocity of the surfactant flow into the drop
increases and the gravitational force has not managed to smooth the layer of alcohol along
the drop diameter. Due to the fact that the layer is formed from alcohol, rising along the
lateral surface of the drop, its thickness is found to be larger at the layer edges. On the
Mass Transfer in Multiphase Systems and its Applications
86
interferograms the radial variation in the layer thickness is represented by a system of
concentric isolines, which merge with the passage of time at the center of the drop
(Figs. 18,d -18,e). On the drop periphery one can readily see a thin layer of rising alcohol,
which has diffused through the interface (Fig. 18,f).
N/N
0
0.0
0.5
1.0
0204060
t, min
Fig. 19. The relative number of isolines inside the drop as a function of time for different
concentrations of solution С
0
, %: 10 (1), 20 (2), 30 (3). The initial drop area S
0
∼ 35 mm
2
In Fig. 19, a relative number of the interference bands vanishing at the center of the drop is
plotted versus the time elapsed from the moment of drop formation for solutions of
different concentrations (for normalization we used the maximum number of the bands
obtained in each cases). The analysis of the curve behavior shows that duration of the phase,
in which a convective mass transfer dominates over a pure diffusion transfer, rapidly
increases with the growth of surfactant concentration in the solution.
Absorption of alcohol from its solution should cause a growth of the drop volume, which in
the case of the cylindrical drop with the fixed thickness is manifested as an increase of its
area. Indeed, saturation of the drop with alcohol was accompanied by a change of its area.
However, this variation was of a complicated nature, which was specified by the initial
concentration of the surfactant in the solution (Fig. 20). Such a behavior of the absorbing
drop can be explained by an increase in the reciprocal solubility of water and chlorobenzene
with a growth of concentration of their common solvent, viz., the content of alcohol in their
solutions. The maximum increase (~20%) in the drop area was observed at the initial stage
of its saturation at С
0
= 40% (curve 3 in Fig. 20). Then the drop began to dissolve due to
increasing diffusion of chlorobenzene in the surrounding solution. A delay in dissolution
was caused by the insufficient content of the surfactant inside the drop. The desired
concentration was achieved only some time after injection of the drop into the solution. In
the solution containing 45% of alcohol (curve 4 in Fig. 20) concentration of the absorbed
surfactant at the drop boundary immediately reached the value, at which chlorobenzene
began to dissolve in the surrounding solution. The process of the surfactant extraction
turned into the reverse – dissolution of the extragent.
1
2
3
Surfactant Transfer in Multiphase Liquid Systems
under Conditions of Weak Gravitational Convection
87
S/S
0
0.0
0.8
1.6
0204060
t, min
Fig. 20. The relative area of the chlorobenzene drop as a function of time for isopropyl
solutions of various concentrations. The initial drop area S
0
∼ 35 mm
2
. С
0
, %: 10 (1), 30 (2),
40 (3), 45 (4)
Dissolution of chlorobenzene gave rise to an intensive gravitational flow in the surrounding
solution. This process every so often was accompanied by generation of both the vertical
and longitudinal (lying in the layer plane) difference of the surfactant concentration at the
drop surface provoking the development of a large-scale capillary flow.
In our case, such a flow occurred in the form of two quasi-stationary vortices lying in the
horizontal plane (Fig. 21). Note that the flow was sustained by a small difference (~3%) in
the surfactant concentration between the "western" and "eastern" poles of the drop. The
initial solution entrained by the flow reached the drop surface in the form of the
concentration "tongue", which then split into the streams flowing round the drop. As they
spread along the drop surface they lost part of alcohol due to its diffusion. After that they
again merged into a single flux, which drifted away from the drop carrying part of alcohol–
chlorobenzene mixture.
In turn, alcohol penetrated into the drop and formed two fluxes, which first moved along
the interface and then after collision at the western pole of the drop spread deep into the
drop generating a two-vortex flow. The flows initiated inside and near the drop closely
resemble in structure the convective flow near the drop absorbing the surfactant from its
stratified solution in the vertical Hele-Shaw cell (Kostarev et al., 2007). However, under
conditions of maximum suppression of gravitational convection the considered flow
remains quasi-stationary – in contrast to the flow in a vertical cell, which at the similar
surfactant concentration differences is of the pronounced oscillatory nature. At С
0
= 50% the
phase boundary between the drop and the solution disappears leading to the formation of a
three-component liquid mixture. Phase separation of the fluid system vanishes within the
first two minutes after placing the drop into the surfactant solution.
1
2
3
Δ
С, %
4
Mass Transfer in Multiphase Systems and its Applications
88
a)
b)
c)
Fig. 21. Distribution of concentration of isopropyl alcohol during its absorption by the drop
of chlorobenzene from the solution with initial concentration С
0
= 45%. D
0
= 6.5 mm. t, min:
0 (а); 40 (b); 190 (c, general view of the cell flow with the drop in center)
Surfactant Transfer in Multiphase Liquid Systems
under Conditions of Weak Gravitational Convection
89
a)
b)
c)
Fig. 22. Dissolution of a drop of chlorobenzene in 50% solution of alcohol. t, min: 1.25 (а);
9.0 (b); 11.2 (c)
Fig. 22 illustrates the main stages of drop dissolution in the surrounding solution at С
0
=
50%. Absorption of alcohol at the moment of drop formation diminishes the interface
surface tension to an extent that it turns to be impossible to form a cylindrical drop even in
one-millimeter clearance. Nevertheless, the original drop has an interface with sufficient
curvature, owing to which the probing light beam scatters. As a result the drop interface is
seen on the interferogram as a grey spot (Fig. 22,a). Then the drop surface increases because
the drop spreads out over the cavity bottom as the surface tension continuously decreases.
Further dissolution is accompanied by deformation of both the drop interface and the
boundary between the drop and a solid substrate. Disappearance of the interface in the fluid
Mass Transfer in Multiphase Systems and its Applications
90
system makes the mixture optically transparent because the jumps of the refraction
coefficient have vanished. Fig. 22,b presents the interferogram of the optical inhomogeneity
caused by inhomogeneous concentration of chlorobenzene at the place of the former drop. It
is seen that a transition zone between the solution and the mixture with higher content of
chlorobenzene has a well-defined relief, which is similar to the relief of the free surface of
the drop. In Fig. 22,с we can see part of the concentration inhomogeneity picture with
typical distribution of chlorobenzene in alcohol in the form of "fingers", whose origination
can be attributed to a flow of chlorobenzene down the spatial inhomogeneities of the
transition zone.
The period of spatial perturbations of the drop-solution interface, repeated further by the
relief of the transition zone of the concentration inhomogeneity, is defined by the physico-
chemical properties of the interacting fluids. As for the solution, these properties are
strongly dependent on surfactant concentration. Indeed, according to the results of
measurement the angular distance between the "fingers" increases with a growth of the
surfactant solution concentration (Fig. 23).
a, rad
0.06
0.09
0.12
39 43 47 51
C, %
Fig. 23. Variation of the angle between "fingers" with the growth of initial concentration of
the surfactant solution
6. Conclusion
As seen from a comparison of space and terrestrial experiments, the data obtained in
microgravity differ markedly from the results of the laboratory study of surfactant diffusion
in a thin horizontal layer. In the later case a small coefficient of surfactant diffusion
facilitated generation of the density difference in the originally homogeneous surrounding
fluid. This difference was large enough for development of the gravitational motion inside
and outside the drop. Nevertheless a relative contribution of the Marangoni convection to
the process considerably increased — the action of the capillary forces mainly determined
the rate of mass transfer at the beginning of surfactant diffusion. Only a decrease in the
surfactant concentration below some critical value led to regeneration of the gravitational-
diffusion mechanism of mass transfer, yet its action was repeatedly interrupted by the
Surfactant Transfer in Multiphase Liquid Systems
under Conditions of Weak Gravitational Convection
91
"outbursts" of intensive capillary convection. Because of a three-dimensional structure of the
flows in the laboratory conditions, the application of the interference method posed many
difficulties; only the qualitative characteristics were used for description of the evolution of
concentration fields. However, the laboratory experiments allowed us to make an optimal
choice of the parameters for the space experiment and to prepare its preliminary cyclogram.
The space experiment "Diffusion of the surfactant from a drop" was successful. The
sensitivity of the new setup proved to be an order of magnitude higher than that of the
shadow device "Pion-M" used on the "Mir" space station. The weight of the setup was
reduced by more than an order of magnitude, and its external dimensions were also down
sized. The interferometer can operate in the automatic regime allowing performance of
experiments onboard the unmanned space vehicles. The obtained data supported the view
that in microgravity conditions the mass transfer processes involving surfactant diffusion
through the interface can proceed without excitation of intensive capillary convection.
Because of diffusion in the absence of capillary convection, the surfactant concentration
reaches rather high values at both sides of the drop surface. This leads to much greater
extent of mutual dissolution of the base fluids compared to the terrestrial conditions.
Therefore, the interface failure in such a system can occur at much lower concentration of
the surfactant which plays the role of a common solvent for both the base fluids. On the one
hand, this allowed a more exact computation of the value of this concentration, which is an
essential prerequisite for development of the theoretical grounds of phase transitions in
three-component liquid systems. On the other hand, reduction of the limiting concentration
opens the way to intensive experimental studies of the hydrodynamic effects involving the
interface failure.
At the same time, based on terrestrial simulation data, we can expect the development of a
large-scale Marangoni flow around the drop absorbing the surfactant from the
homogeneous surfactant solution in microgravity conditions. Such a different evolution of
mass transfer processes in the surfactant solution emphasizes again the importance of
experimental investigations in real microgravity conditions.
7. Acknowledgements
The work was supported by Russian Foundation of Fundamental Research under project
No 09-01-00484, joint project of SB, UB and F-EB of RAS (116/09-С-1-1005) and the program
of the Department of Power Engineering, Mechanical Engineering, Mechanics and Control
Processes of RAS No 09-Т-1-1005.
8. References
Agble, D. & Mendes-Tatsis, M.A. (2000). The effect of surfactant on interfacial mass transfer
in binary liquid-liquid systems. J. Heat and Mass Transfer, Vol. 43, p. 1025.
Amar, A.; Groß-Hardt, E.; Khrapitchev, A.A.; Stapf, S.; Pfennig, A. & Blümich, B. (2005).
Visualizing flow vortices inside a single levitated drop. J. of Magnetic Resonance,
Vol. 177, No. 1, pp. 74–85.
Bratukhin, Yu.K.; Kosvintsev, S.R. & Makarov, S.O. (2001). Droplet motion induced by
diffusion of soluble surfactant to the external medium: theory. Colloid J., Vol. 63,
No. 3, pp. 326–332.
Mass Transfer in Multiphase Systems and its Applications
92
Burghoff, S. & Kenig, E.Y. (2006). A CFD model for mass transfer and interfacial phenomena
on single droplets. AIChE J., Vol. 52, No. 12, pp. 4071–4078.
Gustafson, S.E.; Kjellander, R.A.E. & Rolf, A.E. (1968). An interferometer for direct recording
of refractive index distributions. Z. Naturforch., Vol. 23a, No. 2, pp. 242–246.
Henschke, M. & Pfennig, A. (1999). Mass transfer enhancement in single drop extraction
experiments. AIChE J., Vol. 45, No. 10, pp. 2079–2084.
Kostarev, K.G. & Pshenichnikov, A.F. (2004). Gravitational convection of a liquid mixture in
a horizontal cylindrical gap at moderate Grasshoff numbers. Cosmic research, Vol.
42, No. 2, pp. 115–122.
Kostarev, K.G. (2005). The study of the extraction of surface-active component of a binary
liquid from model ("cylindrical") droplets. Colloid J., Vol. 67, No. 3, pp. 357–362.
Kostarev, K.G.; Levtov, V.L.; Romanov, V.V.; Shmyrov, A.V.; Zuev, A.L. & Viviani, A.
(2007). Experimental investigation of mass transfer in fluid systems in microgravity
conditions. Proceedings of 58
th
Int. Astronautical Congress, Hyderabad, India, 2007.
Paper № IAC-2007-A2.4.06. 10 p.
Kostarev, K.G.; Levtov, V.L.; Romanov, V.V.; Shmyrov, A.V. & Viviani, A. (2010).
Experimental study of surfactant transfer in fluid systems in microgravity
conditions. Acta Astronautica, Vol. 66, No. 3–4, pp. 427–433.
Kosvintsev, S.R. & Reshetnikov, D.G. (2001). Droplet motion induced by diffusion of soluble
surfactant to the external medium: experiment. Colloid J., Vol. 63, No. 3, pp. 318–
325.
Lewis, J.B. & Pratt, H.R.C. (1953). Instabilities induced by mass transfer and deformable
fluid interfaces. Nature, Vol. 171, pp. 1155—1161.
Myshkis, A.D.; Babskii, V.G.; Kopachevskii, N.D.; Slobozhanin, L.A. & Tyuptsov, A.D.
(1987). Low-Gravity Fluid Mechanics, Springer, the Netherlands.
Subramanian, R.S. & Balasubramaniam, R. (2001). The motion of bubbles and drops in reduced
gravity, Cambridge University Press, Cambridge, UK.
Waheed, M.; Henschke, M. & Pfennig, A. (2002). Mass transfer by free and forced convection
from single spherical liquid drops. J. of Heat and Mass Transfer, Vol. 45, No. 22, pp.
4507–4514.
Wegener, M.; Grunig, J.; Stuber, J. & Paschedag, A.R. (2007). Transient rise velocity and mass
transfer of a single drop with interfacial instabilities – experimental investigations.
Chemical Engineering Science, Vol. 62, No. 11, pp. 2967-2978.
Wegener, M.; Fevre, M.; Paschedag, A.R. & Kraume, M. (2009a). Impact of Marangoni
instabilities on the fluid dynamic behaviour of organic droplets. J. of Heat and Mass
Transfer, Vol. 52, No. 11–12, pp. 2543–2551.
Wegener, M.; Paschedag, A.R. & Kraume, M. (2009b). Mass transfer enhancement through
Marangoni instabilities during single drop formation. J. of Heat and Mass Transfer,
Vol. 52, No. 11–12, pp. 2673–2677.
Zuev, A.L. & Kostarev, K.G. (2006). Oscillation of a convective flow round the air bubble in a
vertically stratified solution of a surfactant. J. Experimental and Theoretical Physics,
Vol. 130, No. 2, pp. 363–370.
5
Mass Transfer in Multiphase
Mechanically Agitated Systems
Anna Kiełbus-Rąpała and Joanna Karcz
West Pomeranian University of Technology, Szczecin
Poland
1. Introduction
In this chapter, the results of the experimental studies concerning the volumetric mass
transfer coefficient k
L
a obtained for mechanically agitated gas – liquid and gas – solid –
liquid systems are discussed.
Mechanically agitated gas – liquid and gas –solid – liquid systems are widely used in many
processes, for example oxidation, fermentation or wastewater treatment. In such cases,
oxygen mass transfer between gas and liquid phases in the presence of solid particles can be
described and analyzed by means of the volumetric mass transfer coefficient k
L
a. In the gas –
liquid and gas – solid – liquid systems, the k
L
a coefficient value is affected by many factors
such as geometrical parameters of the vessel, type of the impeller, operating parameters of
the process (impeller speed, aeration rate), properties of the continuous phase (density,
viscosity, surface tension, etc.) and also by the type, size and loading of solid particles.
To improve the efficiency of the processes conducted in gas – liquid and gas – solid – liquid
three – phase systems two or more impellers on the common shaft are often used
(Kiełbus—Rąpała & Karcz, 2009). Multiple – impeller stirred vessels due to the advantages
such as increased gas hold – up, higher residence time of gas bubbles, superior liquid flow
characteristics and lower power consumption per impeller are becoming more important
comparing with single – impeller systems (Gogate et al., 2000). As the number of energy
dissipation points increased with an increase in the impellers number on the same shaft,
there is likely to be an enhancement in the gas hold – up due to gas redistribution, which
results into higher values of volumetric gas – liquid mass transfer coefficient (Gogate et al.,
2000).
Correct design of the vessel equipped with several agitators, therefore, the choice of the
adequate configuration of the impellers for a given process depends on many parameters.
That, which of the parameters will be the most important depends on the kind of process,
which will be realized in the system. For the less oxygen demanding processes the designer
attention is focused on the mixing intensity much more than on the volumetric mass transfer
coefficient. When the most important thing is to achieve high mass transfer efficiency of the
process, the agitated vessel should be such designed that the configuration of the agitators
used ensure to get high both mixing intensity and the mass transfer coefficient values
(Kiełbus-Rąpała & Karcz, 2010).