VASCULAR COMPLICATIONS OF DIABETES - PART 2 pot
Bạn đang xem bản rút gọn của tài liệu. Xem và tải ngay bản đầy đủ của tài liệu tại đây (287.57 KB, 23 trang )
SECTION I • MICRO- AND MACROVASCULAR COMPLICATIONS OF DIABETES
18
develop microvascular complications even as late as 30–40 years after the
onset of the disease. On the other hand, a small minority may have severe
retinopathy after only 5–7 years. Clustering of nephropathy, for example,
has been observed in some families and the history of essential hypertension
in a first-degree relative is associated with an increased risk of nephropathy
in the family member with type 1 diabetes. In WESDR there were no obvi-
ous differences between people with type 1 and type 2 diabetes in the inci-
dence of microvascular complications in relation to rising HbA1
C
.
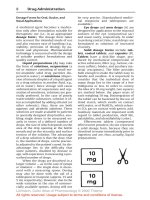
In the UKPDS the risk of each of the microvascular and macrovascular
complications of type 2 diabetes was strongly associated with hyperglycaemia,
as measured by HbA1
C
. There was no evidence of a threshold and there was a
threefold increase over the range of <6% to >
10% (Fig. 2.6).
Despite all these studies demonstrating a clear relationship between hyper-
glycaemia, HbA1
C
and the development of microvascular complications, the
reasons remain obscure. Although glycosylated haemoglobin reflects ‘recent’
Fig. 2.6 Estimated hazard ratios for significant risk factors for coronary artery disease
occurring in 335 out of 3,055 diabetic patients. BMJ 1998; 316: 823–828, with
permission.
3
1
0.4
40 45 50 55 60 7065 2.5 3.0 3.5 4.0 4.5 5.0 1.00.9 1.1
Age (years) High density lipoprotein
cholesterol (mmol/l)
Low density lipoprotein
cholesterol (mmol/l)
1.2 1.3
40 45 50 55 60 7065 2.5 3.0 3.5 4.0 4.5 5.0 1.00.9 1.1
Haemoglobulin A1
c
(%)
never
smokers
ex-
smokers
current
smokers
Systolic blood
pressure (mmHg)
1.2 1.3
3
1
0.4
Estimated hazard ratios (95% Cl)Estimated hazard ratios (95% Cl)
CHAPTER 2 • RISK FACTORS
glycaemic control, there are inevitably differences between individuals
regarding the rates of formation and breakdown of glycated haemoglobin and
no clear answers about how these may relate to risk of microvascular compli-
cations. A single HbA1
C
must be interpreted with caution since recent studies
have shown that in an individual with stable glycaemic control the 95% con-
fidence limits for an HbA1
C
of 7.0% are between 6.1 and 7.9%. The DCCT
study data revealed that past glycaemia over 3–4 months contribute only 10%
to the current HbA1
C
and the most recent 30 days contribute 50%.
Monozygotic twin studies have shown that 62% of the population variance in
HbA1
C
is genetically determined. Put simply, an HbA1
C
of 8.0% in a person
with diabetes whose pre-diabetic HbA1
C
was 3.5% may represent a complete-
ly different risk of developing microvascular complications than a similar
patient with the same HbA1
C
, whose prediabetic HbA1
C
was 5.8%.
HYPERTENSION, HYPERLIPIDAEMIA AND SMOKING
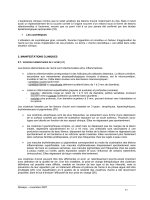
Hypertension exacerbates the micro- and macrovascular complications of
diabetes (Fig. 2.7) but it is important to differentiate between the hyperten-
sion associated with the two main types of diabetes. People with type 1 dia-
betes at diagnosis have similar blood pressures to those without diabetes and
the development of hypertension increases with diabetes duration and is
associated with the development of nephropathy. Microalbuminuria and
proteinuria are manifestations of renal involvement. Untreated, the hyper-
tension worsens, protein excretion rates increase and glomerular filtration
rates fall. Clustering of nephropathy in families suggests that there may be a
genetic predisposition to nephropathy and hypertension in some individuals
with type 1 diabetes.
Hypertension in people with type 2 diabetes, however, is much more com-
mon, may precede the diagnosis, and is present in between 30 and 50% at
diagnosis. It is a major component of the metabolic syndrome that consti-
tutes type 2 diabetes and appears to reflect insulin resistance. The effects on
the cardiovascular system are more profound than similar blood pressure lev-
els in a person without diabetes. For example, in the MRFIT study, rising sys-
tolic blood pressure was associated with increasing 10-year CHD mortality
which was 3–5 times greater in those with diabetes.
Epidemiological studies have demonstrated the continuous relationship
between serum cholesterol and risk of atherosclerotic vascular disease, par-
ticularly CHD. This was confirmed by the Framingham study and, in the
MRFIT study when over 300,000 men aged 35–57 years were screened, the
relationship between cholesterol and death from CHD was independent of
smoking and hypertension and continuous across the age range. There was
also a strong relationship between CHD and cholesterol level in people
with diabetes.
19
SECTION I • MICRO- AND MACROVASCULAR COMPLICATIONS OF DIABETES
20
The lipid abnormalities associated with diabetes are both qualitative and
quantitative. There are no quantitative differences between patients with type 1
diabetes and those without diabetes, though abnormalities may appear with the
development of nephropathy or if glycaemic control is poor. HDL levels are
often in the normal range but sub-fractions of HDL show significant differences
from the normal population. For example, HDL
2
levels have a strong negative
correlation with CHD and in type 1 diabetes levels of this subfraction are low, in
favour of HDL
3
, which does not have the same cardioprotective properties.
In type 2 diabetes the spectrum of lipid abnormalities is broader and an
essential element of the metabolic syndrome. HDL levels are low, and associ-
ated with hypertriglyceridaemia. Total and LDL-cholesterol levels are similar
to non-diabetic levels, but again qualitative differences exist. LDL particles
are small and dense and thought to be more atherogenic. Nevertheless, LDL
levels correlate with the presence of clinical macrovascular disease in both
type 1 and type 2 diabetes. Hypertriglyceridaemia as a risk factor CHD
Fig. 2.7 Incidence rates (95% confidence interval) of myocardial infarction and micro-
vascular end points by category of updated mean systolic blood pressure, adjusted for
age, sex and ethnic group expressed for white men aged 50–54 years at diagnosis and
mean duration of diabetes 10 years. BMJ 2000; 321: 412–419, with permission.
50
40
30
Adjusted incidence per 1000 person years (%)
Systolic BP
20
10
0
110 120 130 140
Myocardial infarction
Microvascular end points
150 160 170
CHAPTER 2 • RISK FACTORS
remains controversial, but accounts for some of the other lipid changes such
as low HDL and the formation of small dense LDL. There are also correla-
tions with plasminogen activator inhibitor I (PAI-I).
Smoking is an independent risk factor for macrovascular disease and in the
MRFIT study increased the 10-year risk of dying from CHD by 2.4 times in
non-diabetics (from 10.1 to 23.9 per 1,000) and by 1.6 times in those with dia-
betes (from 44.5 to 68.7 per 1,000). Smoking has also been implicated in the
progression of microvascular and other diabetic complications including
retinopathy, nephropathy and necrobiosis lipoidica. Analysis of the MRFIT
data suggested that stopping smoking was one of the most effective interven-
tions at reducing mortality from macrovascular disease.
ETHNICITY
There appear to be definite ethnic variations in the prevalence of complica-
tions of type 2 diabetes. Compared to the WESDR population of non-
Hispanic whites, retinopathy is much more common in the Pima Indians of
Arizona and the Mexican-Americans in San Antonio, Texas. Nephropathy
and CHD is more common in indigenous peoples such as the Maori in New
Zealand (Fig. 2.8) and South Asians, occurring a decade or so earlier, than
Europeans. On the other hand, CHD is less frequent in the Pima Indians with
type 2 diabetes than many non-diabetic white populations in the US.
21
Fig. 2.8 Risk of recorded death with nephropathy by Cox’s proportional hazards
regression model after accounting for age, sex, and source of patient. Shown are
Europeans with type 2 diabetes (
■
): Maori with type 2 diabetes (
◆
): and Pacific
Islands people with type 2 diabetes (
▲
).
Rate of death from nephropathy
0.00
102345
Time (years)
67
0.02
0.04
0.06
0.08
SECTION I • MICRO- AND MACROVASCULAR COMPLICATIONS OF DIABETES
22
CONCLUSION
Risk factors for the micro- and macrovascular complications of diabetes are
similar in both type 1 and type 2 diabetes but significant differences exist in the
prevalence and role of hypertension and hyperlipidaemia. Duration of dia-
betes is significantly correlated with complications in type 1 diabetes. An essen-
tial part of diabetes care is an annual structured risk assessment so that indi-
vidual management plans can be developed to target these increased risks.
FURTHER READING
Kannel WB, McGee DL. Diabetes and glucose tolerance as risk factors for cardiovascular dis-
ease: The Framingham Study. Diabetes Care 1979; 2: 120–6.
Stamler J, Vaccaro O, Neaton JD, Wentworth D. for the Multiple Risk Factor Intervention
Trial Research Group. Diabetes, other risk factors and 12 year cardiovascular mortality for
men screened in the Multiple Risk Factor Intervention Trial. Diabetes Care 1993; 16: 434–44.
Yudkin JS. How can we best prolong life? Benefits of coronary risk factor reduction in non-
diabetic and diabetic subjects. BMJ 1993; 306: 1313–18.
CHAPTER 3
DIABETIC NEPHROPATHY
Adrian R. Scott MD, FRCP
23
INTRODUCTION
Diabetes is now the commonest cause of end-stage renal failure (ESRF) in
Europe and North America. This is mainly because of the increasing preva-
lence of diabetes and because people with diabetes are now accepted more
readily onto renal replacement programs, having been excluded in the
past. In Scandinavia and the USA, 30% of people requiring dialysis or
transplantation have diabetes though there are significant variations across
Europe. Between 20–30% of people with type 1 or type 2 diabetes will
develop nephropathy but only a small percentage of people with type 2 dia-
betes will progress to ESRF, most dying of cardiovascular disease long
before the need for renal dialysis. Nevertheless, the much higher preva-
lence of type 2 diabetes means that up to 50% of patients with diabetes
requiring dialysis are from this group.
There are considerable ethnic variations in the prevalence of nephropathy.
For example, in the UK Anglo-Asians and Afro-Caribbeans have a much
higher prevalence of nephropathy. In the USA Pima Indians with type 2 dia-
betes are particularly at risk, as are Maori in New Zealand.
CLINICAL PRESENTATION
The earliest clinical manifestation of diabetic renal disease is the finding of
small quantities of albuminuria (30–300mg/24 h or 20–200 μg/min), often
within 5–10 years of diagnosis, which increases progressively over a number of
years. In cross-sectional studies, microalbuminuria is present in approximately
20–30% of insulin-treated adults and 10–30% of Caucasian adults with type 2
diabetes, and there is a clear relationship with glycaemic control (Fig. 3.1).
The progression of nephropathy is best documented in type 1 diabetes
(Fig. 3.2). A history of hypertension in a first-degree relative and differences
in Na
+
–Li
+
counter-transport suggest there is a component related to genet-
ic predisposition. Poor glycaemic control may initiate functional changes
within a year or two of the diagnosis of diabetes, including renal hypertro-
phy and hyperfiltration with an increase in renal blood flow and glomerular
filtration rate (GFR). These changes are reversible and metabolically
dependent. Recent studies suggest that even levels of albumin excretion rate
above 10μg/min are highly predictive of future microalbuminuria. Blood
pressure rises progressively in parallel with increasing albuminuria and sec-
ondary lipid abnormalities also occur. The glomerular barrier loses its size
selectivity and as macroproteinuria is reached GFR has already started to
decline. Occasionally, nephrotic syndrome may result.
Vascular Complications of Diabetes: Current Issues in Pathogenesis and Treatment, Second Edition
Edited by Richard Donnelly, Edward Horton
Copyright © 2005 by Blackwell Publishing Ltd
The rate of decline of renal function is linear but the time to ESRF varies
considerably between individuals (Fig. 3.3). Albuminuria is a manifestation of
a generalized vasculopathy and a high proportion of patients with nephro-
pathy develop symptomatic coronary heart disease (CHD) in the early course
of their renal disease. The associated anaemia and hypertension lead to left
ventricular hypertrophy (LVH) and heart failure. Death from stroke, myocar-
dial infarction or peripheral gangrene occurs in nearly 75% of patients, either
before or during renal replacement therapy, and 50% of type 1 diabetics are
dead within 10 years of the onset of proteinuria.
KEY DIAGNOSTIC FEATURES
Although the diagnosis of nephropathy is based on the finding of Albustix
positive albuminuria (equivalent to a urinary albumin excretion rate of
more than 300mg/day), it is important to remember that the renal disease
is already well established at the stage of overt proteinuria with irreversible
structural changes having occurred in the glomeruli. In type 1 diabetes,
SECTION I • MICRO- AND MACROVASCULAR COMPLICATIONS OF DIABETES
24
Fig. 3.1 Relation between mean hemoglobin A
1
: values and the risk of
microalbuminuria in patients with IDDM. N Engl J Med 1995; 332: 1251–1255.
12
10
8
Odds ration
6
4
2
0
7 8 9 10 12
Hemoglobin A
1
(%)
14 16 18 20
CHAPTER 3 • DIABETIC NEPHROPATHY
patients over 12 years of age should be screened annually for microalbu-
minuria using the albumin/creatinine ratio (ACR) on the first morning
urine sample (Fig. 3.4). Type 2 patients should be routinely screened for
albuminuria and, if Albustix negative, annual screening undertaken for
microalbuminuria, particularly if a positive result would alter or intensify
their management.
Classically, the finding of Albustix positive proteinuria on more than two
occasions in a person with established diabetes (having first ruled out uri-
nary tract infection) is indicative of diabetic nephropathy. Hypertension is
25
Fig. 3.2 Natural history of diabetic nephropathy: Oxford Textbook of Medicine
3
rd
edn. Oxford University Press, 1996.
Normal
<20 μg/min
Stable
1% decline pa
>40 years
Stable: higher in
those progressing
to incipient
nephropathy
Large kidneys
Tubular hypertrophy/
hyperplasia
Glomerular
enlargement
Normal ultrastructure
GBM thickening
20 nm pa
Incipient
nephropathy
>20 <200 μg/min
(increase 20% pa)
Age related changes;
more rapid loss
when UAER
approaches 200 μg
/min or if
blood pressure
increases
Initially stable,
but higher
than normal
UAER controls
Increases with
increasing UAER
Kidneys remain
large GBM thickening
54 nm pa
Mesangial expansion
~ 4% pa
Clinical
nephropathy
<200 μg/min
Decline 10 ml/min/y
(hypertensive),
1–4 ml/min/y
(normotensive)
Most patients
hypertensive
(>140/85 mmHg)
Increases with
declining GFR
Kidneys shrink
GBM 2–3 times
normal, stable
Nodules
Global
glomerulosclerosis
Mesangial expansion
~ 7% pa
UAER
GFR
Blood
pressure
Pathology
1%–2%
per annum
3%–4%
per annum
pa = per anum; GBM = glomerular basement membrane
SECTION I • MICRO- AND MACROVASCULAR COMPLICATIONS OF DIABETES
26
commonly associated (Fig. 3.5) and the absence of retinopathy should
prompt consideration of an alternative diagnosis in a patient with type 1 dia-
betes. However, in type 2 diabetic patients only about 50% of those with
nephropathy have associated retinopathy.
Renal ultrasound can be helpful in excluding unrelated structural abnor-
malities such as hydronephrosis or polycystic kidneys, but asymetrical kid-
neys may be indicative of renal artery stenosis (RAS), especially in patients
with peripheral vascular or aortic aneurysm disease. If renal artery dopplers
are suggestive of RAS, arteriography or CT-angiography is justified but the
contrast media used for these investigations can precipitate renal failure.
Adequate hydration with intravenous saline is important, but early sugges-
tions that oral treatment with acetylcysteine reduced the incidence of con-
trast-induced renal complications has not been confirmed by subsequent
studies. Metformin should be stopped two days before the investigation
because of the small risk of lactic acidosis.
Haematuria is an unusual feature in diabetic nephropathy and these
patients may have co-existent renal disease unrelated to their diabetes. Renal
biopsy is rarely necessary but should be considered in these patients, since it
may occasionally reveal potentially treatable glomerular disease, e.g. IgA
nephropathy. The morphological changes seen in the diabetic kidney, e.g. dif-
fuse and nodular glomerulosclerosis and arteriolohyalinosis (Kimmelstiel-
Wilson kidney), which may be present in over 90% of kidneys after 10 years of
Fig. 3.3 Decline of renal function in 16 patients with nephropathy. ABC of Diabetes
1982; 285: 627–629.
5
4
3
2
1
0
01020
Months
30 40
1
Creatinine
x 10
3
CHAPTER 3 • DIABETIC NEPHROPATHY
27
Fig. 3.4 Screening strategy and monitoring programme for microalbuminuria in type
1 diabetes. St Vincent Joint Force for Diabetes Report of the Renal Disease Subgroup,
1994, 2
nd
edn.
First morning urine sample
Normal
No timed urine
Retest in 1 year
Retest to confirm
if still abnormal
Timed urine sample*
AER > 20 μg/min (30 mg/24 h)
Two other timed urine samples
within 6–12 weeks
AER ≥ 20 μg/min (30 mg/24 h)
in at least one sample
- Monitor as often as required
-Monitor HbA1
c
, blood pressure, lipids, creatinine
-Test for retinopathy, CHD, CVD, PVD, neuropathy
-Commence ACE-inhibitor
AER = albumin excretion rate CHD = coronary heart disease
CVD = cerebral vascular disease HBA1
c
= glycated haemoglobin
PVD = peripheral vascular disease
* If timed urine sample difficult to obtain, monitoring should continue with the
use of albumin/creatinine (A/C) ratio. No prospective study has however so far
evaluated the validity of A/C ratio as a monitoring index
AER < 20 μg/min
Albumin concentration <20 mg/l
and or
Albumin: creatinine
< 2.5 mg/mmol in men
< 3.5 mg/mmol in women
Albumin concentration ≥20 mg/l
and or
Albumin: creatinine
≥2.5 mg/mmol in men
≥ 3.5 mg/mmol in women
SECTION I • MICRO- AND MACROVASCULAR COMPLICATIONS OF DIABETES
28
type 1 diabetes, are not synonymous with diabetic nephropathy. Despite these
common histological changes, the clinical syndrome of nephropathy with pro-
teinuria and declining renal function only develops in about one-third of these
patients, indicating that there is a poor correlation between renal morphology
and function.
EVIDENCE-BASED PRACTICE
Early detection and identification of individuals at higher risk (such as those
with a family history of hypertension or a sibling with diabetes and nephropa-
thy) should be the aim. Many of the early changes of diabetic renal disease,
such as hyperfiltration and increasing albumin excretion, are readily
reversible with improved glycaemic control. The Diabetes Control and
Complications Trial (DCCT) showed a 39% reduction in the occurrence of
microalbuminuria and a 54% reduction in albuminuria in the intensive ther-
apy arm for both adults and adolescents with type 1 diabetes. Similarly, the
UK Prospective Diabetes Study (UKPDS) showed a slowing of renal decline
in the tight glycaemic control group with type 2 diabetes.
Tight control of hypertension is essential to reduce the decline in renal
function. Angiotensin-converting enzyme inhibitors (ACE-Is) are indicated
in type 1 patients with persistent microalbuminuria or proteinuria, irrespec-
Fig. 3.5 Cumulative incidence of hypertension and persistent proteinuria in type 1
diabetes: Handbook of Diabetes, 2
nd
edn. From Williams G & Pickup JC, Blackwell
Science, 1999.
Cumulative incidence (%)
60
50
Hypertension
Proteinuria
40
30
20
10
0
15 20
25 30 35 40
Age (years)
45 50 55
CHAPTER 3 • DIABETIC NEPHROPATHY
tive of initial blood pressure, but women of childbearing age must avoid preg-
nancy because of potential fetal toxicity. Renoprotection by ACE-Is is proba-
bly a class effect but evidence exists for the use of Captopril, Enalapril and
Lisinopril. The sulphydril group present in Captopril has antioxidant prop-
erties but whether this is advantageous in clinical practice is unproven. To
achieve a target BP of < 130/80 for patients with nephropathy may require
several antihypertensive agents and for young people under 16 years BP tar-
gets may be set even lower (to achieve a BP < 90
th
centile for age).
Type 2 patients with microalbuminuria or proteinuria are less likely to
progress to ESRF but as with type 1 diabetes (Fig. 3.6) BP management is the
mainstay of treatment (Fig. 3.7). The choice of antihypertensive drug is less
important than the achieved BP but ACE-Is confer some advantages if the
patient has established vascular disease, as shown in the diabetic sub-group of
the HOPE study (MICRO-HOPE) where Ramipril reduced mortality, rates of
29
Fig. 3.6 Effect of blood pressure control on progression of renal disease in 11
patients with type 1 diabetes. Parving H-H et al. BMJ 1987; 294: 1443–1447.
125
Start of antihypertensive treatment
ΔGFR=0.94
(ml/min/mo)
ΔGFR=0.29
(ml/min/mo)
ΔGFR=0.10
(ml/min/mo)
115
105
95
105
95
85
75
65
55
1250
750
250
Years
-2
6
-101 23456
Mean arterial
blood pressure
(mmHg)
Glomerular filtration
rate (ml/min/1.73m
2
)
Albuminuria
(mg/min)
SECTION I • MICRO- AND MACROVASCULAR COMPLICATIONS OF DIABETES
30
myocardial infarction and episodes of heart failure.
Angiotensin receptor antagonists (ARAs) achieve similar reductions in blood
pressure and proteinuria as ACE-Is but combination therapy with both agents
may produce superior falls in systolic and diastolic BP in comparison to either
agent alone in type 2 diabetics. As yet, there is none of the long-term data that
exists for ACE-Is, suggesting a specific renoprotective effect of ARAs over and
above their effect on blood pressure. Most of the studies have been short term
and placebo controlled and those that have compared ARAs with ACE-Is have
not shown superior outcomes with ARAs. Indeed, to date there have been only
three randomized double-blind studies lasting more than one year using ARAs
as an anti-hypertensive treatment for people with diabetes. None showed a sig-
nificant reduction in total or cardiovascular mortality. In the RENAAL study
there was a statistical reduction in progression to end-stage renal failure in those
that were treated with ARAs but the placebo group had higher BPs throughout
the study which may account for the worse outcomes. Until there are more con-
clusive studies with direct comparisons with ACE-Is, ARAs should be reserved
for patients intolerant of ACE-Is (e.g. cough). They have the same renal side-
effects as ACE-Is such as hyperkalaemia and must be avoided in RAS.
Diet adjustment has a place in the management of patients with nephropathy
prior to the need for renal replacement therapy, particularly with the aim of
reducing vascular risk. Thus, a diet low in fat, high in antioxidants and low in salt
(to reduce BP) must be balanced against potassium and phosphate intake where
Fig. 3.7 UK Prospective Diabetes Study Group (UKPDS): blood pressure control and
mortality from macrovascular disease and renal failure. BMJ 1998; 317: 703–713.
Patients with events (%)
40
30
20
10
0
012 4563
Years from randomization
Less tight control (n=390→161)
Tight control (n=758→325)
32% reduction in risk for
diabetes related mortality
P=0.019
789
CHAPTER 3 • DIABETIC NEPHROPATHY
the serum level may be elevated. Many people with diabetes mistakenly eat more
protein than the general population, so modest reductions may be beneficial,
though low protein diets for low GFR states are not well tolerated by many
patients, despite evidence for their effects in slowing the deterioration.
MONITORING RENAL FUNCTION
Serum creatinine is a poor indicator of renal function, rising only after
there has been a severe reduction in GFR (Fig. 3.8). EDTA clearance meas-
urements are impractical for routine tracking of renal function but can be
useful if 24-hour urinary creatinine clearance values are inconsistent with
the clinical picture. Otherwise, reciprocal-creatinine plots against time can
helpfully indicate the rate of decline of renal function in individual patients.
31
Fig. 3.8 Relationship between glomerular filtration rate (GFR) measured using
chromium-51 edetic acid (
51
Cr EDTA GFR) and serum creatinine, in patients being
investigated for renal disease. Values are means and ranges (unpublished data from
Roberts B, Gabriel R, 1975. BMJ 1986; 293: 1119–1120).
Serum creatinine (μmol/l)
400
600
800
1000
1200
1400
1600
200
0
0204060
GFR (
51
Cr EDTA)
80 100 120
SECTION I • MICRO- AND MACROVASCULAR COMPLICATIONS OF DIABETES
32
After starting ACE-Is or AII blockers, urea and electrolytes should be mon-
itored carefully (e.g. one week and one month after initiation) to detect
hyperkalaemia or a drug-induced deterioration in renal function (usually
associated with RAS).
Metformin should be avoided completely if serum creatinine is >130μmol/l
because of the potential but small risk of lactic acidosis. Occasional monitoring
of haemoglobin, corrected calcium and fasting phosphate is indicated.
Abnormal results should prompt further measurements of haematinics, espe-
cially ferritin, and indicators of bone metabolism such as alkaline phosphatase
and parathyroid hormone.
In general, increasing albuminuria is a sign of worsening nephropathy and a
reduction in albumin secretion as measured by albumin creatinine ratio (ACR),
correlates with beneficial effects on renal function. Spontaneous resolution of
microalbuminuria may occur, independent of ACE-I use, in type 1 diabetes.
Monitoring of microalbuminuria over time can be useful, and an increasing
ACR may be an indication for more aggressive antihypertensive therapy.
Arrangements for the involvement of a nephrologist in the care of a patient
with diabetic nephropathy will vary from country to country but studies in the
UK have suggested that many patients are never given the opportunity of
assessment by a renal physician, or else they are referred at the point of requir-
ing dialysis. The type of patient suitable for referral to a nephrologist might be:
• patients with a serum creatinine >
150μmol/l;
• type 1 diabetic patients with confirmed microalbuminuria
(AER>30μg/min);
• younger patients with overt diabetic nephropathy (dipstick positive protein-
uria) but a normal serum creatinine;
• patients with nephropathy and resistant hypertension;
• patients with asymmetrical kidneys on ultrasound or renal artery dopplers
suggestive of renal artery stenosis;
• patients with overt nephropathy but atypical features such as haematuria,
absence of retinopathy, or nephrotic levels of proteinuria (>3g/24hr).
Patients with diabetic nephropathy often become symptomatic at lower serum
creatinine levels than those who are non-diabetic and thus require dialysis earli-
er. Choosing between haemodialysis and peritoneal dialysis (CAPD) will depend
on a variety of factors including patient choice, but difficulties of vascular access
and problems such as coexisting autonomic neuropathy makes CAPD the pre-
ferred choice for the majority of patients. Visually impaired patients can manage
CAPD surprisingly well, but they may not detect their own foot ulcers.
Symptomatic autonomic neuropathy is far more common in patients with
diabetic nephropathy. Postural hypotension and impotence add to the con-
cerns of the patient but one of the most distressing symptoms is gustatory
sweating, which may be intolerable and is effectively untreatable.
CHAPTER 3 • DIABETIC NEPHROPATHY
Gastroparesis is fortunately rare. All of these patients will have other diabetic
complications such as retinopathy and ischaemic or neuropathic feet which
need regular inspection to detect and prevent deterioration. Anaemia may
respond to iron infusion but there is some evidence in patients without dia-
betes that erythropoietin (EPO) given pre-dialysis may slow the progression
of renal deterioration (Fig. 3.9).
33
Fig. 3.9 Reversal of anaemia by erythropoietin can retard progression of chronic
renal failure. Kuriyama S et al. Nephron 1997; 77: 176–185.
Cumulative renal survival rate (%)
80
100
60
40
20
0
0
5
10 20 3025 3515
Months of folllow-up
Group I (untreated anaemic, overall)
Group II (treated anaemic, overall)
Group III (untreated non-anaemic, overall)
40
P=0.3111P=0.0024
P=0.0003
CURRENT ISSUES
• Studies investigating the renoprotective effects of various classes of
drugs including thiazolidenediones, protein kinase C inhibitors and
vasopeptide inhibitors such as Omapatrilat are ongoing.
• Only careful attention to the cluster of vascular risk factors will begin to
reduce the high mortality from CHD in these patients. Coronary risk
prediction charts, e.g. those based on the Framingham data, will
probably underestimate the CHD risk and should not be used in this
population unless modified to adjust for proteinuria. There is good
evidence to suggest that patients with nephropathy should be treated as
for secondary prevention, i.e. assume they have established vascular
disease and treat them at lower thresholds with statins and aspirin (once
BP is controlled). There is also some evidence that statins may reduce
proteinuria and have ancillary anti-inflammatory effects in the kidney.
SECTION I • MICRO- AND MACROVASCULAR COMPLICATIONS OF DIABETES
34
FURTHER READING
Lewis EJ, Hunsicker LG, Bain RP, Rhode RD, for the Collaborative Study Group. The
effects of angiotensin-converting enzyme inhibition on diabetic nephropathy. N Engl J
Med 1993; 329: 1456–1462.
Mogensen CE and Cooper ME. Diabetic renal disease: from recent studies to improved
clinical practice. Diabetic Medicine 2004; 21: 4–17.
Siebenhofer A, Plank J, Horvath K, Berghold A, Sutton AJ, Sommer R & Pieber TR.
Angiotensin receptor blockers as anti-hypertensive treatment for patients with diabetes
mellitus: meta-analysis of controlled double-blind randomised trials. Diabetic Medicine
2004; 21: 18–25.
Viberti GC, Jarrett RJ, Mahmud U, Hill RD, Argyropoulos A, Keen H. Microalbuminuria as
a predictor of clinical nephropathy in insulin-dependent diabetes mellitus. Lancet 1982;
i: 1430–1432.
CHAPTER 4
CORONARY HEART DISEASE AND DIABETES
Adrian R. Scott MD, FRCP
35
INTRODUCTION
Traditionally diabetic vascular complications are divided into microvascular and
macrovascular. The uniqueness of diabetic retinopathy, and to a lesser extent
nephropathy, has led to microvascular disease sometimes overshadowing the
more common and life-threatening coronary and cerebrovascular events. The
fascination of doctors with unusual patterns of small vessel disease has meant
that for many decades the true impact of vascular disease in people with diabetes
has received less attention than it deserves. Both types of diabetes are associated
with a many-fold increase in the risk of macrovascular disease, particularly coro-
nary heart disease (CHD), stroke (CVA) and peripheral vascular disease (PVD)
leading to gangrene and lower limb amputation. In type 1 diabetes this is strong-
ly associated with nephropathy but many would now consider type 2 diabetes as
a cardiovascular disease per se since hyperglycaemia is only one element of a syn-
drome characterized by insulin resistance, central obesity, hypertension and
hyperlipidaemia, all of which contribute to atherogenesis.
EPIDEMIOLOGY OF CHD IN DIABETES
In type 1 diabetes the risk of a vascular event increases with duration of dia-
betes and the presence of nephropathy. Many older studies failed to distin-
guish between the two major types of diabetes but the recent British Diabetic
Association (BDA) cohort study followed insulin-treated patients diagnosed
before the age of 30 years, and found an excess of deaths at all ages. Vascular
disease was implicated from the third decade onwards (Fig. 4.1). With type 2
diabetes the increased risk of CHD is present from diagnosis and one cohort
study found a history of MI in 16.5% of males and 9.7% of females at the time
of diagnosis of diabetes. During a 10-year follow-up the age-adjusted inci-
dence of first MI was 1.5-fold higher in diabetic men and up to 8.1-fold high-
er in diabetic women compared to age-matched non-diabetics. In the
Framingham study, 3,000 non-diabetic women were followed for 24 years
and no episode of MI prior to the menopause was documented. In diabetic
women before the menopause, however, the morbidity and mortality from
atherosclerotic events was equal to or greater than diabetic men.
These differences in atherosclerosis between diabetics and non-diabetics are
common across the world but significant differences also exist in the incidence
of CHD events in diabetics from one country to another. This suggests that the
risk of CHD can be modified and that environmental factors probably have a
role. For example, a Central American with diabetes has less coronary athero-
sclerosis than a North American without diabetes. The incidence of CHD and
Vascular Complications of Diabetes: Current Issues in Pathogenesis and Treatment, Second Edition
Edited by Richard Donnelly, Edward Horton
Copyright © 2005 by Blackwell Publishing Ltd
SECTION I • MICRO- AND MACROVASCULAR COMPLICATIONS OF DIABETES
36
PVD in the Japanese is very low and this is usually attributed to a diet high in
carbohydrate, rich in fish and low in fat. Macrovascular complications among
Japanese diabetics is one fifth as common as among Caucasian diabetics.
Hawaiian Japanese diabetics, however, have an equivalent cardiovascular mor-
tality to Caucasian diabetics, suggesting that these differences are modifiable.
AETIOLOGY
Genetics and environment contribute to the cluster of (CHD) risk factors
associated with diabetes but fetal nutrition would also appear to have a
role. This is suggested by small-for-dates babies who are more likely to
have CHD and/or type 2 diabetes in middle-age than normal birth weight
babies, particularly if they also become obese (so exacerbating the hyper-
insulinaemia/insulin resistance). CHD in people with diabetes is associat-
ed with the usual risk factors such as hypertension, smoking, obesity, ele-
vated LDL-cholesterol, low HDL-cholesterol and renal disease, many of
which are more common than amongst non-diabetics. The interactions
are complex, however, and the Multiple Risk Factor Intervention Trial
(MRFIT) study which followed over 300,000 men for seven years found
that hypertension and hyperlipidaemia had a greater impact in the diabet-
ic subgroup (Fig. 4.2). Diabetic men with a cholesterol of >7.3 mmol/l were
nearly six times as likely to develop CHD over the period of follow-up than
diabetic men with a cholesterol of <5.5mmol/l. Thirty percent of smokers
Fig. 4.1 BDA Cohort Study (1972-1993): Cardiovascular disease mortality rates in
insulin-treated diabetes diagnosed under age 30. Laing SP et al. Diabetic Medicine
1999; 16: 466–471.
Male cohort
Female cohort
Male general population
Female general population
Mortality per 100
000 per year
(log scale)
10000
1000
100
10
1
0
10–14
15–19
20–24
25–29
35–39
30–34
40–44
45–49
55–59
65–69
50–54
60–64
Age (years)
CHAPTER 4 • CORONARY HEART DISEASE AND DIABETES
were dead at the end of the 7-year period.
Diabetics also have metabolic abnormalities which encourage thrombosis
and discourage fibrinolysis. Thus fibrinogen, von Willebrand factor, plas-
minogen activator inhibitor-1 (PAI-1) and plasma viscosity are all elevated
and platelet function is abnormal.
PROGNOSIS
In-hospital and one-year mortality has been shown to be two and fourfold
greater amongst people with diabetes, especially women. All-cause mortali-
ty in men and women aged 61–75 years admitted to hospital with an acute MI
in Southern Derbyshire, UK, confirmed this pattern, with the largest num-
ber of deaths occurring within the first month (Fig. 4.3). The reasons for this
are not clear but sudden death, heart failure and reinfarction are all more
common in diabetic patients following MI. There is no evidence that infarct
size is greater but underlying coronary artery atherosclerosis is more severe
and there is some evidence of a cardiomyopathy associated with diabetes
which could predispose to a worse outcome post-MI. A raised admission
blood glucose in patients with acute coronary syndrome is predictive of both
in-patient and long-term mortality. A meta-analysis of 15 previous studies
37
Fig. 4.2 Multiple Risk Factor Intervention Trial: Effects of systolic blood pressure (a)
and serum cholesterol concentration (b) on 10-year mortality from coronary heart
disease (CHD) in 342,815 non-diabetic and 5,163 diabetic subjects aged 35–57 years
who initially had not suffered a myocardial infarction. From Williams G & Pickup JC,
Textbook of Diabetes 1999 2nd edn, Blackwell Science.
80
60
40
20
10
0
110 120 130 140 150 160
80
60
40
20
10
0
Systolic blood pressure (mmHg)
4 567
Serum cholesterol (mmol/l)
Ten-year CHD mortality (per 1000)
Diabetic
Non-diabetic
(a) (b)
SECTION I • MICRO- AND MACROVASCULAR COMPLICATIONS OF DIABETES
38
reported that for people without diabetes an admission BG of >6mmol/l
increased hospital mortality nearly fourfold. For people with diabetes, an
admission BG of >10mmol/l increased mortality 1.7 times compared to peo-
ple with diabetes with BG of <10 mmol/l. In a prospective study of admission
BG in 336 patients with AMI (12% known DM), 1 year mortality was 19.3% if
admission BG was <5.6 rising to 44% if BG was >11mmol/l.
ASSESSING VASCULAR RISK IN PEOPLE WITH DIABETES
Stratification of risk is helpful in prioritizing care. This ensures that those
with the highest risk are treated with some urgency; resources are targeted
according to need; and low risk individuals are not put at unnecessary disad-
vantage from long-term potential drug side-effects. All coronary risk predic-
tion charts are based on the same Framingham data which takes into account
age, gender, smoking and diabetes status, systolic blood pressure, and total
cholesterol/HDL ratio. The presence or absence of left ventricular hypertro-
phy (LVH) and adjustment for microalbuminuria status can be included in
the Framingham equations and results in an estimate of risk of a cardiovas-
cular event (fatal or non-fatal) over a 10-year period. They are for primary
prevention only, with patients categorized as high risk predicted to have over
a 30% chance of an event over 10 years. To put this in context, a person with
established vascular disease has a more than 40% risk over 10 years.
The original Framingham cohort was largely white and contained only a
relatively small number of patients with diabetes. Thus, coronary risk predic-
tion charts should be used with caution as they will tend to under-estimate
Fig. 4.3 Mortality rates in men and women with and without diabetes aged 61-75
years in Southern Derbyshire between 1995 and 1998 (unpublished data).
Cumulative mortality (%)
50
40
30
20
10
0
10 day 30 day 3 mth
After MI
6 mth
Women with DM
Men with DM
Women with no DM
Men with no DM
12 mth
CHAPTER 4 • CORONARY HEART DISEASE AND DIABETES
CHD risk in some groups, e.g. British Asians, New Zealand Maori, patients
with nephropathy and where there is a family history of premature vascular
disease suggestive of a primary hyperlipidaemia.
Haffner and colleagues published evidence that the risk of death in patients
with type 2 diabetes (but no prior MI) was similar to that of a non-diabetic
with a past history of MI (Fig. 4.4). This suggests that, in terms of secondary
prevention, patients with diabetes could be considered as having the same risk
of an event as someone with established vascular disease. Despite such a high
risk, screening for asymptomatic CHD remains controversial. A positive exer-
cise test in this group has a low predictive value for significant CHD on
angiography. The high prevalence of hypertension (and therefore increased
left ventricular mass) can give abnormal ST-segment responses to exercise as
well as false positive nuclear myocardial perfusion scanning.
EVIDENCE BASED PRACTICE
The acute management of ST-segment elevation MI (STEMI) in a patient with
diabetes is exactly the same as for a person without diabetes, except that all
those with diabetics (and patients with unknown diabetes status but an admis-
sion serum glucose > 11 mmol/l) should receive a glucose and insulin infusion
(so-called DIGAMI regimen) to maintain BG within the normal range for at
least 24 hours. In the original Swedish DIGAMI studies using this i.v. regimen,
patients were subsequently treated with a basal-bolus subcutaneous insulin
39
Fig. 4.4 Probability of death in 1,059 subjects with type 2 diabetes and 1,378
non-diabetic subjects with and without prior MI. Haffner S et al. N Engl J Med 1998;
339: 229–34.
Survival (%)
100
90
80
70
60
50
40
01 23 4 5 6 78
Years
Non-DM without MI
DM without MI
Non-DM with MI
DM with MI
SECTION I • MICRO- AND MACROVASCULAR COMPLICATIONS OF DIABETES
40
regimen for at least three months and this was associated with a 29% reduc-
tion in mortality. The group which appeared to benefit most were the lower
risk, younger patients on diet alone prior to the MI. Current evidence cannot
distinguish between the benefits of early glucose and insulin i.v. infusion ver-
sus the benefits attributable to post-discharge subcutaneous insulin therapy in
accounting for the overall reduction in mortality. DIGAMI2 has attempted to
unravel the benefits of the individual components and although complete, the
results have not yet been published.
Effective interventions frequently show greatest benefits in the higher-risk
patients and thrombolysis, beta-blockers and statins all demonstrate signifi-
cantly larger absolute reductions in morbidity and mortality in the diabetic
subgroups. Following STEMI treated with reperfusion therapy, there was an
increased risk of adverse outcomes in patients with diabetes but they still
appeared to derive a greater absolute benefit. The Fibrinolytic Therapy Trialists
Group demonstrated that the use of fibrinolyic therapy saved 37 lives per 1,000
patients with diabetes, compared with 15 lives per 1,000 patients without dia-
betes. In trials studying the addition of GPIIb/IIIa inhibitors in patients with
STEMI treated by thrombolysis, people with diabetes experienced a marked
increase in bleeding rates which outweighed the small reduction in the com-
posite end-points of death or reinfarction. Primary percutaneous transluminal
angioplasty (PTCA) has been shown to improve outcomes among patients with
STEMI when compared with fibrinolytic therapy. Patients with diabetes also
benefit and do even better with primary stenting plus GPIIb/IIIa inhibition.
Meta-analyses of beta-blocker trials show a 35% reduction in mortality
when given at the time of the MI (orally or intravenously) in diabetics com-
pared to a 13% reduction in non-diabetics. When given as secondary preven-
tion post-MI, the corresponding results are –48% and –33% respectively.
A similar pattern was seen with statins post-MI, e.g. in the Cholesterol And
Recurrent Events (CARE) study using Pravastatin 40mg and in the
Scandanavian Simvastatin Survival Study (4S) which used 20–40mg simvas-
tatin (Fig. 4.5). Reductions in mortality were greater in the diabetic subgroups,
as were the reductions in duration and number of hospital admissions in the
statin treated group.
Angiotensin-converting enzyme inhibitors (ACE-Is) given post-MI
reduce mortality by 22% in patients with a left ventricular ejection fraction
of <40%. The Studies Of Left Ventricular Dysfunction (SOLVD) demon-
strated similar benefits in diabetics. The metanalysis performed by the ACE-
Inhibitor Myocardial Infarction collaborative group of ACE-I therapy start-
ed on the day of MI and continued for 4–6 weeks showed that five deaths
were prevented per 1,000 treated patients and there was a reduced risk of
heart failure. This analysis included the CONSENSUS II trial which found a