ASM Metals Handbook - Desk Edition (ASM_ 1998) WW part 13 docx
Bạn đang xem bản rút gọn của tài liệu. Xem và tải ngay bản đầy đủ của tài liệu tại đây (1.92 MB, 170 trang )
Eddy-current inspection is extremely versatile, which is both an advantage and a disadvantage. The advantage is that the
method can be applied to many inspection problems provided that the physical requirements of the material are
compatible with the inspection method. However, in many applications, the sensitivity of the method to many inherent
material properties and characteristics can be a disadvantage. Some variables in a material that are not important in terms
of material or part serviceability can cause instrument signals that mask critical variables or are mistakenly interpreted to
be caused by critical variables.
Eddy-Current vs. Magnetic Inspection Methods. In eddy-current inspection, eddy currents create their own
electromagnetic field, which is sensed either through the effects of the field on the primary exciting coil or by means of an
independent sensor. In nonferromagnetic materials, the secondary electromagnetic field is derived exclusively from eddy
currents. However, with ferromagnetic materials, additional magnetic effects occur that usually are of sufficient
magnitude to overshadow the basic eddy-current effects from electrical conductivity only. These magnetic effects result
from the magnetic permeability of the material being inspected, and can be virtually eliminated by magnetizing the
material to saturation in a static (direct-current) magnetic field. When the permeability effect is not eliminated, the
inspection method is more correctly categorized as electromagnetic or magnetoinductive inspection.
Principles of Operation
Functions of a Basic System. The part to be inspected is placed within or adjacent to an electrical coil in which an
alternating current is flowing. As shown in Fig. 1, the alternating current, called the exciting current, causes eddy currents
to flow in the part as a result of electromagnetic induction. These currents flow within closed loops in the part, and their
magnitude and timing (or phase) depend on (a) the original or primary field established by the exciting currents, (b) the
electrical properties of the part, and (c) the electromagnetic fields established by currents flowing within the part.
Fig. 1 Two common types of inspection coils and the patterns of eddy-
current flow generated by the exciting
current in the coils. Solenoid-type coil is applied to cylindrical or tubular parts; pancake-
type coil, to a flat
surface. (a) Solenoid-type coil. (b) Pancake-type coil
The electromagnetic field in the region in the part and surrounding the part depends on both the exciting current from the
coil and the eddy currents flowing in the part. The flow of eddy currents in the part depends on the electrical
characteristics of the part, the presence or absence of flaws and other discontinuities in the part, and the total
electromagnetic field within the part.
The change in flow of eddy currents caused by the presence of a crack in a pipe is shown in Fig. 2. The pipe travels along
the length of the inspection coil, as shown. In section A-A in Fig. 2, no crack is present and the eddy-current flow is
symmetrical. In section B-B, where a crack is present, the eddy-current flow is impeded and changed in direction, causing
significant changes in the associated electromagnetic field. The condition of the part can be monitored by observing the
effect of the resulting field on the electrical characteristics of the exciting coil, such as its electrical impedance, induced
voltage, and induced currents. Alternatively, the effect of the electromagnetic field can be monitored by observing the
induced voltage in one or more other coils placed within the field near the part being monitored.
Fig. 2 Effect of a crack on the pattern of eddy-current flow in a pipe
Each and all of these changes can have an effect on the exciting coil and other coil or coils used to sense the
electromagnetic field adjacent to a part. The effects most often used to monitor the condition of the part being inspected
are the electrical impedance of the coil and the induced voltage of either the exciting coil or other adjacent coil or coils.
Eddy-current systems vary in complexity depending on individual inspection requirements. However, most systems must
provide for the following functions:
• Excitation of the inspection coil with one or more frequencies
• Modulation of the inspection-coil output signal by the part being inspected
• Processing of the inspection-coil signal prior to amplification
• Amplification of the inspection-coil signals
• Detection or demodulation of the inspection-
coil signal, usually accompanied by some analysis or
discrimination of signals, which can be performed by a computer
• Display of signals on an instrument such as a meter, an oscilloscope, an oscillograph, and a strip-
chart
recorder; or recording of signals on paper punch tape and magnetic tape
• Handling of the part being inspected and support of inspection-coil assembly
Elements of a typical inspection system are shown schematically in Fig. 3. The particular elements in Fig. 3 are
for a system developed to inspect bar or tubing. The generator supplies excitation current to the inspection coil and a
synchronizing signal to the phase shifter, which provides switching signals for the detector. The loading of the inspection
coil by the part being inspected modulates the electromagnetic field of the coil. This causes changes in the amplitude and
phase of the inspection-coil voltage output.
Fig. 3 Principal elements of a typical system for eddy current inspection of bar or tubing.
See description in
text.
The output of the inspection coil is fed to the amplifier and detected or demodulated by the detector. The demodulated
output signal, after some further filtering and analyzing, is then displayed on an oscilloscope or a chart recorder. The
displayed signals, having been detected or demodulated, vary at a much slower rate, depending on (a) the rate of changing
the inspection probe from one part being inspected to another, (b) the speed at which the part is fed through an inspection
coil, or (c) the speed with which the inspection coil is caused to scan past the part being inspected.
Operating Variables
The principal operating variables encountered in eddy-current inspection include coil impedance, electrical conductivity,
magnetic permeability, lift-off and fill factors, edge effect, and skin effect.
Coil Impedance
When direct current flows in a coil, the magnetic field reaches a constant level and the electrical resistance of the wire is
the only limitation to the flow of current. However, when alternating current flows in a coil, two limitations are imposed:
the alternating-current resistance of the wire and a quantity known as inductive reactance (X
L
).
Impedance usually is plotted on an impedance-plane diagram. In such a diagram, resistance is plotted along one axis and
inductive reactance (or inductance) along the other axis. Because each specific condition in the material being inspected
can result in a specific coil impedance, each condition corresponds to a particular point on the impedance-plane diagram.
For example, if a coil is placed sequentially on a series of thick pieces of metal, each having a different resistivity, each
piece causes a different coil impedance and corresponds to a different point on a locus in the impedance plane. The curve
generated might resemble that shown in Fig. 4, which is based on International Annealed Copper Standard (IACS)
conductivity ratings. Other curves are generated for other material variables, such as section thickness and types of
surface flaws.
Fig. 4 Typical impedance-plane diagram derived by placing an i
nspection coil sequentially on a series of thick
pieces of metal, each with a different International Annealed Copper Standard (IACS) electrical resistance or
conductivity rating. The inspection frequency is 100 kHz.
By use of more than one test frequency, the impedance planes can be manipulated to accept a desirable variable (in flaws)
and reduce the effects of undesirable variables that is, lift-off and/or dimensional effects (see Fig. 3).
Electrical Conductivity
All materials have a characteristic resistance to the flow of electricity. Those with the highest resistivity are classified as
insulators; those having intermediate resistivity are classified as semiconductors; and those having low resistivity are
classified as conductors. Conductors, which include most metals, are of greatest interest in eddy-current inspection. The
relative conductivities of common metals and alloys vary over a wide range.
Capacity to conduct current is measured in terms of either conductivity or resistivity. In eddy-current inspection,
measurement often is based on IACS. In this system, the conductivity of annealed, unalloyed copper is arbitrarily rated at
100%, and the conductivities of other metals and alloys are expressed as percentages of this standard. Thus, the
conductivity of unalloyed aluminum is rated 61% IACS, or 61% that of unalloyed copper. Table 1 gives the resistivities
and IACS conductivity ratings of several common metals and alloys.
Table 1 Electrical resistivity and conductivity of several common metals and alloys
Metal or alloy Resistivity
· mm
Conductivity,
%IACS
Silver
16.3 105
Copper, annealed
17.2 100
Gold
24.4 70
Aluminum
28.2 61
Aluminum alloys
6061-T6
41 42
7075-T6
53 32
2024-T4
52 30
Magnesium
46 37
70-30 brass
62 28
Phosphor bronzes
160 11
Monel
482 3.6
Zirconium
500 3.4
Zircaloy-2
720 2.4
Titanium
548 3.1
Ti-6Al-4V alloy
1720 1.0
Type 304 stainless steel
700 2.5
Inconel 600
980 1.7
Hastelloy X
1150 1.5
Waspaloy
1230 1.4
Magnetic Permeability
Ferromagnetic metals and alloys, including iron, nickel, cobalt, and some of their alloys, concentrate the flux of a
magnetic field. They are strongly attracted to a magnet and an electromagnet, have exceedingly high and variable
susceptibilities, and have very high and variable permeabilities.
Magnetic permeability is not a constant for a given material, but depends on the strength of the magnetic field acting on it.
For example, consider a sample of steel that has been completely demagnetized and then placed in a solenoid coil. As
current in the coil is increased, the magnetic field associated with the current increases. However, the magnetic flux
within the steel increases rapidly at first and then levels off so that an additionally large increase in the strength of the
magnetic field results in only a small increase in flux within the steel. The steel sample achieves a condition known as
magnetic saturation.
The curve showing the relation between magnetic-field intensity and the magnetic flux within the steel is known as a
magnetization curve. Magnetization curves for annealed commercially pure iron and nickel are shown in Fig. 5. The
magnetic permeability of a material is the ratio between the strength of the magnetic field and the amount of magnetic
flux within the material. As shown in Fig. 5, at saturation (where there is no appreciable change in induced flux in the
material for a change in field strength) the permeability is nearly constant for small changes in field strength.
Fig. 5 Magnetization curves for annealed commercially pure iron and nickel
Magnetic permeability of the material being inspected strongly influences the eddy-current response. Consequently, the
techniques and conditions used for inspecting magnetic materials differ from those used to inspect nonmagnetic materials.
"Lift-Off" Factor
When a probe inspection coil, attached to a suitable inspection instrument, is energized in air, it produces an indication
even if there is no conductive material in the vicinity of the coil. The initial indication starts to change as the coil is
moved closer to a conductor. Because the field of the coil is strongest close to the coil, the indicated change on the
instrument continues to increase until the coil is directly on the conductor. These changes in indication with changes in
spacing between the coil and the conductor, or part being inspected, are called "lift off." The lift-off effect is so
pronounced that small variations in spacing can mask many indications resulting from the condition or conditions of
primary interest. Consequently, it usually is necessary to maintain a constant relationship between the size and shape of
the coil and the size and shape of the part being inspected.
The change of coil impedance with lift-off can be derived from the impedance-plane diagram shown in Fig. 6. When the
coil is suspended in air away from the conductor, impedance is at a point at the upper end of the curve at far left in Fig. 6.
As the coil approaches the conductor, the impedance moves in the direction indicated by the dashed lines until the coil is
in contact with the conductor. When contact occurs, the impedance is at a point corresponding to the impedance of the
part being inspected, which in this instance, represents its conductivity. The fact that the lift-off curves approach the
conductivity curve at an angle can be used in some instruments to separate lift-off signals from those resulting from
variations in conductivity or some other parameter of interest.
Fig. 6 Impedance-plane diagram showing curves for electrical conductivity and lift off.
Inspection frequency is
100 kHz.
Although lift off can be troublesome in many applications, it can be also be useful. For example, using the lift-off effect,
eddy current instruments are excellent for measuring the thickness of nonconductive coatings, such as paint and anodized
coatings, on metals.
Fill Factor
In an encircling coil, a condition comparable to lift-off is known as "fill factor." It is a measure of how well the part being
inspected fills the coil. As with lift off, changes in fill factor resulting from factors such as variations in outside diameter
must be controlled because small changes can produce large indications. The lift-off curves shown in Fig. 6 are very
similar to those for changes in fill factor. For a given lift-off or fill factor, the conductivity curve shifts to a new position,
as indicated in Fig. 6. Fill factor can sometimes be used as a rapid method to check variations in outside-diameter
measurements in rods and bars.
Edge Effect
When an inspection coil approaches the end or edge of a part being inspected, eddy currents are distorted because they are
unable to flow beyond the edge of a part. The distortion of eddy currents results in an indication known as "edge effect."
Because the magnitude of the effect is very large, it limits inspection near edges. Unlike lift-off, little can be done to
eliminate edge effect. A reduction in coil size lowers the effect somewhat, but there are practical limits that dictate the
sizes of coils for given applications. In general, it is not advisable to inspect any closer than 3.2 mm ( in.) from the edge
of a part.
One alternative for inspection near an edge with minimal edge effect is to scan in a line parallel to the edge. Inspection
can be carried out by maintaining a constant probe-to-edge relationship, but each new scan-line position requires
adjustment of the instrument. Fixturing of the probe is recommended.
Skin Effect
Eddy currents are not uniformly distributed throughout a part being inspected; rather, they are densest at the surface
immediately beneath the coil and become progressively less dense with increasing distance below the surface. The
concentration of eddy currents at the surface of a part is known as "skin effect." At some distance below the surface of a
thick part, there essentially are no currents flowing. The depth of eddy-current penetration should be considered for
thickness measurements and for detection of subsurface flaws.
Figure 7 shows how the eddy current varies as a function of depth below the surface. The depth at which the density of
the eddy current is reduced to about 37% of the density at the surface is defined as the standard depth of penetration. This
depth depends on the electrical conductivity and magnetic permeability of the material and on the frequency of the
magnetizing current. Depth of penetration decreases with increases in conductivity, permeability, and inspection
frequency. The standard depth of penetration can be calculated from the equation:
S = 1980
where S is standard depth of penetration, in inches; is resistivity, in ohm-centimeters; is magnetic permeability (1 for
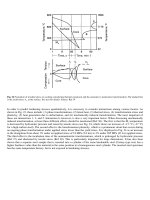
nonmagnetic materials); and f is inspection frequency, in hertz. Figure 8 shows the standard depth of penetration, as a
function of inspection frequency, for several metals of various electrical conductivities.
Fig. 7
Variation in density of eddy current as a function of depth below the surface of a conductor, known as
skin effect
Fig. 8 Standard depths of penetration as a function of frequencies used in eddy-
current inspection for several
metals of various electrical conductivities
Inspection Frequencies
The inspection frequencies used in eddy-current inspection range from about 60 Hz to 6 MHz. Most inspection of
nonmagnetic materials is performed at a few kilohertz. In general, lower frequencies are used to inspect magnetic
materials. However, the actual frequency used in any specific eddy-current inspection depends on the thickness of the
material being inspected, the required depth of penetration, the degree of sensitivity or resolution required, and the
purpose of the inspection.
Selection of inspection frequency normally is a compromise. For example, penetration should be sufficient to reach
subsurface flaws that must be detected, and to determine material condition (such as case hardness). Although penetration
is greater at lower frequencies, it does not follow that the lowest possible frequency should be used. Unfortunately, as the
frequency is lowered, the sensitivity to flaws decreases somewhat and the speed of inspection could be reduced.
Typically, the highest possible inspection frequency that still is compatible with the penetration depth required is selected.
The choice is relatively simple when only surface flaws must be detected, in which case frequencies up to several
megahertz can be used. However, when flaws at some considerable depth below the surface must be detected, or when
flaw depth and size must be determined, low frequencies must be used at the expense of sensitivity.
In inspection of ferromagnetic materials, relatively low frequencies typically are used because of the low penetration in
these materials. Higher frequencies can be used when it is necessary to inspect for surface conditions only. However, even
the higher frequencies used in these applications still are considerably lower than those used to inspect nonmagnetic
materials for similar conditions.
Inspection Coils
The inspection coil is an essential part of every eddy-current inspection system. The shape of the inspection coil depends
to a considerable extent on the purpose of the inspection and on the shape of the part being inspected. In inspection for
flaws, such as cracks and seams, it is essential that the flow of the eddy currents be as nearly perpendicular to the flaws as
possible to obtain a maximum response from the flaws. If the eddy-current flow is parallel to flaws, there is little or no
distortion of the currents, and, therefore, very little reaction on the inspection coil.
Probe and Encircling Coils. Of the almost infinite variety of coils used in eddy-current inspection, probe coils and
encircling coils are the most common. A probe-type coil typically is used to inspect a flat surface for cracks at an angle to
the surface because this type of coil induces currents that flow parallel to the surface, and therefore across a crack as
shown in Fig. 9(a). Conversely, a probe-type coil is not suitable to detect a laminar type of flaw. For such a discontinuity,
a U-shape, or horseshoe-shaped coil such as the coil shown in Fig. 9(b) is satisfactory.
Fig. 9 Types and applications of coils used in eddy-current inspection. (a) Probe-
type coil applied to a flat plate
for crack detection. (b) Horseshoe-shape, or U-shape, coil applied to a flat plate for laminar-
flaw detection. (c)
Encircling coil applied to a tube. (d) Internal, or bobbin-type, coil applied to a tube
To inspect tubing and bar, an encircling coil (Fig. 9c) generally is used because of complementary configuration and
because of the testing speeds that can be achieved. However, an encircling coil is sensitive only to discontinuities that are
parallel to the axis of the tube and bar. The coil is satisfactory for this particular application because most discontinuities
in tubing and bar are parallel to the major axis as a result of the manufacturing process. If it is necessary to locate
discontinuities that are not parallel to the axis, a probe coil must be used, and either the coil or the part must be rotated
during scanning. To detect discontinuities on the inside surface of a tube, an internal, or bobbin-type, coil (Fig. 9d) can be
used. An alternative is to use an encircling coil with a depth of penetration sufficient to detect flaws on the inside surface.
The bobbin-type coil, similar to the encircling coil, is sensitive to discontinuities that are parallel to the axis of the tube or
bar.
Multiple Coils. In many eddy-current inspection setups, two coils are used. The two coils typically are connected in a
series-opposing arrangement so there is no output from the pair when their impedances are the same. Pairs of coils can be
used in either an absolute or a differential arrangement (see Fig. 10). In the absolute arrangement (Fig. 10a), a sample of
acceptable material is placed in one coil, and the other coil is used for inspection. In this manner, the coils compare an
unknown against a standard, the differences between the two (if any) are indicated by a suitable instrument. Arrangements
of this type commonly are used in sort applications. Fixtures are used to maintain a constant geometrical relationship
between coil and part.
Fig. 10 Absolute and differential arrangements of multiple coils used in eddy-current inspection.
(a) Absolute
coil arrangement. (b) Differential coil arrangement
An absolute coil arrangement is not a good method in many applications. For example to inspect tubing, an absolute
arrangement indicates dimensional variations in both outside diameter and wall thickness even though such variations can
be well within allowable limits. To avoid this problem, a differential coil arrangement such as that shown in Fig. 10(b)
can be used. Here, the two coils compare one section of the tube with an adjacent section. When the two sections are the
same, there is no output from the pair of coils and no indication on the eddy-current instrument. Gradual dimensional
variations within the tube or gross variations between individual tubes are not indicated, whereas discontinuities which
normally occur abruptly are very apparent. In this way, it is possible to have an inspection system that is sensitive to
flaws and relatively insensitive to changes that normally are not of interest.
Sizes and Shapes. Inspection coils are made in a variety of sizes and shapes. Selection of a coil for a particular
application depends on the type of discontinuity. For example, when an encircling coil is used to inspect tubing and bar
for short discontinuities, best resolution is obtained with a short coil. On the other hand, a short coil has the disadvantage
of being sensitive to the position of the part in the coil. Longer coils are not as sensitive to position of the part, but are not
as effective in detecting very small discontinuities. Small-diameter probe coils have greater resolution than larger ones but
are more difficult to manipulate and are more sensitive to lift-off variations.
Eddy-Current Instruments
A simple eddy-current instrument, in which the voltage across an inspection coil is monitored, is shown in Fig. 11(a).
This circuit is adequate to measure large lift-off variations, if accuracy is not of great importance. A circuit designed for
greater accuracy is shown in Fig. 11(b). This instrument consists of a signal source, an impedance bridge with dropping
resistors, an inspection coil in one leg, and a balancing impedance in the other leg. The differences in voltage between the
two legs of the bridge are measured by an alternating-current voltmeter. Alternatively, the balancing impedance in the leg
opposite the inspection coil can be a coil identical to the inspection coil, as shown in Fig. 11(c), or it can have a reference
sample in the coil, as shown in Fig. 11(d). In the latter, if all the other components in the bridge are identical, a signal
occurs only when the inspection-coil impedance deviates from that of the reference sample.
Fig. 11 Four types of eddy-
current instruments. (a) A simple arrangement, in which voltage across the coil is
monitored. (b) Typical impedance bridge. (c) Impedance bridge with dual coils. (d) Impedance bridge with dual
coils and a reference sample in the second coil
There are other methods to achieve bridge balance, such as varying the values of resistance of the resistor in the upper leg
of the bridge and one in series with the balancing impedance. The most accurate bridges can measure absolute impedance
to within 0.01%. However, in eddy-current inspection, it is not how an impedance bridge is balanced that is important, but
rather how it is unbalanced by the effects of a flaw.
Another type of bridge system is an induction bridge, in which the power signal is transformer coupled into an inspection
coil and a reference coil. In addition, the entire inductance-balance system is placed in the probe, as shown in Fig. 12. The
probe consists of a large transmitter (or driver) coil and two small detector (or pickup) coils wound in opposite directions
as mirror images of each other. An alternating current is supplied to the large transmitter coil to generate a magnetic field.
If the transmitter coil is not in the vicinity of a conductor, the two detector coils detect the same field, and the net signal is
zero because they are wound in opposition to each other. However, if one end of the probe is placed near a metal surface,
the field is different at the two ends of the probe, and a net voltage appears across the two coils. The resultant field is the
sum of a transmitted signal, which is present all the time, and a reflected signal due to the presence of a conductor (the
metal surface). This coil arrangement can be used both as a probe and as an encircling coil (see Fig. 12).
Fig. 12 Induction-
bridge probe in place at the surface of a workpiece. Schematic shows how power signal is
transformer coupled from a transmitter coil into two detector coils
an inspection coil (at bottom) and a
reference coil (at top).
Readout Instrumentation. An important part of an eddy-current inspection system is the instrument used for a
readout. The readout device can be an integral part of the system, an interchangeable plug-in module, and a solitary unit
connected by cable. The readout instrument should be of adequate speed, accuracy, and range to meet the inspection
requirements of the system. Frequently, several readout devices are used in a single inspection system. A list of more
common types of readout, in order of increasing cost and complexity, follows:
• Alarm lights alert the operator that a test-parameter limit has been exceeded.
•
Sound alarms serve the same purpose as alarm lights but free the attention of the operator to allow
manipulating the probe in manual scanning.
• Kick-
out relays activate a mechanism that automatically rejects and marks a part when a test parameter
is exceeded.
•
Analog meters give a continuous reading over an extended range. They are fairly rapid (with a
frequency of about 1 Hz), and the scales ca
n be calibrated to read parameters directly. The accuracy of
these devices is limited to about 1% of full scale. They can be used to set the limits on alarm lights,
sound alarms, and kick-out relays.
• Digital meters are easier to read and can have greater
ranges than analog meters. Numerical values are
easily read without extrapolation, but fast trends of changing readings are more difficult to interpret.
Although many digital meters have binary coded decimal (bcd) output, they are relatively slow.
• X-Y plotters can be used to display impedance-plane plots of the eddy-
current response. They are very
helpful in the design and set up of eddy-current, bridge-
unbalance inspections and in discriminating
against undesirable variables. They also are useful to sort
out inspection results. They are fairly accurate
and provide a permanent copy.
• X-Y storage oscilloscopes are very similar to X-
Y plotters but can acquire signals at high speed.
However, the signals have to be processed manually, and the screen can quickly
become cluttered with
signals. In some instruments, high-speed X-Y gates can be displayed and set on the screen.
• Strip-
chart recorders furnish a fairly accurate (about 1% of full scale) recording at reasonably high
speed (about 200 Hz). However, once on
the chart, the data must be read by an operator. Several
channels can be recorded simultaneously, and the record is permanent.
• Magnetic-
tape recorders are fairly accurate and capable of recording at very high speed (10 MHz).
Moreover, the data can be processed by automated techniques.
• Computers. The data from several channels can be fed directly to a high-
speed computer, either analog
or digital, for on-
line processing. The computer can separate parameters and calculate the variable of
interest and signif
icance, catalog the data, print summaries of the result, and store all data on tape for
reference in future scans.
Discontinuities Detectable by Eddy-Current Inspection
Basically, any discontinuity that appreciably alters the normal flow of eddy currents can be detected by eddy-current
inspection. With encircling-coil inspection of either solid cylinders or tubes, surface discontinuities having a combination
of predominantly longitudinal and radial dimensional components are readily detected. When discontinuities of the same
size are located beneath the surface of the part being inspected at progressively greater depths, they become increasingly
difficult to detect, and can be detected at depths greater than 13 mm ( in.) only with special equipment designed for this
purpose.
Conversely, laminar discontinuities such as those in welded tubes might not alter the flow of the eddy currents enough to
be detected unless the discontinuity breaks either the outside or inside surfaces, or unless it produces a discontinuity in the
weld from upturned fibers caused by extrusion during welding. A similar difficulty could arise in trying to detect a thin
planar discontinuity that is oriented substantially perpendicular to the axis of the cylinder.
Regardless of the limitations, a majority of objectionable discontinuities can be detected by eddy-current inspection at
high speed and at low cost. Some of the discontinuities that are readily detected are seams, laps, cracks, slivers, scabs,
pits, slugs, open welds, miswelds, misaligned welds, black and gray oxide weld penetrators, pinholes, hook cracks, and
surface cracks.
Reference Samples. A basic requirement for eddy-current inspection is a reliable, consistent means to set tester
sensitivity to the proper level each time it is used. A standard reference sample must be provided for this purpose.
Without this capability, eddy-current inspection is of little value. In selecting a standard reference sample, the usual
procedure is to select a sample of product that can be run through the inspection system without producing appreciable
indications from the tester. Several samples might have to be run before a suitable one is found; the suitable one then has
reference discontinuities fabricated into it.
The type of reference discontinuities that must be used for a particular application are specified (for example, by ASTM
and API). In selecting reference discontinuities, some of the major considerations are: (a) they must meet the required
specification, (b) they should be easy to fabricate, (c) they should be reproducible, (d) they should be producible in
precisely graduated sizes, and (e) they should produce an indication on the eddy-current tester that closely resembles
those produced by the natural discontinuities.
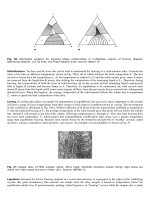
Figure 13 shows several discontinuities that have been used for reference standards, these include a filed transverse notch,
milled or electrical discharge machined longitudinal and transverse notches, and drilled holes.
Fig. 13 Several fabricated discontinuities used as reference standards in eddy-
current inspection. ASTM
standards for eddy-curre
nt testing include E 215 (aluminum alloy tube), E 376 (measurement of coating
thickness), E 243 (copper and copper alloy tube), E 566 (ferrous metal sorting), E 571 (nickel and nickel alloy
tube), E 690 (nonmagnetic heat-exchanger tubes), E 426 (stainless steel tube), and E 309 (steel tube).
Microwave Inspection
Introduction
MICROWAVES (or radar waves) are a form of electromagnetic radiation with wavelengths between 1000 cm and 1 mm
in free space. Because microwaves have wavelengths that are 10
4
to 10
5
times longer than those of light waves,
microwaves penetrate deeply into materials, with the depth of penetration dependent on the conductivity, permittivity, and
permeability of the materials. Microwaves are also reflected from any internal boundaries and interact with the molecules
that constitute the material. For example, it was found that the best source for the thickness and voids in radomes was the
microwaves generated within the radomes. Both continuous and pulsed incident waves were used in these tests, and either
reflected or transmitted waves were measured.
One of the first important uses of microwaves in nondestructive evaluation (NDE) was for components such as
waveguides, attenuators, cavities, antennas, and antenna covers (radomes). Subsequently, microwave inspection methods
were developed for:
• Evaluation of moisture content in dielectric materials
• Thickness measurements of thin metallic coatings on dielectric substrates
• Detection of voids, delaminatrons, macroporosity, inclusions, and other
flaws in plastic or ceramic
materials.
Advantages
In comparison with ultrasonic inspection and x-ray radiographic inspection, the advantages of inspection with
microwaves are as follows:
• Broadband frequency response of the coupling antennas
• Efficient coupling through air from the antennas to the material
• No material contamination problem caused by the coupling
• Microwaves readily propagate through air, so successive reflections are not obscured by the first one.
• Information concerning the amplitude and phase of propagating microwaves is readily obtainable.
•
No physical contact is required between the measuring device and the material being measured;
therefore, the surface can be surveyed rapidly without contact.
• The surface can be scanned in strips m
erely by moving the surface or by scanning the surface with
antennas.
• No changes are caused in the material; therefore, the measurement is nondestructive.
• The complete microwave system can be made from solid-
state components so that it will be small,
rugged, and reliable.
•
Microwaves can be used for locating and sizing cracks in materials if the following considerations are
followed. First, the skin depth at microwave frequencies is very small (a few micrometers), and the
crack is detected most sensitivel
y when the crack breaks through the surface. Second, when the crack is
not through the surface, the position of the crack is indicated by a detection of the high stresses in the
surface right about the subsurface crack. Finally, microwave crack detection i
s very sensitive to crack
opening and to the frequency used. Higher frequencies are needed for the smaller cracks. If the
frequency is increased sufficiently, the incident wave can propagate into the crack, and the response is
then sensitive to crack depth.
Limitations
The use of microwaves is in some cases limited by their inability to penetrate deeply into conductors or metals. This
means that nonmetallic materials inside a metallic container cannot be easily inspected through the container. Another
limitation of the lower-frequency microwaves is their comparatively low power for resolving localized flaws. If a
receiving antenna of practical size is used, a flaw with effective dimension that is significantly smaller than the
wavelength of the microwaves used cannot be completely resolved (that is, distinguished as a separate, distinct flaw). The
shortest wavelengths for which practical present-day microwave apparatus exists are of the order of 1 mm (0.04 in.).
However, the development of microwave sources with wavelengths of 0.1 mm (0.004 in.) are proceeding rapidly.
Consequently, microwave inspection for the detection of very small flaws is not suited for applications in which flaws are
equal to or smaller than 0.1 mm (0.004 in.). Subsurface cracks can be detected by measuring the surface stress, which
should be much higher in the surface above the subsurface crack.
Techniques of Microwave Inspection
The following general approaches have been used in the development of microwave nondestructive inspection:
• Fixed-frequency, continuous-wave transmission
• Swept-frequency, continuous-wave transmission
• Pulse-modulated transmission
• Fixed-frequency, continuous-wave reflection
• Swept-frequency, continuous-wave reflection
• Pulse-modulated reflection
• Fixed-frequency standing waves
• Fixed-frequency reflection scattering
• Microwave holography
• Microwave surface impedance
• Microwave detection of stress corrosion
Each of these techniques uses one or more of the several processes by which materials can interact with microwaves,
namely, reflection, refraction, scattering, absorption, and dispersion. The basic components of the transmission technique
are shown schematically in Fig. 1.
Fig. 1 Diagram of the basic components of the transmission technique used for microwave inspection
Thickness measurements
Thickness measurements can be made with microwave techniques on both metallic and nonmetallic materials. For metals,
two reflected waves are used from two waveguide arms that differ in length by an integral number of half-wavelengths for
detector output null. This measurement is made using the standing wave technique. When the wave is incident on a metal
(electrically conductive), most of the wave is reflected; only a small amount is transmitted (refracted). The transmitted
wave is highly attenuated in the metal within the first skin depth. For nonmetallic materials (electrically nonconductive),
the reflected wave is much smaller than the incident wave, so that any standing wave that does develop does not have a
large amplitude.
Detection of Discontinuities
Discontinuities such as cracks, voids, delaminations, separations, and inclusions predominantly reflect or scatter
electromagnetic waves. Wherever these types of flaws occur, there is a more or less sharp boundary between two
materials having markedly different velocities for electromagnetic waves. At these boundaries, which are usually thin
compared to the wavelength of electromagnetic radiation being used, the electromagnetic wave is reflected, refracted, or
scattered. The reflected or scattered radiation has appreciable amplitude only if the minimum dimension of the
discontinuity is larger than about one-half the wavelength of the incident radiation in the material being tested.
Porosity and regions of defective material such as departures from nominal composition do not produce strong reflection
or scattering. They do influence the attenuation and the velocity of the electromagnetic wave. When there is absorption,
the transmitted wave has an exponential decay with respect to the distance traveled.
Microwave Detection of Surface Cracks in Metals
When an electromagnetic wave is incident on a metallic surface that has slits or cracks, the metallic surface reradiates
(reflects) a signal because of induced current. Under the proper conditions, the reflected wave combines with the incident
wave to produce a standing wave. The reflection from a surface without a crack is different from that surface with a crack
and depends on the direction of the incident wave polarization relative to the crack. When the crack is long and narrow
and the electric field is perpendicular to the length of the crack, the reflected wave (and therefore any standing wave) is
affected by the presence of the crack. The amount of change is used to determine the size and depth of the crack.
Ultrasonic Inspection
Introduction
ULTRASONIC INSPECTION is a nondestructive method in which beams of high-frequency acoustic energy are
introduced into a material to detect surface and subsurface flaws, to measure the thickness of the material, and to measure
the distance to a flaw. An ultrasonic beam travels through a material until it strikes an interface or discontinuity such as a
flaw. Interfaces and flaws interrupt the beam and reflect a portion of the incident acoustic energy. The amount of energy
reflected is a function of (a) the nature and orientation of the interface or flaw and (b) the acoustic impedance of such a
reflector. Energy reflected from various interfaces and flaws can be used to define the presence and locations of flaws, the
thickness of the material, and the depth of a flaw beneath a surface.
Most ultrasonic inspections are performed using a frequency between 1 and 25 MHz. Short shock bursts of ultrasonic
energy are aimed into the material from the ultrasonic search unit of the ultrasonic flaw-detector instrument. The
electrical pulse from the flaw detector is converted into ultrasonic energy by a piezoelectric transducer element in the
search unit. The beam pattern from the search unit is determined by the operating frequency and size of the transducer
element. Ultrasonic energy travels through the material at a specific velocity that is dependent on the physical properties
of the material and on the mode of propagation of the ultrasonic wave. The amount of energy reflected from or
transmitted through an interface, other type of discontinuity, or reflector is dependent on the properties of the reflector.
These phenomena provide the basis for establishing two of the most common measurement parameters used in ultrasonic
inspection: the amplitude of the energy reflected from an interface or flaw and the time required (from pulse initiation) for
the ultrasonic beam to reach the interface or flaw.
Ultrasonic Flaw Detectors
Although the electronic equipment used for ultrasonic inspection can vary greatly in detail among equipment
manufacturers, all general-purpose units consist of a power supply, a pulser circuit, a search unit, a receiver-amplifier
circuit, an oscilloscope, and an electronic clock. Many systems also include electronic equipment for signal conditioning,
gating, automatic interpretation, and integration with a mechanical or electronic scanning system. Also, advances in
microprocessor technology have extended the data acquisition and signal-processing capabilities of ultrasonic inspection
systems. In most instances the entire electronic assembly, including the controls and display, is contained in a single
instrument. A typical ultrasonic flaw detector is shown in Fig. 1. The major controls include:
• Frequency selector to select the operating or test frequency
• Pulse-tuning control to fine adjust the test frequency
• Pulse-repetition-
rate control, which determines the number of times per second that an ultrasonic pulse
is initiated from the transducer (typically 100 to 2000 pulses per second)
• Test-type or mode-selection switch to adjust instrument to pulse-echo or pitch-catch operation
• Sensitivity controls to adjust sensitivity or gain of the receiver-amplifier
• Sweep selector and delay to adjust time base a
nd that portion of the inspection zone that is to be
displayed
• Gate-
position control to isolate the portion of the inspection zone that will be used for additional
processing
• Oscilloscope, which provides the visual display of the time and amplitude param
eters used to interpret
the data from the ultrasonic inspection
Fig. 1 Typical pulse-echo instrument
Ultrasonic Transducers and Search Units
Generation and detection of ultrasonic waves for inspection is accomplished by means of a transducer element. The
transducer element is contained within a device most often referred to as a search unit (or sometimes as a probe). The
active element in a search unit is a piezoelectric crystal. Piezoelectricity is pressure-induced electricity, a property
characteristic of certain naturally occurring crystalline compounds and some man-made materials. An electrical charge is
developed by the crystal when pressure is applied to it. Conversely, when an electrical field is applied, the crystal
mechanically deforms (changes shape). Piezoelectric crystals have various deformation modes; thickness expansion is the
principal mode used in transducers for ultrasonic inspection.
The most common types of piezoelectric materials used for ultrasonic search units are quartz; lithium sulfate; and
polarized ceramics such as barium titanate, lead zirconate titanate, and lead metaniobate. Table 1 summarizes
characteristics and applications of these materials.
Table 1 Characteristics and applications of piezoelectric transducer elements
Characteristics of piezoelectric elements
Efficiency
Suitability of element in:
Coupling Contact
inspection
Piezoelectric
element
Transmit
Receive
To
water
To
metal
Tolerance
to
elevated
temperature
Damping
ability
Undesired
modes
(inherent
noise)
Straight-
beam
Angle-
beam
Immersion
inspection
Quartz
P G G F G F G G F G
Lithium sulfate
F E E P P E E P F E
Barium titanate
G P G G P P P G G F
Lead zirconate
titanate
E F F E E F P E E F
Lead
metaniobate
G F G E E E G E E G
Search units come in a variety of types and shapes. Variations in search-unit construction include transducer-element
material; transducer-element thickness, surface area, and shape; and type of backing material and degree of loading. Four
basic types of search units are straight-beam contact, angle-beam contact, dual-element contact, and immersion, both flat
and focused. Table 2 lists their primary areas of application. Sectional views of these search units, together with a special
type (delay-tip, contact-type search unit), are shown in Fig. 2.
Table 2 Primary applications of ultrasonic search units
Straight-beam, contact-type units
• Manufacturing-induced flaws:
o Billets inclusions, stringers, pipe
o Forgings inclusions, cracks, segregations, seams, flakes, pipe
o Rolled products laminations, inclusions, tears, seams, cracks
o Castings slag, porosity, cold shuts, tears, shrinkage cracks, inclusions
• Service-induced flaws: fatigue cracks, corrosion, erosion, stress-corrosion cracks
Angle-beam, contact-type units
• Manufacturing-induced flaws:
o Forgings cracks, seams, laps
o Rolled products tears, seams, cracks, cupping
o Welds
slag inclusions, porosity, incomplete fusion, incomplete penetration, dropthrough,
suckback, cracks in filler metal and base metal
o Tubing and pipe circumferential and longitudinal cracks
• Service-induced flaws: fatigue cracks, stress-corrosion cracks
Dual-element, contact-type units
• Manufacturing-induced flaws:
o Plate and sheet thickness measurement, lamination detection
o Tubing and pipe measurement of wall thickness
• Service-induced flaws: wall thinning, corrosion, erosion, stress-corrosion cracks
Immersion-type units
• Manufacturing-induced flaws:
o Billets inclusions, stringers, pipe
o Forgings inclusions, cracks, segregations, seams, flakes, pipe
o Rolled products laminations, inclusions, tears, seams, cracks
o Welds
inclusions, porosity, incomplete fusion, incomplete penetration, dropthrough,
cracks, base-metal laminations
o Adhesive-bonded, soldered, or brazed products lack of bond
o Composites voids, resin rich, resin poor, lack of filaments
o Tubing and pipe circumferential and longitudinal cracks
• Service-induced flaws: corrosion, fatigue cracks
Fig. 2 Sectional views of five types of search units used in ultrasonic inspection. (a) Straight-
beam
(longitudinal-wave) contact. (b) Angle-beam (shear-wave) contact. (c) Dual-element contact. (d) Delay-
tip
(stand-off) contact. (e) Immersion
The selection of a transducer depends very much on the properties of the test specimen, particularly its sound attenuation.
Ultrasonics of high frequency produce good resolution, which is the ability to separate echoes from closely spaced
defects. Ultrasonics of low frequency penetrate deeper into materials because attenuation is generally lower. However,
backscattering "noise" from grain boundaries is usually more important than attenuation, although the net result is the
same because the signal-to-noise ratio also usually decreases with frequency. This is shown in Fig. 3. This means that the
two requirements of high penetration and high resolution are mutually exclusive. For example, a specimen having high
attenuation, such as steel, should be examined by a low frequency beam of about 0.5 MHz and a large transducer diameter
about 50 mm (2 in.), which provides a high penetration, but a relatively low lateral resolution of about 6 mm ( in.).
Improved resolution can be obtained by using shear waves, because these have shorter wavelengths than compression
waves of the same frequency in the solid. (The velocity of a longitudinal wave in a solid is greater than that of the shear
wave of the same frequency.) Large diameter transducers are chosen to produce a narrow focused beam, which enhances
the lateral resolution.
Fig. 3
Oscilloscope displays using ultrasonic transducers of (a) high and low penetration (ability to detect
defects at distances within the solid), and (b) high and low resolution (ability to separate echoes from closely-
spaced defects)
Couplants
Air is a poor transmitter of sound waves at megahertz frequencies. Also, because the acoustic impedance mismatch
between air and most solids is significant, even a very thin layer of air severely retards the transmission of sound waves
from the transducer to the test piece. Therefore, it is necessary to use a couplant to eliminate air between the transducer
and the test piece for satisfactory contact inspection.
Couplants normally used for contact inspection include water, oils, glycerin, petroleum greases, silicone grease, cellulose
gum, and various commercial pastelike substances. Certain soft rubbers that transmit sound waves can be used where
adequate coupling can be achieved by applying pressure to the search unit.
Factors that should be considered in selecting a couplant include:
• Surface finish of test piece
• Temperature of test surface
• Possibility of chemical reactions between test surface and couplant
• Cleaning requirements (some couplants are difficult to remove)
Water is a suitable couplant for use on a relatively smooth surface, but a wetting agent should be added. The addition of
glycerin sometimes is necessary to increase viscosity.
Heavy oil or grease should be used on hot and vertical surfaces and on rough surfaces where irregularities need to be
filled.
Cellulose gum is especially useful on rough surfaces when good coupling is needed to minimize background noise and
yield an adequate signal-to-noise ratio.
Basic Inspection Methods
Ultrasound can be used to measure material thickness by (a) determining resonant frequencies of a test piece and (b)
measuring time required for an ultrasonic-wave packet (pulse) to traverse the test piece. The former uses reflected
ultrasound to create standing waves in the test piece; the frequencies at which standing waves occur are used to compute
thickness. In the latter method, the time it takes for a pulse of ultrasonic energy to be transmitted through the test piece is
measured; this time period can be 100 nanoseconds or less. Thickness is calculated as the product of the measured time of
flight and the known acoustic-wave velocity.
Ultrasound can be used to detect flaws by measuring (a) the amplitude of the acoustic pressure wave and time of flight of
reflected acoustic waves and (b) the amplitude of the acoustic pressure wave of either transmitted or reflected acoustic
waves. The pulse-echo technique is the most widely used ultrasonic technique. Flaws are detected and their sizes
estimated by comparing the amplitude of a reflected echo from an interface (either within the test piece or at the back
surface) with the amplitude of an echo reflected from a reference interface of known size or from the back surface of a
test piece that has no flaws. The echo from the back surface (back reflection) serves as a reference point for time-of-flight
measurements that enable measuring the depth of some internal flaws. It is necessary that an internal flaw reflect at least
part of the sound energy onto the receiving transducer to measure depth. However, echoes from flaws are not essential to
their detection. Just because the amplitude of an echo from back reflection of a test piece is lower than that of an echo
from an identical flaw-free workpiece implies that the test piece contains one or more flaws. Detection of the presence of
flaws by sound attenuation is used in both transmission and pulse-echo techniques. The inability to detect flaw depth is
the main disadvantage of attenuation techniques.
Pulse-Echo Method
In pulse-echo inspection, short bursts of ultrasonic energy (pulses, or wave packets) are introduced into a test piece at
regular time intervals. If the pulses encounter a reflecting surface, some or all of the energy is reflected. The proportion of
energy that is reflected is highly dependent on the size of the reflecting surface in relation to the size of the incident
ultrasonic beam. The direction of the reflected beam (echo) depends on the orientation of the reflecting surface with
respect to the incident beam. Reflected energy is monitored; both the amount of energy reflected in a specific direction
and the time delay between transmission of the initial pulse and receipt of the echo are measured.
Principles of Operation. Most pulse-echo systems consist of (a) an electronic clock; (b) an electronic signal
generator, or pulser; (c) a sending transducer; (d) a receiving transducer; (e) an echo-signal amplifier; and (f) a display
device. In the most widely used version of pulse-echo systems, a single transducer acts alternatively as a sending and
receiving transducer. The clock and signal generator usually are combined in a signal electronic unit. Frequently, circuits
that amplify and demodulate echo signals from the transducer are housed in the same unit.
In a pulse-echo system with a single search unit, the electronic clock triggers the signal generator at regular intervals,
which imposes a short burst of high-frequency alternating voltage on the transducer element. Simultaneously, the clock
activates a time-measuring circuit connected to the display device. The operator preselects a constant interval between
pulses by means of a "pulse-repetition-rate" control on the instrument; pulses usually are repeated 100 to 2000 times per
second. The operator also can preselect the signal generator or pulser output frequency. For best results, frequency (and
sometimes the pulse-repetition rate) should be tuned to achieve the maximum response of the transducer (resonance in the
vibrating element) and maximum signal-to-noise ratio (lowest amount of electronic noise) in the electronic equipment.
The transducer converts the pulse of alternating voltage into a pulse of mechanical vibration having essentially the same
frequency as the imposed alternating voltage. The mechanical vibration (ultrasound) is introduced into a test piece
through a couplant and travels by wave motion through the test piece at the speed of sound. When the pulse of ultrasound
encounters a reflecting surface that is perpendicular to the direction of travel, ultrasonic energy is reflected and returns to
the transducer. The returning pulse travels along the same path and at the same speed as the initial pulse, but in the
opposite direction.
Data Presentation. Information from pulse-echo inspection can be displayed in one of three forms: (a) A-scan, which
is a quantitative display of echo amplitude and time-of-flight data obtained at a single point on the surface of the test
piece; (b) B-scan, which is a quantitative cross-sectional display of time-of-flight data obtained along a plane
perpendicular to the surface of the test piece; or (c) C-scan, which is a semiquantitative display of echo amplitude
obtained over an area of the surface of the test piece. The A-scan display, which is the most widely used form, can be
analyzed in terms of the type, size, and location (chiefly depth) of internal flaws.
A-scan display basically is a plot of amplitude versus time, in which a horizontal baseline on an oscilloscope screen
indicates elapsed time and vertical deflections (called indications or signals) represent echos. A typical A-scan setup that
illustrates the essential elements in a basic system for pulse-echo inspection is shown in Fig. 4. These elements include:
• Power supply, which can run on 110-volt alternating current or on batteries
• Electronic clock, or timing circuit, to trigger pulser and display circuits
• Pulser circuit, or rate generator, to control frequency, amplitude, and pulse-
repetition rate of the voltage
pulses that excite the search unit
• Receiver-amplifier circuit to convert output signals from the search unit into a form suitable
for
oscilloscope display
• Sweep circuit to control (a) time delay between search-
unit excitation and start of oscilloscope trace and
(b) rate at which oscilloscope trace travels horizontally across the screen
• Marker circuit (optional) to produce a seconda
ry trace, on or below the main trace, usually in the form
of a square wave, which is used for precise depth measurements
•
Oscilloscope screen, including separate controls for trace brightness, trace focus, and illuminated
measuring grid
• Flaw gate (not shown) to isolate the echo of interest for further processing
Fig. 4 Typical A-scan setup, including video-mode display, for a basic pulse-echo, ultrasonic-inspection system
The search unit and the coaxial cable connecting the unit to the instrument, although not strictly part of the electronic
circuitry, must be matched to the electronics.
B-scan display is a plot of time versus distance, in which one orthogonal axis on the display corresponds to elapsed
time, while the other axis represents the position of the search unit along a line on the surface of the test piece relative to
the position of the search unit at the start of the inspection. Echo amplitude is not measured directly as in A-scan
inspection, but often it is indicated semiquantitatively by the relative brightness of echo indications on an oscilloscope
screen.
Figure 5 shows a typical B-scan system. System functions are identical to those of the A-scan system except for the
following differences:
• The display is generated on an oscilloscope screen consisting of a long-
persistence phosphor; that is, a
phosphor that continues to fluoresce long after the means of excitation ceases to fall on the fluorescing
area of the screen. This allows
the imaginary cross section to be viewed as a whole without having to
resort to permanent imaging methods such as photographs. (Photographic equipment, facsimile
recorders, or x-y plotters can be used to record B-scan data for later reference.)
• Oscillosc
ope input for one axis of the display is provided by an electromechanical device, which
generates an electrical voltage proportional to the position of the search unit relative to a reference point
on the surface of the test piece. Most B-scans are generat
ed by scanning the search unit in a straight line
across the surface of the test piece at a uniform rate. One axis of the display (usually the horizontal axis)
represents the distance traveled along this line.
• Echoes are indicated by bright spots on the s
creen rather than by deflections of the time trace. The
position of a bright spot along the axis orthogonal to the search-
unit position axis (usually measured top
to bottom on the screen) indicates the depth of the echo within the test piece.
• The echo-intensity signal from the receiver-amplifier is connected to the trace-
brightness control on the
oscilloscope to ensure that echoes are recorded as bright spots. In some systems, the brightnesses
corresponding to different values of echo amplitude has suffici
ent contrast to permit semiquantitative
appraisal of echo amplitude, which is related to flaw size and shape.
Fig. 5 Typical B-scan setup, including video-mode display, for a basic pulse-echo, ultrasonic-inspection system
The oscilloscope screen in Fig. 5 illustrates the type of video-mode display that is generated by B-scan equipment. The
internal flaw in the test piece shown at left in Fig. 5 is shown only as a profile view of its top reflecting surface. Portions
of the test piece that are behind this large reflecting surface are in shadow.
C-scan display records echoes from internal portions of test pieces as a function of the position of each reflecting
interface within an area. Flaws are shown on a readout, superimposed on a plan view of the test piece, and both flaw size
(flaw area) and position within the plan view are recorded. Flaw depth typically is not recorded, although it can be
measured semiquantitatively by restricting the range of depths within the test piece that is covered in a given scan.
In a basic C-scan system, shown schematically in Fig. 6, the the search unit is moved over the surface of the test piece in a
search pattern. The search pattern can take many forms, such as a series of closely spaced parallel lines, a fine zigzag
pattern, and a spiral pattern (polar scan). Mechanical linkage connects the search unit to x-axis and y-axis position
indicators, which in turn, feed position data to the x-y plotter or facsimile device. Echo-recording systems vary; some
produce a shaded-line scan with echo amplitude recorded as a variation in line shading, while others indicate flaws by an
absence of shading, so each flaw appears as a blank space on the display (see Fig. 6).
Fig. 6 Typical C-scan setup, including display, for a basic pulse-echo, ultrasonic-inspection system
Interpretation of Pulse-Echo Data
Interpretation of pulse-echo data is relatively straightforward for B-scan and C-scan presentations. The B-scan always
records the front reflection, while internal echoes and/or loss of back reflection are interpreted as flaw indications. Flaw
depth is measured as the distance from the front reflection to a flaw echo, the latter representing the front surface of the
flaw.
In contrast to normal B-scan and C-scan displays, A-scan displays can be complex. It is necessary to disregard electronic
noise, spurious echoes, and extra echoes resulting from mode conversion of the initial pulse to focus attention on any flaw
echoes that might be present.
Basic A-scan displays are of the type shown in Fig. 7 for immersion inspection of a plate containing a flaw. The test
material is 25 mm (1 in.) thick aluminum alloy 1100 plate containing a purely reflecting planar flaw 11.25 mm (0.44 in.)
deep. The flaw is 45% of plate thickness, exactly parallel to the plate surfaces, and has an area equal to one-third the cross
section of the ultrasonic beam. Testing is by straight-beam immersion in a water-filled tank. There are no attenuation
losses within the test plate, only transmission losses across front and back surfaces.
Fig. 7 Schematic representation of straight-
beam immersion inspection of a 25 mm thick aluminum alloy 1100
plate containing a planar discontinuity, showing (a) inspection setup, (b) complete video-mode A-scan d
isplay,
and (c) normal oscilloscope display
The normal display (Fig. 7c) represents only a portion of the complete video-mode A-scan display (Fig. 7b). The normal
display is obtained by adjusting horizontal-position and horizontal-sweep controls to display only the portion of the trace
corresponding to the transit time (time of flight) required for a single pulse of ultrasound to traverse the test piece from
front surface to back surface and return. Also, receiver-amplifier gain is adjusted until the height of the first back
reflection equals some arbitrary distance on the screen, usually a convenient number of grid lines.
Most flaws are not exactly parallel to the surface of the testpiece, not truly planar (they have rough, curved interfaces), not
ideal reflectors, and are of unknown size. These factors together with bulk material sound-attenuating characteristics
affect echo signal size and shape.
Angle-Beam Technique. Most angle-beam testing is accomplished using shear waves, although refracted longitudinal
waves and surface waves can be used in some applications. In contrast to straight-beam testing, only flaw indications
appear on the display in an angle-beam test. Only rarely will a back surface be oriented properly to give a back-reflection
indication. In most instances, ultrasonic beams are reflected from the back surface at an angle away from the search unit.
The reflected pulses are capable of detecting discontinuities and are used extensively in angle-beam testing of welds, pipe
and tubing, and sheet and plate.
The time base (horizontal sweep) on the oscilloscope must be carefully calibrated, because in angle-beam testing there is
no back-reflection echo to provide a reference to estimate flaw depth. Usually, an extended time base is used so flaws are
located with one or two skip distances from the search unit (see Fig. 8 for the definition of skip distance).
Fig. 8 Angle-beam testing using a contact transducer on a (a) plate and (b) pipe
Figure 8(a) shows how a shear wave from an angle-beam transducer progresses through a flat testpiece by reflecting
from the surfaces at points called "nodes." The linear distance between two successive nodes on the same surface is called
the "skip distance," and is important in defining the path over which the transducer should be moved for reliable and
efficient scanning. The skip distance can easily be measured by using a separate receiving transducer to detect the nodes
or by using an angle-beam test block, or it can be calculated. The region over which the transducer should be moved to
scan the test piece can be determined once the skip distance is known.
Moving the search unit back and forth between one-half skip distance and one skip distance from an area of interest can
be used not only to define the location, depth, and size of a flaw, but also to initially detect flaws. Figure 9 illustrates this
back-and-forth movement as a way of scanning a weld for flaws.
Fig. 9
Three positions of a contact type of transducer along the zigzag scanning path used during manual
angle-beam ultrasonic inspection of welded joints. The movement of the sound beam path across th
e weld is