Báo cáo y học: "Improvement in symptoms and signs in the forefoot of patients with rheumatoid arthritis treated with anti-TNF therapy" ppsx
Bạn đang xem bản rút gọn của tài liệu. Xem và tải ngay bản đầy đủ của tài liệu tại đây (875.37 KB, 9 trang )
JOURNAL OF FOOT
AND ANKLE RESEARCH
Bowen et al. Journal of Foot and Ankle Research 2010, 3:10
/>Open Access
RESEARCH
© 2010 Bowen et al; licensee BioMed Central Ltd. This is an Open Access article distributed under the terms of the Creative Commons
Attribution License ( which permits unrestricted use, distribution, and reproduction in
any medium, provided the original work is properly cited.
Research
Improvement in symptoms and signs in the
forefoot of patients with rheumatoid arthritis
treated with anti-TNF therapy
Catherine J Bowen*
†1,7
, Christopher J Edwards
4,2,6,5
, Lindsey Hooper
†1,5
, Keith Dewbury
†3
, Madeleine Sampson
†3
,
Sally Sawyer
†4
, Jane Burridge
†1
and Nigel K Arden
†4,6,7
Abstract
Background: Inhibition of tumour necrosis factor (TNF) is an effective way of reducing synovitis and preventing joint
damage in rheumatoid arthritis (RA), yet very little is known about its specific effect on foot pain and disability. The aim
of this study was to evaluate whether anti-TNF therapy alters the presence of forefoot pathology and/or reduces foot
pain and disability.
Methods: Consecutive RA patients starting anti-TNF therapy (infliximab, etanercept, adalimumab) were assessed for
presence of synovial hypertrophy and synovitis in the 2
nd
and 5
th
metatarso-phalangeal (MTP) joints and plantar
forefoot bursal hypertrophy before and 12 weeks after therapy. Tender MTP joints and swollen bursae were established
clinically by an experienced podiatrist and ultrasound (US) images were acquired and interpreted by a radiologist.
Assessment of patient reported disease impact on the foot was performed using the Manchester Foot Pain and
Disability Index (MFPDI).
Results: 31 patients (24 female, 7 male) with RA (12 seronegative, 19 seropositive) completed the study: mean age 59.6
(SD 10.1) years, disease duration 11.1 (SD 10.5) years, and previous number of Disease Modifying Anti Rheumatic Drugs
3.0 (1.6). Significant differences after therapy were found for Erythrocyte Sedimentation Rate (t = 4.014, p < 0.001), C-
reactive protein (t = 3.889, p = 0.001), 28 joint Disease Activity Score (t = 3.712, p = 0.0001), Visual Analog Scale (t =
2.735, p = 0.011) and Manchester Foot Pain and Disability Index (t = 3.712, p = 0.001).
Presence of MTP joint synovial hypertrophy on US was noted in 67.5% of joints at baseline and 54.8% of joints at twelve
weeks. Presence of plantar forefoot bursal hypertrophy on US was noted in 83.3% of feet at baseline and 75% at twelve
weeks. Although there was a trend for reduction in observed presence of person specific forefoot pathology, when the
frequencies were analysed (McNemar) this was not significant.
Conclusions: Significant improvements were seen in patient reported foot pain and disability 12 weeks after
commencing TNF inhibition in RA, but this may not be enough time to detect changes in forefoot pathology.
Background
Tumour Necrosis Factor (TNF) inhibition is known to be
an effective way of reducing synovial hypertrophy and
preventing erosions in patients who have rheumatoid
arthritis (RA) [1,2]. Unfortunately studies to date have
tended to focus on the hand joints and little is known of
the effect of TNF inhibition on the foot.
Prevalence rates for pain and swelling in the feet in RA
are high [3] and this correlates with patient reported out-
come measures of impairment, activity limitation and
participation restriction [4]. In fact, most patients with
RA continue to report frequent and disabling foot pain
despite pharmacological management, including TNF
inhibition [5-8].
We have previously reported higher prevalence rates of
forefoot pathology detectable by ultrasound (US) than by
clinical examination [9]. Clinical assessment techniques
are relatively insensitive in assessment of RA disease
* Correspondence:
1
School of Health Sciences, University of Southampton, Southampton, UK
†
Contributed equally
Full list of author information is available at the end of the article
Bowen et al. Journal of Foot and Ankle Research 2010, 3:10
/>Page 2 of 9
within the foot, and clinically under reported manifesta-
tions of RA within the foot appear to be a common find-
ing in imaging studies [10-12]. Although investigators
have reported the demographic of TNF inhibition, none
have formally assessed the effects on foot symptoms and
pathology.
US is beneficial in monitoring the progression of active
inflammation in rheumatoid arthritis [13] and in the
monitoring of biologic therapy [14-16]. The aim of this
study was to evaluate by means of US, the effects of anti-
TNF therapy in RA patients with specific focus on the
forefoot using the hypothesis that forefoot symptoms,
like those of hand joint symptoms, would improve with
this intervention.
Methods
A prospective study design was utilized, in which the
forefeet of a consecutive cohort of patients with RA diag-
nosed according to the ACR criteria (modified 1987) [17]
starting anti-TNF therapy (infliximab, etanercept or adal-
imumab) was examined clinically and by US at baseline
and twelve weeks following therapy.
Participant selection
Participants were recruited from patients with RA
attending the Rheumatology
Department, Southampton University Hospitals NHS
Trust who were starting anti-TNF therapy. In compliance
with the declaration of Helsinki, Local Research Ethics
Committee approval and informed consent was secured
prior to data collection.
We enrolled consecutive patients with RA who were
about to start anti-TNF therapy and were considered
appropriate for this study. Our recruitment criteria
excluded any patients from the study if they had a history
of previous forefoot surgery, received a corticosteroid
injection to the forefoot within the 3 months prior to this
study, had an additional musculoskeletal disease (e.g. pri-
mary osteoarthritis, gout, Paget's disease, systemic lupus
erythematosus), or had a serious medical (other than RA)
or psychological disorder that would prevent completion
of the study protocol.
Data collection
Data collection took place between February 2005 and
June 2007. The longer time allowed for sufficient num-
bers to be recruited as only a limited number of patients
were starting anti-TNF therapy during that period. All
clinical assessments took place within the Wellcome
Trust Clinical Research Facility, Southampton General
Hospital. All US scans were undertaken by a Radiologist
(KD or MS) and took place in the Department of Radiol-
ogy, Southampton General Hospital. On each visit, the
same treatment bays and US facilities were utilised. An
experienced podiatrist assessed both forefeet of all partic-
ipants (CJB) and the presence of any swelling and/or ten-
derness was recorded. To reduce recall bias, all
investigators (CJE, SB, CJB, KD and MS) were blinded to
each other's results and all were blinded to their own
baseline assessment of the individual patient being
assessed.
Assessment of demographic and clinical characteristics
Prior to data collection, the diagnosis of RA was con-
firmed by the supervising consultant (CJE). Following
acceptance into the study all participants were assessed
by a trained specialist rheumatology nurse (SB) and Dis-
ease Activity Scores (DAS-28) were calculated [18].
General demographic and clinical data of age, gender,
disease duration, presence of rheumatoid factor, current
medication, and current and previous use of Disease
Modifying Anti-Rheumatic Drugs (DMARDs) were
obtained from the Rheumatology Department database
and clinical notes.
Clinical characteristics included visual analog scale
(VAS 100 mm) assessment for the patient's global impres-
sion of health, and assessment of disease activity by the
number of painful, tender and swollen joints calculated as
Disease Activity Scores (DAS-28).
Foot assessments
Foot symptoms were determined by the use of a validated
patient administered index, the Manchester Foot Pain
and Disability Index (MFPDI) [19]. The MFPDI asked
participants to rate a series of 19 questions and took
approximately five minutes for participants to complete.
The forefeet of all participants were assessed by an expe-
rienced podiatrist (CJB) for MTP joint synovitis and
plantar forefoot bursitis. All foot assessments were con-
ducted at the same time as the US scans.
Other clinical data
Laboratory assessments included blood tests for C-reac-
tive protein (CRP) and Erythrocyte Sedimentation Rate
(ESR) on the same day as the foot assessments and US
scans.
Imaging data
US examinations were performed using a Philips HDI
5000 System (Royal Philips Electronics, Netherlands) in
B-Mode using a 5-10 MHz linear probe. Images were
recorded in two perpendicular planes, longitudinal and
transverse and performed moving from proximal to distal
as suggested by the EULAR (European League against
Rheumatism) working group for musculoskeletal US in
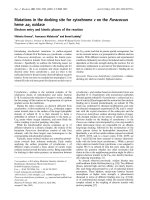
rheumatology guidelines [20]. A dorsal approach to
detect MTP joint synovial hypertrophy, synovitis and
erosion with the patient in a supine position was also
Bowen et al. Journal of Foot and Ankle Research 2010, 3:10
/>Page 3 of 9
adopted as recommend by the EULAR guidelines, [21]
(see Figure 1a).
Observations of MTP joint synovial hypertrophy, syno-
vitis and erosions by US (grey scale and power Doppler
where possible) were conducted within just two joints in
each foot (second and fifth MTP joints) from both a plan-
tar and dorsal approach. Synovial hypertrophy, synovitis
and erosions were registered as being present or absent.
We have previously reported on the selection of the sec-
ond and fifth MTP joints as being representative of the
forefoot joints [22] and this has also been corroborated by
others more recently [23]. On US synovial hypertrophy
appears as hypoechoic intra-articular tissue [24] and if
this is inflammatory active synovitis, it shows as a posi-
tive power Doppler US signal which gives a colour spec-
tral map superimposed onto the grey scale image [25].
Any synovial hypertrophy, synovitis and erosion within
the second and fifth MTP joints identified by US were
recorded on a data sheet.
At the time of this study there was no standard defini-
tion for imaging of clinically apparent plantar forefoot
bursal swelling by US. We therefore decided to use a
plantar approach as we were interested in determining
the prevalence of bursal hypertrophy within the plantar
forefoot region. Two types of bursal hypertrophy may
occur within the plantar forefoot region, intermetatarsal
or sub-metatarsal. Intermetatarsal bursal hypertrophy
appears on US as a well defined fluid collection with
hypoechoic or anechoic zones usually bulging more than
1 mm under the metatarsal head level [10,26]. Sub-meta-
tarsal bursal hypertrophy is attributed to adventitial bur-
sitis and defined on US as anechoic or heterogenous
collections of fluid within the sub-metatarsal fat pad [26] .
For each plantar scan the transducer was placed trans-
versely and moved laterally from the first MTP joint with
its centre at the level of the metatarsal heads (see Figure
1b). The process was repeated longitudinally (see Figure
1c). The presence of bursal hypertrophy across the plan-
tar forefoot region identified by US was recorded on a
data sheet.
Statistical analyses
Data evaluation and statistical analysis were performed
using SPSS version 17.0 software (SPSS, Chicago IL). The
data was initially examined using histograms and scatter
plots to identify 'outliers' that may have occurred due to
data entry bias or normal biological outliers. The preva-
lence of MTP joint synovial hypertrophy, synovitis, ero-
sions and plantar bursal hypertrophy per foot and per
anatomical site within the forefoot is described via the
mean, standard deviations and frequencies. Paired t-tests
for parametric continuous data were performed to deter-
mine whether there were differences in patient reported
foot pain and disability (MFPDI) between baseline and
twelve weeks as well as the clinical variables, ESR, CRP,
global well- being (VAS) and DAS-28. To determine
change in the presence of forefoot pathology, the pres-
ence of MTP joints with synovial hypertrophy, MTP
joints with synovitis, and total numbers of plantar fore-
foot bursal hypertrophy per foot were tested for differ-
ences using a McNemar test for categorical data of
related groups.
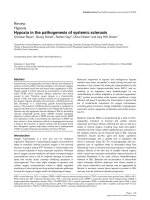
Figure 1 Photographs demonstrating the dorsal longitudinal approach to assess the MTP joints (a), and the plantar transverse (b) and lon-
gitudinal (c) positions of the US transducer to assess the plantar forefoot area.
A B C
Bowen et al. Journal of Foot and Ankle Research 2010, 3:10
/>Page 4 of 9
Results
Participant demographics and clinical characteristics
From thirty two patients with RA, starting anti-TNF ther-
apy recruited, one patient was excluded at the baseline
visit due to having the wrong diagnosis and one was
excluded from the US foot scans due to having open
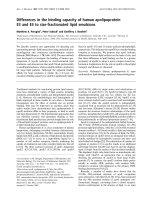
wounds on the plantar forefoot area. Four participants
did not return for the ultrasound scans at the twelve week
visit (see Figure 2). We did not exclude anyone at the ini-
tial participant recruitment session; however a small
number of individuals did decline to take part in the
study. Thirty one patients therefore started the study, 24
female and 7 male patients, 12 rheumatoid-factor nega-
tive and 19 rheumatoid-factor positive. The majority of
participants had established RA with a mean age of 59.58
(SD 10.14; range 37-76) years, and duration of RA 11.1
(SD 10.52; range 1-39) years. In line with NICE guidance
[27], all had previously been taking DMARDs, (mean 3.0,
SD 1.6, per person). A comparison of demographic and
clinical characteristics at baseline and twelve weeks can
be seen in Table 1.
There was a statistically significant reduction in patient
reported foot pain and disability after twelve weeks of
anti-TNF therapy (t = 3.712, p = 0.001). Similarly all other
clinical disease measures were significantly reduced: ESR
(t = 4.014, p < 0.001), CRP (t = 3.889, p = 0.001), DAS-28
(t = 3.712, p = 0.001) and global wellbeing VAS (t =
2.7351, p = 0.011).
Prevalence of forefoot pathology in patients with RA
detected by US
At both baseline and twelve weeks a higher prevalence of
forefoot pathology per individual was detected by US
than by clinical examination (see Table 2). There was an
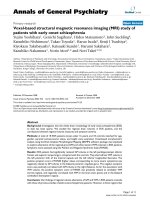
observed trend for reduction in presence of person spe-
cific US detectable plantar forefoot bursal hypertrophy
and MTP joint synovial hypertrophy between baseline
and twelve weeks (see Figure 3).
Observed presence of MTP joint synovial hypertrophy
by US from 60 feet (120 joints) indicates presence in
67.5% (81/120 joints) at baseline and 54.8% (57/104
joints) at twelve weeks. At twelve weeks 25.9% (27/104
joints) had changed from MTP joint synovial hypertro-
phy being present to absent, and 13.5% (14/104 joints)
changed from MTP joint synovial hypertrophy being
absent to present.
For presence of synovitis detectable by US Doppler,
from 44 feet (N = 16 data missing) 10.2% (9/88 joints) was
noted at baseline and 6.9% (5/72 joints from 36 feet was
noted at twelve weeks. Of these, 11.1% (8/72 joints) had
changed from MTP joint synovitis being present to
absent and small number, 5.6% (4/72 joints) had changed
from MTP joint synovitis being absent to present at
twelve weeks.
Frequency of observed presence of US detectable plan-
tar forefoot bursal hypertrophy was higher than that
noted in MTP joint synovial hypertrophy but changes fol-
lowed a similar pattern. US detectable forefoot bursal
hypertrophy was noted in 83.3% (50/60) of feet at base-
line and 75% (39/52) of feet at twelve weeks. At twelve
weeks 19.2% (10/52) of feet had changed from US detect-
able forefoot bursal hypertrophy being present to absent
and 9.6% (5/52) changed from US detectable forefoot
bursal hypertrophy being absent to present.
When the frequencies for joint specific and foot spe-
cific presence of US and clinically detectable MTP joints
with synovial hypertrophy, MTP joints with synovitis,
and plantar forefoot bursal hypertrophy per individual
were analysed no significant differences were found
between the baseline data and twelve weeks (Table 2).
Discussion
To our knowledge, our results are the first to show that
patient reported foot pain and disability reduces signifi-
cantly following TNF inhibition. Furthermore, using US,
our results indicate that there is a trend towards reduc-
tion in US detectable MTP joint synovial hypertrophy,
synovitis and plantar forefoot bursal hypertrophy follow-
ing twelve weeks of TNF inhibition.
The trend towards improvement was also noted in the
clinical and laboratory assessments of RA disease status
(ESR, CRP and DAS-28). These reductions were statisti-
cally significant demonstrating that TNF inhibition was
Table 1: Demographic and clinical characteristics of the study participants at baseline and twelve weeks by mean
(standard deviation)
Variable Baseline 12 weeks Statistical Values
MFPDI (×/38) 23.17 (9.23) 17.13 (9.73) t = 3.712, p = 0.001
VAS* (100 mm) 60.29 (21.12) 45.31 (23.25) t = 2.735, p = 0.011
ESR (mm/hour) 37.86 (24.48) 26.5 (16.4) t = 4.014, p < 0.001
CRP (mg/litre) 31.92 (27.15) 13.98 (15.38) t = 3.889, p = 0.001
DAS-28 5.76 (0.93) 4.54 (1.5) t = 3.712, p = 0.001
*Overall well being
Bowen et al. Journal of Foot and Ankle Research 2010, 3:10
/>Page 5 of 9
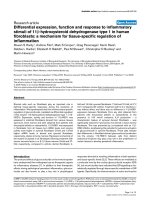
Figure 2 Participant recruitment flow chart of returnees and non returnees at baseline and twelve weeks.
Consecutive patients with RA who were about to start anti-TNF
therapy were recruited between February 2005–June 2007
31 participants recruited
into the study
12 replied with definite no,
did not want to take part
1 responded yes but then
was excluded during the
baseline assessment due to
having psoriatic arthritis
2 withdrew after baseline
assessments due to being
too ill to attend
1 excluded due to open foot
wounds
2 withdrew after baseline
assessments due to
personal reasons
31 participants
completed all
demographic and clinical
assessments
30 participants
completed all US scans
22 participants
completed all Doppler
US scans
26 participants
completed all US scans
18 participants
completed all Doppler
US scans
N=8 missing data for
Doppler scans
26 returnees at 12 weeks
32 responders
Bowen et al. Journal of Foot and Ankle Research 2010, 3:10
/>Page 6 of 9
effective in controlling the disease process in the RA par-
ticipants within this study, consistent with previous
reports [1,2].
Pragmatically, whilst patient reported foot symptoms
did significantly reduce, it may be hypothesized that
treatment switches off the disease process of RA, but
twelve weeks was not enough time for sonographic evi-
dence of MTP joint synovitis, synovial hypertrophy and
plantar bursal hypertrophy to regress within the forefeet.
In previous work, within the MCP joints of the hands a
reduction in sonographically detectable synovial hyper-
trophy was noted at eighteen weeks following infliximab
therapy, and this was reported as a significant reduction
at 110 weeks [2]. In explaining US detection of synovitis
within joints, Brown et al [28] report that synovium may
become chronically thickened and less reversible in
established disease. This was typically demonstrated
within our sample in which the majority of participants
had established RA with a mean duration of 11.1 years.
Using Doppler US 11.1% of MTP joints examined that
showed a positive US Doppler response at baseline had
none after twelve weeks, yet synovial hypertrophy
remained evident on US in 54.8% of MTP joints at twelve
weeks. This is consistent with a recent study where 42
joints (bilateral glenohumeral, elbows, wrists, MCPs,
proximal interphalangeal, knees, tibiotalar, midtarsal and
MTPs) were assessed with the most common joints with
US detectable synovitis being the wrist, hands and feet
and power Doppler US signal occurring less frequently in
the MTP joints [29].
Foot symptoms were not inclusion criteria within our
study, yet the high prevalence detectable by US was sur-
prising. There are suggestions that clinically evident dis-
ease improves more quickly following effective treatment
than disease assessed by modern imaging techniques
[11]. In a previous study of patients treated with anti-TNF
therapy, 90% demonstrated clinical remission at week 14,
but none had absence of imaging synovitis [29]. We can
infer this from our findings too, whereby a much higher
prevalence of US detectable plantar MTP joint synovial
hypertrophy and plantar forefoot bursal hypertrophy was
evident than that detectable by clinical examination at
both baseline and twelve weeks.
Of further note, in a minority of participants, clinical
disease activity and well being scores improved but the
prevalence of US detectable MTP joint synovial hypertro-
phy and plantar forefoot bursal hypertrophy increased.
This anomalous finding could be attributable to imper-
fect reproducibility of the US measurements, a reported
phenomenon in the use of US [30], although as technol-
Table 2: Comparison of the prevalence of MTP joint and foot specific US detectable and clinically detectable pathology of
the study participants at baseline and twelve weeks by frequency (N)
Variable Baseline 12 weeks Statistical Values
MTP joint synovial hypertrophy (US) R2 58.1% (18) 45.2% (14) p = 1.000
R5 74.2% (23) 51.6% (16) p = 0.344
L2 61.3% (19) 35.5% (11) p = 0.267
L5 67.7% (21) 54.8% (17) p = 0.754
MTP joint synovitis (Doppler US) R2 6.5% (2) 6.5% (2) p = 1.000
R5 9.7% (3) 3.2% (1) p = 0.625
L2 3.2% (1) 0% (0) p = 1.000
L5 9.7% (3) 6.5% (2) p = 1.000
MTP joint erosion (US) R2 25.8% (8) 25.8% (8) p = 0.250
R5 74.2% (23) 51.6% (16) p = 0.727
L2 9.7% (3) 12.9% (4) p = 1.000
L5 61.3% (19) 58.1% (18) p = 1.000
Plantar forefoot bursal hypertrophy (US) R 83.9% (26) 67.7% (21) p = 1.000
L 80.6% (25) 69.2% (18) p = 0.508
Clinically detectable plantar forefoot bursae R 41.9% (13) 32.3% (10) p = 0.012
L 35.5% (11) 19.4% (6) p = 0.453
Clinically detectable MTP joint synovitis R 45.2% (14) 25.8% (8) p = 0.375
L 25.8% (8) 16.1% (5) p = 0.070
Key: R = Right; L = Left; 2 = second MTP joint; 5 = fifth MTP joint
Bowen et al. Journal of Foot and Ankle Research 2010, 3:10
/>Page 7 of 9
ogy has improved reliability in US techniques have
improved [31]. Alternatively, although the MFPDI
improves with treatment, the questionnaire is developed
for foot complaints in general and does not focus on the
forefoot [19]. Therefore it is possible that the difference
between self-reported symptoms in US detectable signs
in the forefoot may also be attributable to a faster recov-
ery of other foot joints than the MTP joints. Increased
mechanical stresses, possibly as mobility improved for
those patients, rather than an increase in episodes of syn-
ovial hypertrophy and bursal hypertrophy due to the dis-
ease process of RA may also be the cause of prolonged US
detectable synovial hypertrophy within the forefeet.
Mechanical and gait data would have been useful to
explore this concept further. van der Leeden, Steultjens et
al [32] demonstrated correlations of radiographic MTP
joint deformity with peak pressure and pressure time
integrals for the first and fourth MTP joints and correla-
tions of high forefoot pressures with pain in RA partici-
pants. In a later systematic review of foot related
measures, van der Leeden, Steultjens et al [33] recom-
mend considering both self report and performance
based instruments when investigating foot problems
associated with RA. We chose to focus on clinical assess-
ment of foot pathology, foot disability and foot pain and
no account was taken of the mechanical forces of foot
function during gait as this was not feasible within the
confines of our study. Others, having investigated the
association between foot disabilities, mechanics of func-
tion and foot mechanics, recommend that future predic-
tion models may be enhanced by combining imaging
based identification of foot pathology with mechanical
data [4].
No techniques have yet been developed to detect differ-
ences between mechanically related inflamed hypertro-
phied synovium and active inflammatory synovium
related to disease activity in RA within the foot. Brown,
Conaghan et al [28] highlight that grey scale US primarily
detects hypertrophy of the synovium but does not differ-
entiate between inflammatory and non inflammatory
synovitis. For future studies the further use of power
Doppler US, Gadolinium enhanced MRI and/or biopsy
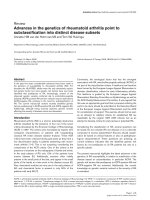
Figure 3 A simple bar chart representing the percentages of cases of US detectable forefoot bursal hypertrophy and MTP joint synovial
hypertrophy at baseline and following twelve weeks of anti-TNF therapy.
percentage of cases
bursal hypertrophy
presence
synovial hypertrophy
presence
baseline
12 weeks
83.3
75
67.5
54.8
100
50
0
Bowen et al. Journal of Foot and Ankle Research 2010, 3:10
/>Page 8 of 9
for histological analysis of forefoot pathology would be
needed to achieve this as well as the development of a
technique that includes the effect of foot mechanics.
This study has several strengths and a number of
potential limitations. Strengths include that it was a prag-
matic clinical study representative of secondary care in
the UK. In addition, a sample of patients with RA at the
same stage of treatment was investigated. Furthermore,
patient reported clinical outcomes including disease
activity and foot specific measures were used.
Potential limitations include the fact the presence of US
detectable MTP joint synovitis, synovial hypertrophy and
bursal hypertrophy within the forefoot was not validated
by any other 'gold standard' imaging technique, such as
Magnetic Resonance Imaging (MRI) or by histological
analysis through biopsy. Soft tissue swelling at the level of
the MTP joints in the plantar forefoot area can be related
to other pathology such as tenosynovitis or rheumatoid
nodules that could be better differentiated using MRI
[34,35]. Due to its restricted availability MRI was not fea-
sible for our study. Others have attempted to validate
imaging findings using fresh cadavers [36] however this
technique was also not a feasible option during our clini-
cal study.
Limitations relating to the sample and time frame also
have to be highlighted. The sample was relatively small;
therefore generalizibility to the whole population of
patients with RA needs to be confirmed. The time frame
of twelve weeks gave only two points of assessment over a
relatively short period. Although providing useful infor-
mation, more time points over a longer time period
would have allowed variations in individual foot states to
be monitored more effectively.
Conclusions
We have demonstrated that patient reported foot pain
and disability does reduce significantly following twelve
weeks of TNF inhibition. We have also provided some
evidence that suggests forefoot pathology in RA may
improve following a short period of TNF inhibition; how-
ever further evidence over a longer time period is
required to confirm that this is sustained. The findings
further indicate that the use of US imaging of the foot
would be more beneficial than clinical examination alone
in the refinement of diagnosis and the implementation of
effective care pathways for patients who have foot symp-
toms and are starting TNF inhibition.
List of abbreviations
TNF: Tumour necrosis factor; RA: Rheumatoid arthritis;
MTP: Metatarso-phalangeal; US: Ultrasound; MFPDI:
Manchester foot pain and disability index; SD: Standard
deviation; DMARDs: Disease modifying anti-rheumatic
drugs; ESR: Erythrocyte sedimentation rate; CRP: C-
reactive protein; DAS-28: Disease activity score of 28
swollen and tender joints; VAS: Visual analog scale; ACR:
American College of Rheumatology; EULAR: European
League Against Rheumatism; NICE: The National Insti-
tute for Health and Clinical Excellence; MRI: Magnetic
resonance imaging.
Competing interests
The authors declare that they have no competing interests.
Authors' contributions
CB conceived of the study, carried out the ultrasound foot study of patients
with RA treated with anti-TNF therapy, participated in the clinical assessment
of foot status and drafted the manuscript. CE participated in the design of the
study, carried out the assessment of eligibility of RA patients for anti-TNF ther-
apy and helped to draft the manuscript. LH participated in the data analysis
and helped to draft the manuscript. KD and MS participated in the design of
the study and performed the US assessments. SS participated in the study
design and coordination. JB participated in the design of the study and helped
to draft the manuscript. NA participated in the conception and design of the
study and helped to draft the manuscript. All authors read and approved the
final manuscript.
Author Details
1
School of Health Sciences, University of Southampton, Southampton, UK,
2
Research Development and Support Unit, University of Southampton,
Southampton, UK,
3
Ultrasound Department, Department of Radiology,
Southampton University Hospitals NHS Trust, Southampton General Hospital,
Southampton, UK,
4
Department of Rheumatology, Southampton University
Hospitals NHS Trust, Southampton General Hospital, Southampton, UK,
5
Wellcome Trust Clinical Research Facility, Southampton University Hospitals
Trust, Southampton General Hospital, Southampton, UK,
6
MRC Epidemiology
Resource Centre, University of Southampton, Southampton, UK and
7
NIHR
Musculoskeletal Biomedical Research Unit, University of Oxford, Oxford, UK
References
1. Hau M, Kneitz C, Tony HP, Keberle M, Jahns R, Jenett M: High resolution
ultrasound detects a decrease in pannus vascularisation of small finger
joints in patients with rheumatoid arthritis receiving treatment with
soluble tumour necrosis factor alpha receptor (etanercept). Ann
Rheum Dis 2002, 61:55-58.
2. Taylor PC, Steuer A, Gruber J, McClinton C, Cosgrove DO, Blomley MJ,
Marsters PA, Wagner CL, Maini RN: Ultrasonographic and radiographic
results from a two-year controlled trial of immediate or one-year-
delayed addition of infliximab to ongoing methotrexate therapy in
patients with erosive early rheumatoid arthritis. Arthritis Rheum 2006,
54:47-53.
3. van der Leeden M, Steultjens MP, Ursum J, Dahmen R, Roorda LD,
Schaardenburg DV, Dekker J: Prevalence and course of forefoot
impairments and walking disability in the first eight years of
rheumatoid arthritis. Arthritis Rheum 2008, 59:1596-1602.
4. Turner DE, Helliwell PS, Siegel KL, Woodburn J: Biomechanics of the foot
in rheumatoid arthritis: identifying abnormal function and the factors
associated with localised disease 'impact'. Clin Biomech (Bristol, Avon)
2008, 23:93-100.
5. Rojas-Villarraga A, Bayona J, Zuluaga N, Mejia S, Hincapie ME, Anaya JM:
The impact of rheumatoid foot on disability in Colombian patients
with rheumatoid arthritis. BMC Musculoskelet Disord 2009, 10:67.
6. Rome K, Gow PJ, Dalbeth N, Chapman JM: Clinical audit of foot problems
in patients with rheumatoid arthritis treated at Counties Manukau
District Health Board, Auckland, New Zealand. J Foot Ankle Res 2009,
2:16.
7. Otter SJ, Lucas K, Springett K, Moore A, Davies K, Cheek L, Young A, Walker-
Bone K: Foot pain in rheumatoid arthritis prevalence, risk factors and
management: an epidemiological study. Clin Rheumatol 29:255-271.
8. Grondal L, Tengstrand B, Nordmark B, Wretenberg P, Stark A: The foot: still
the most important reason for walking incapacity in rheumatoid
arthritis: distribution of symptomatic joints in 1,000 RA patients. Acta
Orthop 2008, 79:257-261.
Received: 1 March 2010 Accepted: 17 June 2010
Published: 17 June 2010
This article is available from: 2010 Bow en et al; licensee B ioMed Central Lt d. This is an Open Access article distributed under the terms of the Creative Commons Attribution License ( which permits unrestricted use, distribution, and reproduction in any medium, provided the original work is properly cited.Journal of Foot and Ankle Research 2010, 3:10
Bowen et al. Journal of Foot and Ankle Research 2010, 3:10
/>Page 9 of 9
9. Bowen CJ, Culliford D, Dewbury K, Sampson M, Burridge J, Hooper L,
Edwards CJ, Arden NK: The clinical importance of ultrasound detectable
forefoot bursae in rheumatoid arthritis. Rheumatology (Oxford) 2010 in
press.
10. Koski JM: Ultrasound detection of plantar bursitis of the forefoot in
patients with early rheumatoid arthritis. J Rheumatol 1998, 25:229-230.
11. Brown AK, Quinn MA, Karim Z, Conaghan PG, Peterfy CG, Hensor E,
Wakefield RJ, O'Connor PJ, Emery P: Presence of significant synovitis in
rheumatoid arthritis patients with disease-modifying antirheumatic
drug-induced clinical remission: evidence from an imaging study may
explain structural progression. Arthritis Rheum 2006, 54:3761-3773.
12. Wakefield RJ, Freeston JE, O'Connor P, Reay N, Budgen A, Hensor EM,
Helliwell PS, Emery P, Woodburn J: The optimal assessment of the
rheumatoid arthritis hindfoot: a comparative study of clinical
examination, ultrasound and high field MRI. Ann Rheum Dis 2008 in
press.
13. McNally EG: Ultrasound of the small joints of the hands and feet:
current status. Skeletal Radiol 2008, 37:99-113.
14. Iagnocco A, Perella C, Naredo E, Meenagh G, Ceccarelli F, Tripodo E, Basili
S, Valesini G: Etanercept in the treatment of rheumatoid arthritis:
clinical follow-up over one year by ultrasonography. Clin Rheumatol
2008, 27:491-496.
15. Saleem B, Brown AK, Keen H, Nizam S, Freeston J, Karim Z, Quinn M,
Wakefield R, Hensor E, Conaghan PG, Emery P: Disease remission state in
patients treated with the combination of tumor necrosis factor
blockade and methotrexate or with disease-modifying antirheumatic
drugs: A clinical and imaging comparative study. Arthritis Rheum 2009,
60:1915-1922.
16. Haavardsholm EA, Ostergaard M, Hammer HB, Boyesen P, Boonen A, van
der Heijde D, Kvien TK: Monitoring anti-TNFalpha treatment in
rheumatoid arthritis: responsiveness of magnetic resonance imaging
and ultrasonography of the dominant wrist joint compared with
conventional measures of disease activity and structural damage. Ann
Rheum Dis 2009, 68:1572-1579.
17. Arnett FC, Edworthy SM, Bloch DA, McShane DJ, Fries JF, Cooper NS,
Healey LA, Kaplan SR, Liang MH, Luthra HS, et al.: The American
Rheumatism Association 1987 revised criteria for the classification of
rheumatoid arthritis. Arthritis Rheum 1988, 31:315-324.
18. Prevoo ML, van't Hof MA, Kuper HH, van Leeuwen MA, van de Putte LB,
van Riel PL: Modified disease activity scores that include twenty-eight-
joint counts. Development and validation in a prospective longitudinal
study of patients with rheumatoid arthritis. Arthritis Rheum 1995,
38:44-48.
19. Garrow AP, Papageorgiou AC, Silman AJ, Thomas E, Jayson MI, Macfarlane
GJ: Development and validation of a questionnaire to assess disabling
foot pain. Pain 2000, 85:107-113.
20. Backhaus M, Burmester GR, Gerber T, Grassi W, Machold KP, Swen WA,
Wakefield RJ, Manger B: Guidelines for musculoskeletal ultrasound in
rheumatology. Ann Rheum Dis 2001, 60:641-649.
21. Scheel AK, Schmidt WA, Hermann KG, Bruyn GA, D'Agostino MA, Grassi W,
Iagnocco A, Koski JM, Machold KP, Naredo E, et al.: Interobserver
reliability of rheumatologists performing musculoskeletal
ultrasonography: results from a EULAR "Train the trainers" course. Ann
Rheum Dis 2005, 64:1043-1049.
22. Bowen CJ, Dewbury K, Sampson M, Sawyer S, Burridge J, Edwards CJ,
Arden NK: Musculoskeletal ultrasound imaging of the plantar forefoot
in patients with rheumatoid arthritis: inter-observer agreement
between a podiatrist and a radiologist. J Foot Ankle Res 2008, 1:5.
23. Backhaus M, Ohrndorf S, Kellner H, Strunk J, Backhaus TM, Hartung W,
Sattler H, Albrecht K, Kaufmann J, Becker K, et al.: Evaluation of a novel 7-
joint ultrasound score in daily rheumatologic practice: a pilot project.
Arthritis Rheum 2009, 61:1194-1201.
24. O'Connor PJ, Grainger AJ: Ultrasound imaging of joint disease. Imaging
2002, 14:188-201.
25. Balint PV, Mandl P, Kane D: "All that glistens is not gold" separating
artefacts from true Doppler signals in rheumatological ultrasound.
Ann Rheum Dis 2008, 67:141-142.
26. Gregg JM, Schneider T, Marks P: MR imaging and ultrasound of
metatarsalgia the lesser metatarsals. Radiol Clin North Am 2008,
46:1061-1078. vi-vii
27. NICE: Clinical Guidelines for Adalimumab, etanercept and infliximab for
the treatment of rheumatoid arthritis. In National Institute for Clinical
Excellence London; 2007.
28. Brown AK, Conaghan PG, Karim Z, Quinn MA, Ikeda K, Peterfy CG, Hensor
E, Wakefield RJ, O'Connor PJ, Emery P: An explanation for the apparent
dissociation between clinical remission and continued structural
deterioration in rheumatoid arthritis. Arthritis Rheum 2008,
58:2958-2967.
29. Wakefield RJ, Freeston JE, Hensor EM, Bryer D, Quinn MA, Emery P: Delay
in imaging versus clinical response: a rationale for prolonged
treatment with anti-tumor necrosis factor medication in early
rheumatoid arthritis. Arthritis Rheum 2007, 57:1564-1567.
30. Joshua F, Lassere M, Bruyn GA, Szkudlarek M, Naredo E, Schmidt WA, Balint
P, Filippucci E, Backhaus M, Iagnocco A, et al.: Summary findings of a
systematic review of the ultrasound assessment of synovitis. J
Rheumatol 2007, 34:839-847.
31. Cheung P, Ruyssen-Witrand A, Gossec L, Paternotte S, Le Bourlout C,
Mazieres M, Dougados M: Reliability of clinical self-evaluation of
swollen and tender joints in rheumatoid arthritis: A comparison study
with ultrasonography, physician and nurse assessments. Arthritis Care
Res 2010 in press.
32. van der Leeden M, Steultjens M, Dekker JH, Prins AP, Dekker J: Forefoot
joint damage, pain and disability in rheumatoid arthritis patients with
foot complaints: the role of plantar pressure and gait characteristics.
Rheumatology (Oxford) 2006, 45:465-469.
33. van der Leeden M, Steultjens MP, Terwee CB, Rosenbaum D, Turner D,
Woodburn J, Dekker J: A systematic review of instruments measuring
foot function, foot pain, and foot-related disability in patients with
rheumatoid arthritis. Arthritis Rheum 2008, 59:1257-1269.
34. Ashman CJ, Klecker RJ, Yu JS: Forefoot pain involving the metatarsal
region: differential diagnosis with MR imaging. Radiographics 2001,
21:1425-1440.
35. Studler U, Mengiardi B, Bode B, Schottle PB, Pfirrmann CW, Hodler J,
Zanetti M: Fibrosis and adventitious bursae in plantar fat pad of
forefoot: MR imaging findings in asymptomatic volunteers and MR
imaging-histologic comparison. Radiology 2008, 246:863-870.
36. Theumann NH, Pfirrmann CW, Chung CB, Mohana-Borges AV, Haghighi P,
Trudell DJ, Resnick D: Intermetatarsal spaces: analysis with MR
bursography, anatomic correlation, and histopathology in cadavers.
Radiology 2001, 221:478-484.
doi: 10.1186/1757-1146-3-10
Cite this article as: Bowen et al., Improvement in symptoms and signs in the
forefoot of patients with rheumatoid arthritis treated with anti-TNF therapy
Journal of Foot and Ankle Research 2010, 3:10