Báo cáo y học: "Reliability of the TekScan MatScan® system for the measurement of plantar forces and pressures during barefoot level walking in healthy adults" potx
Bạn đang xem bản rút gọn của tài liệu. Xem và tải ngay bản đầy đủ của tài liệu tại đây (714.7 KB, 9 trang )
JOURNAL OF FOOT
AND ANKLE RESEARCH
Zammit et al. Journal of Foot and Ankle Research 2010, 3:11
/>Open Access
RESEARCH
© 2010 Zammit et al; licensee BioMed Central Ltd. This is an Open Access article distributed under the terms of the Creative Commons
Attribution License ( which permits unrestricted use, distribution, and reproduction in
any medium, provided the original work is properly cited.
Research
Reliability of the TekScan MatScan
®
system for the
measurement of plantar forces and pressures
during barefoot level walking in healthy adults
Gerard V Zammit*
1
, Hylton B Menz
1
and Shannon E Munteanu
1,2
Abstract
Background: Plantar pressure systems are increasingly being used to evaluate foot function in both research settings
and in clinical practice. The purpose of this study was to investigate the reliability of the TekScan MatScan
®
system in
assessing plantar forces and pressures during barefoot level walking.
Methods: Thirty participants were assessed for the reliability of measurements taken one week apart for the variables
maximum force, peak pressure and average pressure. The following seven regions of the foot were investigated; heel,
midfoot, 3
rd
-5
th
metatarsophalangeal joint, 2
nd
metatarsophalangeal joint, 1
st
metatarsophalangeal joint, hallux and the
lesser toes.
Results: Reliability was assessed using both the mean and the median values of three repeated trials. The system
displayed moderate to good reliability of mean and median calculations for the three analysed variables across all
seven regions, as indicated by intra-class correlation coefficients ranging from 0.44 to 0.95 for the mean and 0.54 to
0.97 for the median, and coefficients of variation ranging from 5 to 20% for the mean and 3 to 23% for the median.
Selecting the median value of three repeated trials yielded slightly more reliable results than the mean.
Conclusions: These findings indicate that the TekScan MatScan
®
system demonstrates generally moderate to good
reliability.
Background
During functional activities such as walking, the human
foot exerts a force upon the underlying surface, and in
turn, a force of equal magnitude and opposite direction is
exerted upon the foot. This force is commonly termed the
ground reaction force [1,2]. Technological advances in
pressure-sensing technology, enabling the quantification
of the vertical component of this force and the contact
area at different regions under the foot, have become
commercially available for research and clinical applica-
tions. This has enabled further insight into the plantar
loading characteristics of the foot during functional activ-
ities such as walking and running [3,4].
Elevated plantar pressures have been widely recognised
as a causative factor in the development of several pedal
pathologies, including the development of stress fractures
[5], plantar calluses [6,7] and neuropathic ulceration [8].
Factors shown to be associated with elevated plantar
pressures include forefoot deformity [9], increased heel
pad stiffness [10] and lesser toe deformity [11]. The anal-
ysis of plantar forces and pressures has also played an
integral role in the management of lower limb disorders.
Specifically, footwear modifications [12] and redistribu-
tive insoles [13] aimed at offloading areas of high pres-
sure prone to ulceration have been assessed for
effectiveness in patients with diabetic peripheral neurop-
athy.
Commercially available systems currently employed by
clinicians and researchers to assess dynamic plantar pres-
sures include in-shoe measurement systems (Novel
Pedar
®
, TekScan F-Scan
®
, RS-Scan Insole
®
and IVB Bio-
foot
®
) and platform systems (Novel Emed
®
and the RS-
Scan Footscan
®
) [14]. The validity of these measurement
systems has been documented throughout the literature,
suggesting they are able to accurately quantify dynamic
* Correspondence:
1
Musculoskeletal Research Centre, Faculty of Health Sciences, La Trobe
University, Victoria 3086, Australia
Full list of author information is available at the end of the article
Zammit et al. Journal of Foot and Ankle Research 2010, 3:11
/>Page 2 of 9
plantar loading patterns of the foot [15-19]. Validity of the
TekScan MatScan
®
system has been reported by the man-
ufacturer, displaying a mean percentage difference of
1.9% when compared against an AMTI force platform
(TekScan Incorporated, personal communication, 26/02/
2010) and has also been shown to be highly accurate in an
independent study which compared several commonly
used plantar pressure measurement systems [20]. How-
ever, to the authors knowledge, no study to date has
investigated the reliability of the TekScan MatScan.
®
As
this system is widely utilised by researchers and clinicians
it is essential that its reliability is adequately established.
Therefore, the primary aim of this study was to deter-
mine the reliability of the TekScan MatScan
®
system in
assessing plantar forces and pressures during level bare-
foot walking using a test-retest analysis of thirty healthy
asymptomatic participants. The secondary objective of
this study was to determine if the calculation of median
or mean values of plantar pressure and forces yielded
more reliable measurements between trials.
Methods
Participants
Thirty participants (n = 30) were recruited for assessment
from a university population. Participants included in the
study were healthy asymptomatic adults, aged between
18 and 40 years of age. The Human Studies Ethics Com-
mittee at La Trobe University, Victoria, Australia pro-
vided ethical approval for the study (FHEC07/08).
Written informed consent was obtained from all partici-
pants prior to data collection.
Age (years), gender, height (cm), weight (kg), body mass
index (BMI) (kg/m
2
), and foot posture using the 6 item
Foot Posture Index (FPI-6) were determined for each of
the study participants at baseline. The FPI-6 was applied
by one of the raters (GVZ) to quantify participant foot
posture as being either pronated, neutral, or supinated
[21]. This clinical assessment tool has been previously
shown to be a valid indicator of arch structure from foot
radiographs [22]. Reference values for interpretation of
results are as follows; -12 to -5 highly supinated, -4 to -1
supinated, 0 to 5 normal, 6 to 9 pronated and, 10 to 12
highly pronated [23].
Measurement apparatus
Plantar forces and pressures were recorded during level
barefoot walking using the TekScan MatScan
®
system
(Boston, MA, USA). The system consists of a 5 mm thick
floor mat (432 × 368 mm), comprising of 2288 resistive
sensors (1.4 sensors/cm
2
), and sampling data at a fre-
quency of 40 Hertz (Hz).
Procedure
The two-step gait initiation protocol was used to capture
dynamic plantar pressures, as it displays similar re-test
reliability to the commonly used midgait protocol, how-
ever requires fewer trials [24-26]. The two step method
involves striking the platform on the second step once a
constant velocity has been reached, and is suggested to
reproduce plantar force and pressure data that is reflec-
tive of foot function during gait. Trials were excluded and
repeated if the plantar pressure recording was not satis-
factorily positioned, the participant paused on the mat
whilst walking, or if the participant did not continue to
walk past the mat for more than two steps. Three trials of
the left foot were recorded for each participant, as this
number of trials has previously been found to be suffi-
cient in ensuring adequate reliability of force and pres-
sure data [27,28]. Plantar force and pressure
measurements were recorded at baseline, and repeated at
follow up one week later. A one week duration between
sessions was chosen to ensure participants' gait charac-
teristics remained reasonably consistent.
Maximum force, peak pressure and average pressure
were the parameters measured in this study at seven
regions of the foot. These three variables were assessed as
they are the standard outputs of the MatScan
®
system,
and peak plantar pressure in particular has been found to
be of importance in the development of pathological foot
problems such as ulceration [29] and osteoarthritis [30],
and determining the efficacy of treatment modalities
such as redistributive insoles [31] and therapeutic foot-
wear [32]. We used a mask with seven regions (heel, mid-
foot, 1
st
MPJ, 2
nd
MPJ, 3
rd
-5
th
MPJs, hallux and lesser toes)
to provide detailed information regarding the indepen-
dent function of different segments of the foot. We have
previously used this mask to examine age-related changes
in foot function [33], clinical predictors of plantar loading
in older people [34], and differences in plantar loading in
people with osteoarthritis of the 1
st
MPJ [35] and midfoot
[30].
Data processing
Following data collection, Research Foot
®
Version 5.24
was used to construct seven individual "masks" to deter-
mine maximum force (N), peak pressure (kPa) and aver-
age pressure (kPa) under the following regions of the foot:
heel, midfoot, 3
rd
-5
th
metatarsophalangeal joints
(MPJ345), 2
nd
metatarsophalangeal joint (MPJ2), 1
st
meta-
tarsophalangeal joint (MPJ1), hallux and the lesser toes
(Figure 1). An overall 'total' was also calculated for the
entire plantar surface area. To determine the reliability of
reapplying the masks between sessions, the primary
investigator (GVZ) constructed masks for 10 randomly
Zammit et al. Journal of Foot and Ankle Research 2010, 3:11
/>Page 3 of 9
selected participants, calculated maximum force values
for all seven regions of interest, and repeated the process
one week later without reference to the previous data.
Statistical analysis
Statistical analysis was conducted using SPSS Version 14
for Windows (SPSS, Inc., Chicago, IL, USA). Prior to
inferential analysis all data were explored for normality.
To maintain independence of data only the left foot of
each participant was chosen to be assessed [36]. Reliabil-
ity of mask application was assessed using intraclass cor-
relation coefficients (ICCs). Intra-session reliability was
assessed via the calculation of coefficients of variation
(CVs) and ICCs across the three repeated trials within the
same session. The analysis of absolute reliability provides
information regarding within trial variability expressed as
a percentage. Inter-session reliability was evaluated using
both relative reliability statistics (ICCs) and absolute reli-
ability statistics (mean differences, CVs, minimal detect-
able change [MDC] and 95% limits of agreement [95%
LoAs]) for (i) using the mean of three trials, and (ii) using
the median of three trials. Calculation of the mean
occurred by summating the values, then dividing by the
number of trials (3), whereas the median was defined as
the middle value of the three captured trials. The median
was calculated along with mean to deal with any data
which may potentially be skewed.
First, to assess for systematic differences between ses-
sions, paired t-tests were used to compare mean and
median values of maximum force, peak pressure and
average pressure for each individual region of the left
foot. Second, to assess relative reliability between ses-
sions ICCs (type 3, 1) were used. Interpretation of the
ICCs was conducted in accordance with suggestions of
Portney and Watkins [37], whereby values >0.75 indicate
good reliability, values ranging from 0.50 to 0.75 imply
moderate reliability and values <0.50 suggest poor reli-
ability. Finally, to assess absolute reliability between ses-
sions, CVs were calculated, providing information
regarding between-trial variability expressed as a per-
centage and enabling direct comparisons between vari-
ables measured in different units. The MDC, also
referred to as the smallest real difference, was calculated
to provide an indication of the change in score necessary
to assume a real change has occurred [38], and 95% LoAs
were calculated to provide lower and upper limits within
which the examiner can be 95% confident that the true
score lies [39]. If differences between baseline and follow-
up measurements were found, Cohen's d was calculated
to determine the magnitude of these differences. Cohen's
d is defined as the difference between 2 means divided by
the pooled standard deviation for the baseline and follow-
up values [40].
Results
Participant characteristics
Information describing participant characteristics is pre-
sented in Table 1. The overall mean age (SD) of partici-
pants was 28.2 (6.1) years (range 18 to 39 years) and the
mean BMI was 23.7 (3.0) kg/m
2
. Males comprised 60% (n
= 18) of the sample and participants exhibited a relatively
normal foot posture, as evidenced by a mean FPI score of
4.3 (3.3) [23].
Reliability of mask application
Intraclass correlation coefficient values demonstrated
good reliability with values ranging from 0.96 to 1.00
(Table 2).
Intra-session repeatability
Coefficients of variation and ICCs across the three
repeated trials within the one session ranged from 3 to
22% and 0.83 to 0.98 respectively for maximum force, 3 to
32% and 0.65 to 0.92 for peak pressure, and 6 to 27% and
0.49 to 0.98 for average pressure (Table 3). The midfoot
region demonstrated the largest variation between trials
for all three parameters.
Inter-session reliability - maximum force
The relative reliability between sessions when using the
mean of three measurements was good for the total area,
heel, midfoot, MPJ2, MPJ1 and lesser toes, as evidenced
by ICCs ranging from 0.76 to 0.95, and moderate for
Table 1: Participant characteristics.
Variable
Age (years) - mean (SD) 28.2 (6.1)
Gender (Male/Female) 18 M/12 F
Height (cm) - mean (SD) 174.0 (7.9)
Weight (kg) - mean (SD) 72.1 (12.0)
Body mass index (kg/m
2
) - mean (SD)
23.7 (3.0)
Foot Posture Index (FPI-6) - mean (SD) 4.3 (3.3)
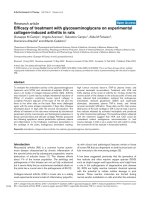
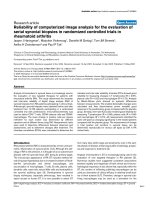
Figure 1 An example of a typical walking trial produced by the
TekScan MatScan
®
system, displaying the seven masked regions
used during analysis.
Zammit et al. Journal of Foot and Ankle Research 2010, 3:11
/>Page 4 of 9
MPJ345 and the hallux (ICCs of 0.72 and 0.71, respec-
tively). The relative reliability between sessions when
using the median of three measurements was good for all
seven regions, as evidenced by ICCs ranging from 0.79 to
0.97 (Table 4).
The absolute reliability of measurements between ses-
sions was determined using the CV, MDC and 95% LoA
statistics. When using the mean of three measurements,
CVs ranged from 5 to 16%, the MDC ranged from 24.52
to 91.01 N and the 95% LoAs ranged from -84.83 to
101.40 N. When using the median of three measure-
ments, CVs ranged from 3 to 17%, the MDC ranged from
25.50 to 70.12 N and the 95% LoAs ranged from -68.16 to
73.55 N.
The only region to display a significant mean difference
between sessions was the lesser toes (p = 0.01 when using
the mean of three measurements and p = 0.03 when using
the median of three measurements), where the percent-
age differences for the mean and median were both 10%.
Inter-session reliability - peak pressure
The relative reliability between sessions when using the
mean of three measurements was poor to moderate
(ICCs between 0.51 and 0.72) for the total area, heel, mid-
foot, and MPJ345, and good (ICCs between 0.75 and
0.82) for MPJ1, MPJ2, hallux and the lesser toes. The rela-
tive reliability between sessions when using the median of
three measurements was poor to good for the midfoot
and hallux (ICCs of 0.54 and 0.72, respectively) and good
(ICCs from 0.75 to 0.85) for the total area, heel, MPJ345,
MPJ2, MPJ1, and the lesser toes (Table 5).
When using the mean of three measurements, CVs
ranged from 6 to 22%, the MDC ranged from 362.84 to
774.72 kPa and the 95% LoAs ranged from -843.37 to
745.30 kPa. When using the median of three measure-
ments, CVs ranged from 3 to 23%, the MDC ranged from
225.55 to 617.81 kPa and the 95% LoAs ranged from -
608.01 to 647.23 kPa.
There were no systematic differences in mean values as
evidenced by paired t-tests for any of the regions
assessed.
Inter-session reliability - average pressure
The relative reliability between sessions when using the
mean of three measurements was good (ICCs between
0.75 and 0.88) for all regions except the midfoot, which
displayed poor reliability (ICC 0.44). The relative reliabil-
ity between sessions when using the median of three
measurements was moderate for MPJ345, MPJ2, and the
lesser toes (ICCs between 0.69 and 0.71) and good for the
total area, heel, midfoot, MPJ1 and the hallux (ICCs
between 0.77 and 0.88) (Table 6).
When using the mean of three measurements, CVs
ranged from 6 to 20%, the MDC ranged from 176.51 to
333.42 kPa and the 95% LoAs ranged from -353.03 to
343.23 kPa. When using the median of three measure-
ments, CVs ranged from 7 to 21%, the MDC ranged from
196.13 to 382.45 kPa and the 95% LoAs ranged from -
460.91 to 402.07 kPa.
Table 2: Intra-rater reliability of mask application, assessed with
the variable maximum force.
Region ICC (95% CI)
Total 1.00 (1.00 -1.00)
Heel 0.99 (0.98 - 0.99)
Midfoot 0.99 (0.98 - 0.99)
MPJ345 0.96 (0.85 - 0.99)
MPJ2 0.99 (0.96 - 0.99)
MPJ1 0.99 (0.96 - 0.99)
Hallux 0.99 (0.98 - 0.99)
Lesser toes 0.99 (0.97 - 0.99)
Table 3: Intra-session reliability (coefficients of variation [CoV], and intraclass correlation coefficients [ICC]) obtained from three repeated
trials.
Region Maximum force Peak pressure Average pressure
CoV (%) ICC (95% CI) CoV (%) ICC (95% CI) CoV (%) ICC (95% CI)
Total 3.4 0.98 (0.96 - 0.99) 3.5 0.92 (0.85 - 0.96) 5.9 0.98 (0.96 - 0.99)
Heel 4.7 0.97 (0.94 - 0.98) 6.9 0.90 (0.83 - 0.95) 12.9 0.66 (0.37 - 0.83)
Midfoot 22.1 0.96 (0.93 - 0.98) 31.7 0.69 (0.45 - 0.84) 27.4 0.49 (0.06 - 0.74)
MPJ345 16.1 0.83 (0.70 - 0.91) 10.8 0.82 (0.63 - 0.91) 11.8 0.91 (0.84 - 0.95)
MPJ2 15.0 0.75 (0.54 - 0.87) 5.9 0.91 (0.84 - 0.95) 11.9 0.78 (0.60 - 0.89)
MPJ1 19.2 0.72 (0.49 - 0.86) 17.2 0.84 (0.71 - 0.92) 14.4 0.75 (0.53 - 0.87)
Hallux 15.2 0.86 (0.75 - 0.93) 13.7 0.85 (0.73 - 0.92) 15.0 0.88 (0.79 - 0.94)
Lesser toes 21.1 0.92 (0.83 - 0.95) 25.1 0.65 (0.35 - 0.82) 15.6 0.88 (0.78 - 0.94)
Zammit et al. Journal of Foot and Ankle Research 2010, 3:11
/>Page 5 of 9
There were no systematic differences in mean values as
evidenced by paired t-tests for any of the regions
assessed.
Discussion
Information elicited from the analysis of plantar pres-
sures and forces during walking can be an integral com-
ponent in the formulation of patient intervention plans
[13]. Therefore, it is necessary to ensure that measure-
ment systems, such as the TekScan MatScan
®
which are
commonly employed in the research and clinical setting,
can accurately capture and reproduce plantar pressure
measures of dynamic foot function on different occa-
sions.
Intra-session repeatability was assessed for the three
variables of interest by calculating CVs between three tri-
als captured in a single session. The intra-session CVs for
the seven analysed regions ranged from 3 to 22% for max-
imum force, 4 to 32% for peak pressure and 6 to 27% for
average pressure. The midfoot and lesser toe regions dis-
played the greatest percentage differences for all three
variables, which is consistent with previous reports using
the Novel EMED
®
plantar pressure platform [19] and indi-
cates that these regions of the foot may be subject to
inherent variability during gait. However, the CV for the
total foot region for all three variables was relatively low
(maximum force: 3%; peak pressure: 4%; average pressure:
6%). It can therefore be concluded that while the total
force and pressure under the foot is relatively stable
between repeated trials within the same session, there is
greater variability within different regions of the foot.
Relative reliability was generally very high, with most
ICC values greater than 0.70. Maximum force was shown
to be the most reliable variable compared to peak pres-
sure and average pressure. The two different calculation
methods (the mean and median values of three trials) dis-
played moderate to good reliability for the variable maxi-
mum force throughout all seven regions (ICCs ranging
from 0.71 to 0.97), whereas peak pressure and average
pressure values were somewhat lower displaying poor to
moderate reliability (ICCs ranging from 0.51 to 0.87, and
0.44 to 0.84, respectively). With some exceptions, taking
the median of three trials, as opposed to taking the aver-
age of three trials generally resulted in slightly higher ICC
values for all three variables. This may possibly be attrib-
uted to median values not being influenced by outliers,
Table 4: Inter-session reliability of maximum force (N).
Mean of three trials
Region Session 1
mean (SD)
Session 2
mean (SD)
ICC (95% CI) CV (%) MDC 95% LoA
Total 665.38 (113.56) 654.50 (121.90) 0.92 (0.84 - 0.96) 5.1 91.01 -84.83 - 101.40
Heel 400.50 (70.21) 391.09 (88.16) 0.87 (0.75 - 0.94) 6.9 71.78 -66.69 - 85.51
Midfoot 111.31 (61.49) 108.56 (63.06) 0.95 (0.89 - 0.97) 13.2 39.72 -37.46 - 42.95
MPJ345 215.35 (56.88) 214.86 (52.07) 0.72 (0.49 - 0.85) 13.5 79.53 -80.02 - 81.10
MPJ2 149.94 (28.05) 147.98 (31.87) 0.76 (0.56 - 0.88) 9.9 40.01 -39.03 - 42.86
MPJ1 141.41 (41.58) 145.43 (36.19) 0.80 (0.61 - 0.90) 12.3 47.56 -52.86 - 44.72
Hallux 96.79 (26.38) 94.83 (25.40) 0.71 (0.47 - 0.85) 14.6 38.54 -36.97 - 40.80
Lesser toes* 52.56 (25.79) 58.55 (27.56) 0.92 (0.84 - 0.96) 5.1 24.52 -30.79 - 18.73
Median of three trials
Total 660.58 (119.64) 661.07 (115.03) 0.97 (0.94 - 0.99) 3.0 54.13 -54.92 - 55.80
Heel 393.54 (68.94) 397.86 (80.02) 0.91 (0.81 - 0.95) 5.8 59.23 -67.57 - 58.94
Midfoot 105.91 (62.17) 114.35 (65.51) 0.93 (0.85 - 0.96) 15.8 47.46 -56.88 - 39.81
MPJ345 218.09 (59.62) 215.45 (57.57) 0.81 (0.64 - 0.91) 11.8 70.12 -68.16 - 73.55
MPJ2 147.20 (29.81) 141.80 (31.68) 0.79 (0.62 - 0.89) 9.3 37.95 -42.76 - 33.93
MPJ1 141.02 (36.68) 141.12 (40.40) 0.79 (0.60 - 0.89) 12.5 48.25 -49.13 - 49.03
Hallux 98.48 (26.06) 93.65 (25.89) 0.78 (0.58 - 0.89) 12.8 33.93 -29.22 - 39.03
Lesser toes* 58.45 (30.90) 53.05 (27.07) 0.89 (0.78 - 0.95) 17.2 25.50 -21.08 - 32.07
* significant difference (p < 0.05) between session 1 and 2
Zammit et al. Journal of Foot and Ankle Research 2010, 3:11
/>Page 6 of 9
thus yielding a more reliable outcome. Therefore, the
authors recommend the use of the median value in place
of the mean value in future studies using the TekScan
MatScan
®
system.
Assessment for systematic differences between sessions
indicated that maximum force in the lesser toes region
exhibited a significant mean difference between sessions
for both average and median calculations (p = 0.01 and p
= 0.03, respectively). However, Cohen's d calculations
indicated only a relatively small effect (d = 0.23 and a
small percentage decrease of 10% for the mean, and d =
0.19 and a small percentage increase of 10% for the
median). The remainder of the seven regions across all
three variables did not display any systematic differences
in mean or median values when captured one week apart.
Findings from this study assessing the TekScan
MatScan
®
system are in agreement with those reported by
Gurney et al. [19] who assessed the reliability of the Novel
EMED-at
®
plantar pressure platform. Gurney et al. [19]
conducted a between-day study protocol (5 separate
days) assessing the reliability of nine asymptomatic par-
ticipants for 10 regions of the foot for the variables of
peak pressure, maximum force, impulse and contact
time. The study concluded that areas of relatively high
loading, such as the forefoot, showed higher reliability
(ICC >0.90) than areas of lesser loading, such as the
medial midfoot, which displayed lower reliability (ICC <
0.80). The Novel EMED-at
®
platform is similar to the Tek-
Scan MatScan
®
system, but has a slightly higher resolution
of 2 sensors/cm
2
in comparison to 1.4 sensors/cm
2
and a
slightly greater sampling frequency of 50 Hz in compari-
son to 40 Hz.
There are several limitations of this study that need to
be considered when interpreting the findings. First,
healthy young participants were recruited, so the reliabil-
ity of these measurements cannot necessarily be genera-
lised to other clinical populations. Confounding variables
such as pain in symptomatic populations may have a sig-
nificant impact upon the reproducibility of plantar mea-
surements taken one week apart. Second, unlike the
Novel EMED
®
system, which uses automated software to
apply the masks during data analysis, the TekScan
MatScan
®
requires a mask to be manually constructed and
applied to the plantar pressure outputs for each individ-
ual participant. The standardised mask (Figure 1) could
be altered in accordance to foot size and positioned with
reference to the three foot regions (rearfoot, midfoot and
forefoot) and anatomical landmarks (metatarsophalan-
Table 5: Inter-session reliability of peak pressure (kPa).
Mean of three trials
Region Session 1
mean (SD)
Session 2
mean (SD)
ICC (95% CI) CV (%) MDC 95% LoA
Total 2794.89 (382.45) 2726.24 (254.97) 0.58 (0.28 - 0.75) 7.6 549.17 -519.75 - 647.23
Heel 2500.69 (353.03) 2569.34 (509.94) 0.65 (0.39 - 0.82) 10.1 657.04 -774.72 - 647.23
Midfoot 912.01 (372.65) 843.37 (343.23) 0.72 (0.49 - 0.86) 21.5 519.75 -460.91 -588.39
MPJ345 2196.68 (362.84) 2245.72 (451.10) 0.51 (0.19 - 0.74) 12.9 774.72 -843.37 - 745.30
MPJ2 2637.98 (343.23) 2598.76 (362.84) 0.75 (0.54 - 0.87) 6.8 480.52 -451.10 - 529.55
MPJ1 1627.90 (441.29) 1735.77 (441.29) 0.87 (0.57 - 0.88) 12.5 578.59 -686.46 - 480.52
Hallux 1833.84 (421.68) 1775.00 (411.87) 0.78 (0.59 - 0.89) 10.8 539.36 -480.52 - 608.01
Lesser toes 990.47 (284.39) 1019.89 (372.65) 0.82 (0.65 - 0.91) 14.1 362.84 -421.68 - 362.84
Median of three trials
Total 1117.95 (186.32) 1186.60 (245.16) 0.81 (0.64 - 0.90) 3.1 225.55 -225.55 - 245.16
Heel 1314.09 (245.16) 1343.51 (225.55) 0.82 (0.66 - 0.91) 7.3 490.33 -509.94 - 578.59
Midfoot 500.13 (166.71) 500.13 (147.09) 0.54 (0.23 - 0.75) 23.3 558.97 -608.01 - 519.75
MPJ345 1274.86 (323.61) 1294.47 (254.97) 0.75 (0.54 - 0.87) 9.2 549.17 -529.55 - 588.39
MPJ2 1794.61 (382.45) 1824.03 (274.58) 0.78 (0.59 - 0.89) 7.3 529.55 -480.52 - 578.59
MPJ1 1127.76 (264.77) 1098.34 (225.55) 0.85 (0.72 - 0.93) 13.7 617.81 -608.01 - 647.23
Hallux 1049.31 (1255.25) 1059.11 (245.16) 0.72 (0.49 - 0.86) 10.7 519.75 -421.68 - 617.81
Lesser toes 558.97 (147.09) 578.59 (166.71) 0.79 (0.60 - 0.89) 16.8 441.29 -480.52 - 411.87
Zammit et al. Journal of Foot and Ankle Research 2010, 3:11
/>Page 7 of 9
geal joints, hallux and lesser digits). Although the mask
template for each participant is saved and reapplied to
subsequent trials, there is some potential for error result-
ing from different positioning of the foot between trials,
thereby necessitating adjustment of the mask template
upon application. This may affect the reliability of mea-
surements [41]. Third, the relatively low sampling fre-
quency (40 Hz) of the TekScan MatScan
®
system makes
this apparatus suitable for assessing walking trials only.
Due to the low sampling rate it has the potential to inac-
curately capture true peak data from more vigorous activ-
ities such as running. Fourth, although the relatively small
size of the TekScan MatScan
®
makes it portable and con-
venient it is unable to record consecutive steps and is lim-
ited to capturing only one plantar pressure recording, of
either the left or right foot during each trial. Fifth, the dis-
covery of the median value being reported to be more
reliable than that of the mean could suggest that the sen-
sor capabilities of this system are limited. Therefore, the
performance characteristics of the plantar pressure mat
sensors may be undesirable and should be interpreted
with caution [42]. Sixth, previous work has shown that
while the two-step gait initiation protocol we used pro-
vides similar forefoot peak pressure values to those
obtained with the midgait protocol, rearfoot loading is
reduced [43]. As such, rearfoot loading parameters need
to be interpreted with some caution when using the two
step protocol. Finally, the system under review is pre-
dominantly used to assess barefoot walking. Therefore it
may be more suitable to implement an in-shoe pressure
measurement system to assess plantar pressures associ-
ated with interventions such as insoles or therapeutic
footwear.
Future investigations should now explore differences in
plantar pressures and forces in a variety of other foot
pathologies with consideration of the reliability values
obtained in this study. The authors now intend to use the
TekScan MatScan
®
measurement apparatus to assess
changes in plantar pressures and forces in people with
hallux limitus/rigidus following treatment [44].
Conclusion
The results of this study indicate that the TekScan
MatScan
®
system is a reliable instrument for assessing
plantar forces and pressures during barefoot level walking
in healthy participants taken one week apart. The system
generally displayed moderate to good reliability for the
three analysed variables of maximum force, peak pressure
Table 6: Inter-session reliability of average pressure (kPa).
Mean of three trials
Region Session 1
mean (SD)
Session 2
mean (SD)
ICC (95% CI) CV (%) MDC 95% LoA
Total 1137.57 (196.13) 1176.79 (215.74) 0.84 (0.68 - 0.92) 7.4 235.35 -264.77 - 205.93
Heel 1343.51 (215.74) 1333.70 (245.16) 0.82 (0.65 - 0.91) 7.3 264.77 -264.77 - 274.58
Midfoot 500.13 (127.48) 529.55 (147.09) 0.44 (0.10 - 0.69) 20.0 284.39 -313.81 - 254.97
MPJ345 1255.25 (196.13) 1265.05 (196.13) 0.75 (0.55 - 0.88) 7.8 274.58 -284.39 - 264.77
MPJ2 1755.39 (254.97) 1745.58 (264.77) 0.78 (0.58 - 0.59) 6.9 333.42 -333.42 - 343.23
MPJ1 1117.95 (245.16) 1117.95 (245.16) 0.88 (0.76 - 0.94) 7.7 235.35 -245.16 - 235.35
Hallux 1049.31 (245.16) 1059.11 (245.16) 0.75 (0.55 - 0.88) 11.5 333.42 -353.03 - 313.81
Lesser toes 578.59 (147.09) 578.59 (147.09) 0.81 (0.64 - 0.90) 11.2 176.51 -176.51 - 186.32
Median of three trials
Total 2716.44 (254.97) 2706.63 (225.55) 0.88 (0.76 - 0.94) 8.3 245.16 -333.42 - 196.13
Heel 2432.04 (372.65) 2441.85 (382.45) 0.78 (0.59 - 0.89) 7.5 274.58 -304.00 - 245.16
Midfoot 843.37 (392.26) 882.59 (402.07) 0.75 (0.53 - 0.87) 21.5 294.19 -304.00 - 294.19
MPJ345 2167.26 (343.23) 2196.68 (372.65) 0.69 (0.44 - 0.84) 11.4 382.45 -431.49 - 392.26
MPJ2 2647.79 (353.03) 2598.76 (333.42) 0.69 (0.44 - 0.84) 8.6 382.45 -460.91 - 402.07
MPJ1 1637.71 (451.10) 1657.32 (480.52) 0.77 (0.57 - 0.88) 8.5 254.97 -235.35 - 284.39
Hallux 1814.23 (382.45) 1716.16 (392.26) 0.77 (0.56 - 0.88) 12.9 372.65 -392.26 - 362.84
Lesser toes 970.85 (274.58) 931.63 (313.81) 0.71 (0.47v0.85) 12.6 196.13 -225.55 - 176.51
Zammit et al. Journal of Foot and Ankle Research 2010, 3:11
/>Page 8 of 9
and average pressure throughout all seven assessed
regions, with the exception of the mean average pressure
value for the midfoot. Given the slightly higher reliability
obtained from using the median compared to the mean of
three repeated trials, the authors suggest that the median
value is used for analysis. Overall, the TekScan MatScan
®
system was found to exhibit similar reliability to other
commercially available plantar pressure measurement
systems and is suitable for use in the clinical and research
setting.
Competing interests
GVZ has no competing interests to declare. HBM is Editor-in-Chief and SEM is
Assistant Editor of the Journal of Foot and Ankle Research. It is journal policy
that editors are removed from the peer review and editorial decision-making
processes for papers they have authored or co-authored.
Authors' contributions
GVZ, HBM and SEM all conceived and designed the study. GVZ collected and
analysed the data. GVZ drafted the manuscript with the assistance of both
HBM and SEM. All three authors approved the final manuscript.
Acknowledgements
This study was partly funded by the NHMRC Centre for Clinical Research Excel-
lence in Gait Analysis and Rehabilitation. GVZ is currently a La Trobe University
Postgraduate Award Scholarship student. HBM is currently a National Health
and Medical Research Council fellow (Clinical Career Development Award, ID:
433049).
Author Details
1
Musculoskeletal Research Centre, Faculty of Health Sciences, La Trobe
University, Victoria 3086, Australia and
2
Department of Podiatry, Faculty of
Health Sciences, La Trobe University, Victoria 3086, Australia
References
1. Cavanagh PR: Ground reaction forces in human locomotion. J Biomech
1979, 12(8):630-630.
2. Hurkmans HLP, Bussmann JBJ, Selles RW, Horemans HLD, Benda E, Stam
HJ, Verhaar JAN: Validity of the Pedar Mobile system for vertical force
measurement during a seven-hour period. J Biomech 2006,
39(1):110-118.
3. Sneyers CJ, Lysens R, Feys H, Andries R: Influence of malalignment of feet
on the plantar pressure pattern in running. Foot Ankle Int 1995,
16:624-632.
4. Munro CF, Miller DI, Fuglevand AJ: Ground reaction forces in running: A
re-examination. J Biomech 1987, 20(2):147-155.
5. Nagel A, Fernholz F, Kibele C, Rosenbaum D: Long distance running
increases plantar pressures beneath the metatarsal heads: a barefoot
walking investigation of 200 marathon runners. Gait Posture 2008,
27(1):152-155.
6. Potter J, Potter M: Regrowth patterns of plantar callus. The Foot 2000,
10:144-148.
7. Menz HB, Zammit GV, Munteanu SE: Plantar pressures are higher under
callused regions of the foot in older people. Clin Exp Dermatol 2007,
32(4):375-380.
8. Veves A, Murray HJ, Young MJ, Boulton AJM: The risk of foot ulceration in
diabetic patients with high foot pressure: a prospective study.
Diabetologia 1992, 35:660-663.
9. Minns R, Craxford A: Pressure under the forefoot in rheumatoid arthritis.
A comparison of static and dynamic methods of assessment. Clin
Orthop Relat Res 1984, 187:235-242.
10. Jahss M, Kummer F, Michelson J: Investigations into the fat pads of the
sole of the foot: heel pressure studies. Foot Ankle 1992, 13(5):227-232.
11. Bus SA, Maas M, de Lange A, Michels RPJ, Levi M: Elevated plantar
pressures in neuropathic diabetic patients with claw/hammer toe
deformity. J Biomech 2005, 38(9):1918-1925.
12. Bus S, van Deursen R, Kanade R, Wissink M, Manning E, van Baal J, Harding
K: Plantar pressure relief in the diabetic foot using forefoot offloading
shoes. Gait Posture 2008, 29(4):618-622.
13. Viswanathan V, Madhavan S, Gnanasundaram S, Gopalakrishna G, Das BN,
Rajasekar S, A R: Effectiveness of different types of footwear insoles for
the diabetic neuropathicfoot: a follow-up study. Diabetes Care 2004,
27(2):474-477.
14. Orlin M, McPoil T: Plantar pressure assessment. Phys Ther 2000,
80:399-409.
15. Murphy D, Beynnon B, Michelson J, Vacek P: Efficacy of plantar loading
parameters during gait in terms of reliability, variability, effect of
gender and relationship between contact area and plantar pressure.
Foot Ankle Int 2005, 26(2):171-179.
16. Maluf K, Morley R, Richter E, Klaesner J, Mueller M: Monitoring in-shoe
plantar pressures, temperature, and humidity: reliability and validity of
measures from a portable device. Arch Phys Med Rehabil 2001,
82(8):1119-1127.
17. Barnett S, Cunningham J, West S: A comparison of vertical force and
temporal parameters produced by an in-shoe pressure measuring
system and a force platform. Clin Biomech 2001, 16(4):353-357.
18. Kernozek T, Zimmer K: Reliability and running speed effects of in-shoe
loading measurements during slow treadmill running. Foot Ankle Int
2000, 21(9):749-752.
19. Gurney JK, Kersting UG, Rosenbaum D: Between-day reliability of
repeated plantar pressure distribution measurements in a normal
population. Gait Posture 2008, 27(4):706-709.
20. Giacomozzi C: Appropriateness of plantar pressure measurement
devices: A comparative technical assessment. Gait Posture 2010 in
press.
21. Redmond AC, Crosbie J, Ouvrier RA: Development and validation of a
novel rating system for scoring standing foot posture: The Foot
Posture Index. Clin Biomech 2006, 21:89-98.
22. Menz HB, Munteanu SE: Validity of 3 clinical techniques for the
measurement of static foot posture in older people. J Orthop Sports
Phys Ther 2005, 35:479-486.
23. Redmond AC, Crane YZ, Menz HB: Normative values for the Foot Posture
Index. J Foot Ankle Res 2008, 1:6.
24. Bryant A, Singer K, Tinley P: Comparison of the reliability of plantar
pressure measurements using the two-step and midgait methods of
data collection. Foot Ankle Int 1999, 20:646-650.
25. Oladeji O, Stackhouse C, Gracely E, Orlin M: Comparison of the two-step
and midgait methods of plantar pressure measurement in children. J
Am Podiatr Med Assoc 2008, 98(4):268-277.
26. Bus SA, Lange Ad: A comparison of the 1-step, 2-step, and 3-step
protocols for obtaining barefoot plantar pressure data in the diabetic
neuropathic foot. Clin Biomech 2005, 20(19):892-899.
27. vanderLeeden M, Dekker JHM, Siemonsma PC, Lek-Westerhof SS,
Steultjens MPM: Reproducibility of plantar pressure measurements in
patients with chronic arthritis: A comparison of one-step, two-step,
and three-step protocols and an estimate of the number of
measurements required. Foot Ankle Int 2004, 25:739-744.
28. Hughes J, Pratt L, Linge K, Clark P, Klenerman L: Reliability of pressure
measurements: the EMED-F system. Clin Biomech 1991, 6:14-18.
29. Maluf K, Mueller M: Comparison of physical activity and cumulative
plantar tissue stress among subjects with and without diabetes
mellitus and a history of recurrent plantar ulcers. Clin Biomech 2003,
18:567-575.
30. Menz H, Munteanu S, Zammit G, Landorf K: Foot structure and function
in older people with radiographic osteoarthritis of the medial midfoot.
Osteoarthritis Cartilage 2010, 18:317-322.
31. Lott D, Hastings M, Commean P, Smith K, Mueller M: Effect of footwear
and orthotic devices on stress reduction and soft tissue strain of the
neuropathic foot. Clin Biomech 2007, 22(3):352-359.
32. Lord M, Hosein R: Pressure redistribution by molded inserts in diabetic
footwear: a pilot study. J Rehabil Res Dev 1994, 31:214-221.
33. Scott G, Menz HB, Newcombe L: Age-related differences in foot
structure and function. Gait Posture 2007, 26:68-75.
Received: 2 December 2009 Accepted: 18 June 2010
Published: 18 June 2010
This article is available from: 2010 Zammit et al; licensee BioMed Central Ltd. This is an Open Access article distributed under the terms of the Creative Commons Attribution License ( ), which permits unrestricted use, distribution, and reproduction in any medium, provided the original work is properly cited.Journal of Foot and Ankle Research 2010, 3:11
Zammit et al. Journal of Foot and Ankle Research 2010, 3:11
/>Page 9 of 9
34. Menz HB, Morris ME: Clinical determinants of plantar forces and
pressures during walking in older people. Gait Posture 2006,
24(2):229-236.
35. Zammit G, Menz H, Munteanu S, Landorf K: Plantar pressure distribution
in older people with osteoarthritis of the first metatarsophalangeal
joint (hallux limitus/rigidus). J Orthop Res 2008, 26(12):1665-1669.
36. Menz HB: Analysis of paired data in physical therapy research: time to
stop double-dipping? J Orthop Sports Phys Ther 2005, 35(8):477-478.
37. Portney LG, Watkins MP: Foundations of Clinical Research - Applications
to Practice. Conneticut: Appleton and Lange; 1993.
38. Beckerman H, Roebroeck ME, Lankhorst GJ, Becher JG, Bezemer PD, ALM
V: Smallest real difference, a link between reproducibility and
responsiveness. Qual Life Res 2001, 10:571-578.
39. Bland JM, Altman DG: Statistical methods for assessing agreement
between two methods of clinical measurement. Lancet 1986,
1(8476):307-310.
40. Cohen J: Statistical Power Analysis for the Behavioral Sciences. Hillsdale
NJ: Erlbaum; 1988.
41. Deschampsa K, Birchb I, Innesb JM, Deslooverec K, Matricalia GA: Inter-
and intra-observer reliability of masking in plantar pressure
measurement analysis. Gait Posture 2009, 30(3):379-382.
42. Urry S: Plantar pressure-measurement sensors. Meas Sci Technol 1999,
10:R16-R32.
43. Wearing SC, Urry S, Smeathers JE, Battistutta D: A comparison of gait
initiation and termination methods for obtaining plantar foot
pressures. Gait Posture 1999, 10:255-263.
44. Munteanu S, Menz H, Zammit G, Landorf K, Handley C, Elzarka A, Deluca J:
Efficacy of intra-articular hyaluronan (Synvisc(R)) for the treatment of
osteoarthritis affecting the first metatarsophalangeal joint of the foot
(hallux limitus): study protocol for a randomised placebo controlled
trial. J Foot Ankle Res 2009, 16(2):2.
doi: 10.1186/1757-1146-3-11
Cite this article as: Zammit et al., Reliability of the TekScan MatScan® system
for the measurement of plantar forces and pressures during barefoot level
walking in healthy adults Journal of Foot and Ankle Research 2010, 3:11