Báo cáo y học: "The use of 3D surface scanning for the measurement and assessment of the human foot" doc
Bạn đang xem bản rút gọn của tài liệu. Xem và tải ngay bản đầy đủ của tài liệu tại đây (324.16 KB, 9 trang )
REVIEW Open Access
The use of 3D surface scanning for the
measurement and assessment of the human foot
Scott Telfer
*
, James Woodburn
Abstract
Background: A number of surface scanning systems with the ability to quickly and easily obtain 3D digital
representations of the foot are now commercially available. This review aims to present a summary of the reported
use of these technologies in footwear development, the design of customised orthotics, and investigations for
other ergonomic purposes related to the foot.
Methods: The PubMed and ScienceDirect databases were searched. Reference lists and experts in the field were
also consulted to identify additional articles. Studies in English which had 3D surface scanning of the foot as an
integral element of their protocol were included in the review.
Results: Thirty-eight articles meeting the search criteria were included. Advantages and disadvantages of using 3D
surface scanning systems are highlighted. A meta-analysis of studies using scanners to investigate the changes in
foot dimensions during varying levels of weight bearing was carried out.
Conclusions: Modern 3D surface scanning systems can obtain accurate and repeatable digital representations of
the foot shape and have been successfully used in medical, ergonomic and footwear development applications.
The increasing affordability of these systems presents opportunities for researchers investigating the foot and for
manufacturers of foot related apparel and devices, particularly those interested in producing items that are
customised to the individual. Suggestions are made for future areas of research and for the standardization of the
protocols used to produce foot scans.
Background
The use of 3D surface scanning technologi es to pro duce
digitised representations of parts of the human anatomy
has the potential to help change the way a wide range
of products are designed and fabricated [1]. Until
recently, the anthropometric databases that are used by
designers and manufacturers to guide the ergonomic
form of their products have primarily been based on 1D
and 2D measurements, for example leg length or waist
girth [2]. This approach results in approximations being
made when designing to b ody areas for which an easily
defined measurement is not available. Databases that
draw upon 3D scans can off er far more detailed infor-
mation on the contours of the body and potentially pro-
vide an insight into changes in anthropometric
measuremen ts associated with dynamic movement.
Indeed, initiatives such as the CAESAR study (Civilian
American and European Surface Anthropometry
Resource) [3] have been carried out with th e aim of col-
lecting this type of information. 3D surface scanning has
the potential to play an important role in the develop-
ment of customised products, i.e. devices and apparel
that are designed for the individual using their precise
anthropometric measurements [4,5].
In the case of the foot, quantitative description of its
shape is important for a number of different applica-
tions relating to the ergonomic design of footwear, foot
orthotics and insoles, and for research into and clin ical
assessment of foot deformities, such as those associated
with rheumatoid arthritis [6-9]. Additionally, because
the foot is a flexible and complex structure, a better
understanding of how its shape changes in different
situations, for example in the different loading phases of
the gait cycle, may lead to improvements in the overall
comfort and functionality of the footwear and devices
that are been produced [10].
* Correspondence:
School of Health, Glasgow Caledonian University, Cowcaddens Road,
Glasgow, G4 0BA, UK
Telfer and Woodburn Journal of Foot and Ankle Research 2010, 3:19
/>JOURNAL OF FOOT
AND ANKLE RESEARCH
© 2010 Telfer and Woodburn; licensee BioMed Central Ltd. This is an Op en Access article distributed under the terms o f the Creative
Commons Attribution License ( which permits unrestricted use, distribution, and
reproduction in any medium, provided the original work is proper ly cited.
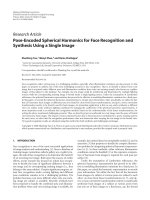
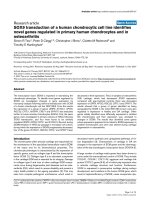
There are now a number of surface scanning systems
(costing between €5,000 and €30,000) available which can
scan the plantar surface of the foot or the leg and foot (see
Figure 1). This produces a 3D representation of its shape
that can be viewed and analysed on a computer. Software
programs which allow these 3D models to be used as the
basis for shoe or foot orthotic design and integrate with
computer controlled manufacturing systems are now
widely available. This has meant that a number of foot-
wear companies are now using integrated customisation
systems to produce customer-specific shoes [11], and simi-
larly there are now manufacturers providing customised
foot orthotics that are based directly upon a scan of the
patient’s foot shape [12,13]. While the current volumes of
these goods are relatively low, it is thought that as the
price and lead times for these items fall their share of the
market will increase [14].
The aim of this review is to summarise the ways 3D
scannin g technologies have been used in research relat-
ing to the design of customised foot orthotics and foot-
wear, and for the anthropometric measurement and
assessment of the foot.
Methods
Search strategy
Initial searches for this review were carried out in March/
April 2010 in the PubMed, and ScienceDirect databases.
Reference lists were examined and experts in the field
consulted for additional related articles. Inclusion criteria
were that 3D surface scanning of the foot was an integral
part of the study protocol, the article was written in Eng-
lish and that it was from a peer reviewed publication or
conference proceedings. From the original database
searches 141 unique articl es were identified, 19 of which
met the inclusion criteria (table 1). An additional 18 arti-
cles meeting the inclusion criteria were identified from
other sources.
Results
Scanning/digitising
The latest technologies a vailable to produce 3D repre-
sentations of the foot can be split into two loose cate-
gories: scanners and digitisers. Scanning is a process
where 3D images are converted to digital form using
optical or video equipment; and digitising involves the
3D shape having its features traced and stored as digital
codes on a computer. Scanning differs fr om digitising in
that entire pages of data are captured at once, whereas
with digitising discreet points are entered one at a time.
In many modern systems the line between the two tech-
nologies has be come somewhat blurred and for the pu r-
posesofthisreviewnoparticular distinction has been
drawn between foot scanners using the differing
approaches. Additionally, systems that can capture the
3D shape of the foot during motion have recently
become available, meaning that foot scanners can also
be divided into dynamic and static types. The latest
research using both types is covered in this review.
Figure 1 Scan of the foot (taken using Easy-Foot-Scan from
OrthoBaltic (Kaunas, Lithuania).
Table 1 Search strategy
PubMed
Search term Results Relevant Reference numbers
3D foot scan* 3 3 [8,50,53]
Foot digitizer 13 1 [23]
Foot digitiser 2 0
Foot surface scan* 2 1 [45]
Foot shape scan* 62 6 [6,19-21,23,32]
Foot shape digiti* 14 2 [23,25]
Foot weight bearing scan 41 0
Foot anthro* scan 0 0
ScienceDirect
3D foot scan* 20 4 [5,16,17,49]
Foot digitizer 5 0
Foot digitiser 0 0
Foot surface scan* 64 5 [17,33,40,49,53]
Foot shape scan* 20 3 [17,40,49]
Foot shape digiti* 9 1 [12]
Foot weight bearing scan 5 0
Foot anthro* scan 7 2 [5,16]
Telfer and Woodburn Journal of Foot and Ankle Research 2010, 3:19
/>Page 2 of 9
Foot measurements
Linear measurements
The most common foot measurements taken are those
made by shoe retailers who use the length of the foot in
order to sell their customers the closest fitting shoe
from their stocked range of sizes. These sizes are
defined by v arious national and continental sizing sys-
tems [15,16]. Retailers may use a Brannock device
which, as well as length, can also measure width and arc
length of the foot. Depending on the retailer/country
however, a simpler device which measures only length
may be used. In general, for reasons of economy foot-
wear manufacturers tend only to provide a standard
width and height associated with each shoe size.
There is some variation as to the approaches and ana-
tomical landmarks are used to define foot length. Typi-
callyitistakenasbeingfromthepterniontothetipof
the second toe but on the Brannock device it is defined
by using an axis orientation by a line joining the pter-
nion and a point 38.1 mm lateral to the media l edge of
the first metatarsal head. There are some limitations
with many of the standard measurement conventions,
mainly relating to when the foot being measu red fea-
tures a deformity such as hallux valgus [16].
An international standard, ISO 2 0685, has been pro-
duced with the aim of ensuring that measurements
taken using 3D scanning systems are comparable with
those taken using traditional methods and can be used
in anthropome tric databases. This standard is limited to
measurements of foot length and breadth, and requires
that the maximum mean difference between the tradi-
tional and 3D scanning derived values is 2 mm. Most
modern foot scanners however claim to have sub-
millimetre accuracy.
Methodolo gies for automatically generating foot mea-
surement data from 3D digitisations have been pro-
duced [16,17]. After corre ction for systematic e rrors,
Witana et al [16] were able to show that there were no
significant differences between the automatically gener-
ated measurements and those taken manually. Prior to
the measurements being generated, the foot scans need
to be aligned in order for the measurements to be
repeatable, and research has been carried out investigat-
ing the variation resulting from the different processes
that can be used to achieve this [18]. The findings from
this work suggested that the measurements are sensitive
to the alignment process used and the a uthors recom-
mended that dimensions should be based on anatomical
landmarks that are independent of the registration
process.
Investigations have been carried out using 3D scan-
ning in an attempt to provide information relevant to
shoe designer s. A la rge study was carried out by Krau ss
et al [19] who used the data generated to categorise the
foot into different types: volumin ous, flat pointed and
slender. A similar study by the same group involved the
scanning of the feet of 2867 children a nd again the
authors were able to categorise the results into three
foottypes[20].Luoetal[21]used3Dscanningto
assess the differences in male and female feet and found
that men tend to have longer and wider feet than
women, in line with results from prev ious studies that
took manual measurements [22].
Changes due to weight bearing
A research area where 3D scanners and digitisers have
been utilised is in measuring the changes that occur to
foot shape between non-weight bearing and weight
bearing states.
When loaded, there are a number of anthropometric
changes that occur in the foot. Several studies have
investigated these changes, the majority simply measur-
ing the differences under varying loading conditions
using traditional methods. In recent years 3D s canners
have been used for this purpose, either by directly scan-
ning the foot while loaded [23,24], or by scanning casts
of it that were taken while weight was applied [25].
Selected results from these studies are summarised and
combined in Table 2. It has been suggested that this
approach to making the anthropometric measurements
can potentially reduce errors resulting from skin displa-
cement and tissue distortion that can occur when using
callipers or other measuring tools.
Table 2 Selected results from studies using 3D scanners to measure anthropometric changes in the foot under weight
bearing conditions
Percentage change in parameter
Foot shape parameter Load Houston et al (40 feet) [38] Tsung et al (16 feet) [39] Xiong et al (60 feet) [40] Mean
Length HWB +1.7% +2.7% +1.1% (M 1.1%, F1.1%) +1.53%
FWB +2.2% +3.4% +1.4% (M1.3%; F1.5%) +1.95%
Ball width HWB +3.8% +2.9% +2.2% (M2.6%; F 1.7%) +2.85%
FWB +4.3% +6% +2.6% (M3.1%; F2%) +3.66%
Heel width HWB +4.8% +5.9% +1.1% (M1.4%; F0.8%) +3.04%
FWB +4.8% +8.7% +1.6% (M1.8%; F1.3%) +3.68%
Percentage changes relate to bas eline measurements taken of the unloaded foot, HWB: half weight bearing; FWB: full weight bearing.
Telfer and Woodburn Journal of Foot and Ankle Research 2010, 3:19
/>Page 3 of 9
Overall, the combined results from the studies using
3D scanners compare favourably with the previous lit-
erature, reinforcing findings from studies using other
measuring techniques suggesting that the increases in
length and b readth between unloaded and half loaded
are greater than those found between half and full
weight bearing [26]. Variation in the results between
studies could be related to differences in the populations
the study sample was drawn from and protocol used to
obtain the measurements. For example, Tsung et al took
their measurements from a cast of the foot rather than
a direct scan, and it is possible that this could have had
some effect on foot shape or in the measurement and
this could explain why, in particular, the heel width
value was found to be so much greater in that study.
The amount of variation between studies in the results
between studies does suggest that the protocol used to
scan the foot and acquire the data has a strong influence
on the outcome measurements and that this should be
standardised where possible.
Girth measurements
Beyond the relatively simple length and width measure-
ments, it is necess ary to move back a stage to the fabri-
cation of the shoes themselves to find where more
comprehensive data on the overall foot shape are
required. Currently, the most common method of man-
ufacturing a shoe - whether customised or mass pro-
duced - requires a shoe last, which is the wooden or
metal model of the foot around which the materials that
form the shoe are shaped [27]. The development o f the
last requires a number of foot measurements in order
for it to accurately represent t he individual foot or the
average foot shape for a particular shoe size.
At the moment lasts tend to be manufactured by
experienced shoemakers. Attempts have been made to
modernise the design and manufactu re of lasts, using
computerised design to r eplace more variable artisan
skills. It is here that 3D scanning technologies provide
the opportunity to take an extensive range of measure-
ments from the digitisation of the foot or to use modern
fabrication techniques such as rapid prototyping to
manufacture a last based directly on the computer
model [28,29]. An early attempt was made by Bao et al
[30] to define an integrated system for the manufacture
of personalised shoe lasts that were to be used in the
design of orthopaedic shoes. This was based on the 3D
scanning of the fo ot followed by manufacture of the last
using CAM, and this basic approach is still followed in
shoe customisation today.
Traditional manufacturers of customis ed shoes us e a
tape measure to obtain girth measurements in an
attempt to provide a better fit [16]. Using a tape to
manually measure girth can be inaccurate as the irregu-
lar shape of the foot can mean t hat the tape is not in
contact with the surface the whole way around the foot.
However, because shoe last design has been successfully
based around these types of measurements for the past
century and earlie r, researchers using repres entations of
the foot developed from 3D scanning have, with some
success, sought to emulate the shape of the tape during
girth measurements using various algorithms in order to
include the non-contact areas [5,16].
Researchers have used 3D scanners to inv estigate the
quality of fit between foot and shoe. Nacher et al [31]
took foot scans o f 316 participants as well as their pre-
ferences regarding shoe fit and produced a model able
to predict fitting level with an accuracy of 65.7%. Witana
et al [32] scanned the lasts for four pairs of men’sshoes
and compared them to the foot scans of a group of
males, finding that there were significant differences
between the two shapes. The authors also proposed a
method of improving footwear fit through matching of
2D outlines of the scans and identifying areas where
there could potentiall y be fit problems. Wang [33] built
on this work by scanning a library of 10 shoe lasts and
developing a process for choosing the last from the
library that would be m ost suited for the individual
based on their ball girth, waist girth and instep girth of
their foot.
Luximon and Goonetilleke [6] have argued that the
foot shape can be modelled using just length, width,
height and a measure of the curvature of the metatarsal-
phalangeal joint in order to negate the use of 3D scan-
ners. Using these variables they were able to predict
individual foot shape to a mean accuracy of 2.4 mm.
While perhaps acceptable for the general populace, this
approach is not suitable for those with foot deformities
and further research is required to determine how accu-
rate the fit needs to be in order to affe ct comfort and
other biomechanical factors.
Plantar surface shape measurement
For a number of conditions, customised foot orthotics
have been shown to be more effective at reducing pain
and redistributing pressure than standard “off the shelf ”
orthotics [34]. Traditionally, customised foot orthotics
are fabricated by taking a plaster cast of the plantar sur-
face of the patient’s foot (the negative cast), making a
positive plaster cast of the foot by filling the negative
cast, and then moulding the orthotic around the positive
cast to obtain a high quality fit [35]. The positive cast
can be altered either by removing or adding plaste r to it
so that, for example, the orthotic will take pressure
away from certain areas of the foot or provide support
to the arch.
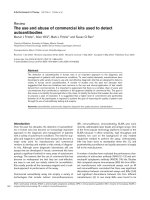
Modern scanning systems allow the “positive” shape of
the foot to be obtained directly, circumventing the ne ed
to cast the foot (although some handheld systems do
Telfer and Woodburn Journal of Foot and Ankle Research 2010, 3:19
/>Page 4 of 9
all ow a cast of the foot to be scanned (see Figure 2)). A
number of software packages (for example Orthomodel
from Delcam PLC, Birmingham, UK; and Automated
Orthotic Manufacturing System, Sharp Shape, CA, USA)
have been developed which have the ability to design
foot orthotics based directly on the 3D representations
of the foot obtained by surface scanning.
The software, as well as matching the shape of the
foot sole, allows the user to alter the shape and thick-
ness of the orthotic in a controlled manner, giving
greater design freedom than traditional plaster cast
methods. By linking up with computer controlled
milling or routing machines that can manufacture the
orthotics, this approach reduces the number o f steps in
the process as well as removing many of the sources of
human error.
There are alternative methods of obtaining the shape
of the foot. Rather than casting or scanning the foot
directly, in rece nt years an impression foam system has
gained popularity [36]. With this method, the patient
stands on or has their foot pushed into a low density
foam box. The fo am collapses under their weight and
when they step out of the box there is a fairly close
negative of the shape of their foot left in the foam. The
box can then either be filled with plaster to obtain a
positive cast or a number of companies now take a 3D
scan directly from the impression box and use this to
guide the machining of the orthotic. This is a fast and
inexpensive method of obtaining the shape of t he plan-
tar surface of the foot.
Comparison of foot orthotics designed using different
methods
The literature directly comparing the effects of orthotics
made via these different methods is limited. A recent
study by P allari et al [37] compared traditionally pro-
duced orthotics with those developed from a 3D compu-
ter model and fabric ated using selective laser sintering
found the two sets to be comparable in terms of
observed gait, co mfort and fit. Efforts have been made
to compare orthotics designed using a digitisation
method to those produced using the foam impression
technique and analysis of the resul ts found that the
orthotics produced by the CAD CAM method to be
more effective at redistributing pressure away from the
forefoot region and supporting the transverse arch [38].
Laughton et al [39] made a comparison between four
different methods of obtaining a negative impression o f
the foot, including two derived from laser scans (one
low weigh t bearing and one p artial weight bearing). The
results showed that there were significant differences
between the measurements obtained using different
methods. For example, plaster casting tending to pro-
duce results closest the c linical measurements for the
forefoot-to-re arfoot relationship, but the partial weight
bearing laser scans showing the closest correlation for
forefoot width. The study suffered from difficulties in
positioning the foot on the scanner for the n on-weight
bearing scan, a factor which the authors acknowledged
may have affected the results for this technique.
Early work by Foulston et al [40] used a basic digitis-
ing system to compare the casts taken with the foot in
unsupported and corrected positions. This system used
electromag netic technology rather than optical and only
recoded a limited number of points on the cast’s surface
compared to modern scanners. The authors however
were able to capture and analyse the differences in the
plantar surface shape between the two positions.
Cost
In terms of cost, it has been suggested that acquiring a
3D image of the foot using an optical scanner or digiti-
ser and basing the orthotic on it can offer significant
savings over traditional plaster cast methods [7]. The
cost of taking a plaster cast and preparing it for pre-
scription including materials and clinician time has been
estimated at €20-34 (it should be noted that the figures
usedinthisstudywereonlyfortheAustralianmarket,
however it is thought that these could be extrapolated
to European and other developed markets for foot
orthotics). In comparison, a scanner generated represen-
tation of the plantar surface of the foot is estimated to
cost €2.25-6.80. Further costs can be incurred with the
Figure 2 Scan of negative cast of the foot (3/4 length).1
st
and
fifth metatarsal heads can be seen to be marked on cast. Scan
taken using a hand held Cobra 3D scanner (Polhemus, Colchester,
VT, USA) and image viewed using MiniMagics .stl viewer (Materialise,
Leuven, Belgium).
Telfer and Woodburn Journal of Foot and Ankle Research 2010, 3:19
/>Page 5 of 9
trad itional metho d if the cast has to be transported to a
different location in order for the orthotic to be made,
whereas the scan file can simply be emailed.
From the perspective of a clinician prescribing the
orthotic, there is therefore a strong financial incentive to
move away from traditional casting techniques. How-
ever, the initial capital outlay for a 3D scanner or digiti-
ser is much higher than the amount required for plaster
casting or foam impression box techniques, with a typi-
cal unit and supporting software costing from €6-10K
and systems suitable for producing foot and lower leg
scans that can be used to generate ankle-foot orthotics
over twice that. In addition, the company who manufac-
ture the orthotics need to have the manufacturing facil-
ities in place to fabricate the orthotic from the
computer model of the mould, usually done using CNC
milling. These manufacturing equipment costs are offset
somewh at by the equip ment required for manufacturing
from a traditional plaster cast, which requires vacuum
pumps, grinders and other workshop equipment.
It is worth noting that at the moment 3D scanning
technologies are limited as to how much adjustment to
the foot the clinician can make while it is being
scanned. It has been previously noted in the literature
however that, depending on the clinician, there i s a sig-
nificant variation in the position the foot is cast in using
traditional methods [41].
Dynamic measurements
Attempts have been made to use optical technologies to
measure dynamic changes in foot shape during normal
walking [10,42,43]. The equipment setup required to
produce this data however remains relatively complex
and expensive, for example the methodology used by
Kimura et al [10] required a purpose built raised walk-
way and 12 video cameras to carry out their study.
Further research will undoubtedly reduce cost and
equipment requirements but it has yet to be shown that
the capture of 3D movement of the foot would provide
any clinically relevant insight into a subject’sfootfunc-
tion beyond that which is currently possible to analyse
using standard motion capture systems.
Foot assessment
Beyond their role in the prescription of foot orthotics
and customised shoes intended to accommodate defor-
miti es, there is some potential to use 3D scanning tech-
nologies for research and clinical assessments of medical
conditions relating to the foot. Borchers et al [44] were
the first to investigate a laser scanner with a view to
assessing its potential for informing the design of shoes
intended to reduce the risk of ulceration in insensate
feet. Limitations with the technology at the time meant
that the authors had d ifficu lties in aligning parts o f the
foot scan but they were able to show that, compared to
astandardshoelast,thehalluxandthe5
th
metatarsal
head both protruded outside of the last s hape, both
areas which are common ulceration sites for diabetic
patients.
Chen et al [8] used a 3D scanner to measure forefoot
varus angle in individuals with flexible flatfoot and
found it to be a “fast and accurate” measurement techni-
que. Scans were taken of a cast of the foot rather than
directly, and subjects with flatfoot were found to have a
varus angle 3.6° greater than those in the control group.
Although the study found significant differences
between the groups they did not compare the results to
thosewhichwouldhavebeenfoundusingastandard
clinical approach. A more recent study using 3D scan-
ning to investigate flatfoot prevalence in a group of 835
children was carried out by Pfeiffer et al [45], and found
that age, gender and weight were the key influence s on
flat foot development. The Infoot 3D foot digitiser
(I-Ware Laboratory Co., Ltd, Osaka, Japan), the develop-
ment of which has been described by Kouchi and
Mochimaru [46], has been investigated for validity and
reliability compared to manual measurements for rheu-
matoid arthritis patients [9]. The device was found to be
reliable with high intraclass correlation coefficients for
linear values, although standard e rrors of measurement
were found to be up to 5.9 mm for girth measurements .
The authors concluded that the device was a fast and
reliable method of obtaining 3D anthrop ometric data of
the foot.
Other 3D foot scanning research
A number of additional studies have been carried out
related to 3D foot scanning, sometim es using innovative
methods [47,48]. Martedi and Saito [47] recently
reported on their attempts to use a standard flatbed
scanner - the type that would normally be found in the
office environment for digitising documents - to scan
the foot sole and translate the output to a 3D form. The
distance of the sole away from the scanner glass was
estimated using the albedo of the sole surface and the
pixel intensity of the resulting image, inspired by techni-
ques used in the analysis of satellite images. The authors
claim they are able to achieve an average error of <1
mm, in line with those achieved by more expensive
scanning systems, however the system was tested using
a foot model with a uniform colour and it was noted
that scanning a real foot, especially those with damage
or injury could present problems for the reconstruction
process.
Witana et al [49] used 3D scanning to assess the foot
shape deformation of 16 subjects whilst standing on
foot supports made out of different materials. Markers
were attached to the foot on several bony landmarks
Telfer and Woodburn Journal of Foot and Ankle Research 2010, 3:19
/>Page 6 of 9
and it was the changing position of these that were used
to measure foot deformation. This approach was able to
show significant differences in foot shape depending on
the surface material used and this could potentially have
applications for the prescription of orthotics.
In a recent study, Mauch et al [50] scanned the feet of
almost 3,000 children and identified 5 foot types: flat,
robust, slender, short and long. By looking at the distri-
bution of foot types in normal, overweight and under-
weight children the data generated were able to show a
higher prevalence of flat and robust feet in overweight
children, and slender and long feet in those that were
underweight for their age.
Measuring the surface area of the foot is another
application of 3D scanning. This area has been tradi-
tionally estimated as percentage of the total body surface
area [51], or as a formula based on linear foot measure-
ments [52]. By using a scanning system it is possible to
increase the accuracy of the measurement by taking into
account many parts of the foot surface that are missed
using previous, physical measuring techniques such as
wrapping [53].
Conclusion and future recommendations
There are a number of current and potential applica-
tions for 3D scanners in commercial, clinical and
research areas related to the human foot. While there
may be improvements that could be made with regards
to software designed to automatically take measure-
ments from foot scans, it has been shown that the 3D
scans produced by these systems are accurate represen-
tations of the foot and that the measurements taken
from them are in general comparable to those that
would be taken manually. The foot scanner’srolein
orthosis and customised shoe design and manufacture
has been established, where it provides time and cost
advantages over traditional casting techniques in return
for a greater initial outlay. Initial research suggests that
foot orthotics designed from 3D scans of the foot are at
least comparable w ith those made through traditional
methods, although further research is required to con-
firm this.
The utility of scanning systems for clinical and
research purposes has been successfully demonstrated,
particularly for anthropometric measurement. 3D scan-
ners allow large numbe rs of subjects to be scan ned
quickly and easily, with the data available for analysis at
a convenient time for the researcher. There would
appear to be scope for the expansion of scanner-based
research into the investigation of a range of foot condi-
tions, for example those that require the monitoring of
the progression of a deformity over time. This approach
could help to reduce radiation exposure to the patient
from x-rays.
The use of 3D scanning technologies to gain a better
understanding of the changes in the shape of the foot
under different loading conditions that relate to the con-
ditions it will be under during normal use - walking,
going up stairs for example - has been investigated and
could be an a pplication relevant for the design of foot-
wear and orthotic devices. For example, the measure-
ment of the change in arch height under different
loading can be used to inform the design of the orthotic,
and while this can currently be achieved using kinematic
analysis of motion capture data from gait labs, the
majority of podiatrists and other clinicians who pre-
scribe orthoses do not have these facilities. A s mall and
reasonably priced scanning unit combined with software
that can quickly analyse the changes and provide advice
for the prescription could be beneficial in this situation.
Producing actual dynamic 3D scans of the foot during
gait has been achieved, however the quality of these
scans and complexity of the equipment setup required
to make them means that this option is several years
from being commercially available at a clinical level.
Studies have demonstrated some variation in the
results obtained from 3D scans using different techni-
ques. Ideally, to maximise time and cost savings the
scan should be taken directly of the foot to remove the
need for casting. In order to make it a standar d compo-
nent of an assessment for a foot orthotic or customised
shoe it is essential that a standardised protocol is devel-
oped describing the preparation of the foot (for examp le
cleaning, elevating beforehand), processing of the scan
data, and, if required, points where measurement s
should be taken f rom. ISO 7250 states that measure-
ments of foot length and width should be taken with
the subject in a standing position, 50% of their weight
on each foot. However it is not c lear from the current
evidence bases what is the best level of weight bearing
that will give the best quality shoes or orthotics. Current
standards are also limited to linear measurements of the
foot, and it is suggested that these should be expanded
to include relevant girth measurements so that these
can be included in anthropometric databases. Identifying
bony landmarks on the foot using markers th at show up
on the 3D scan appears to be the most reliable method
of obtaining accurate girth measurements.
Bringing researchers in the field, scanning equipment
manufacturers, orthotic and footwear companies, end
users and other stakeholders together to further explore
these issues may result in cross disciplinary activity
needed to resolve current needs and issues.
Acknowledgements
This review was funded through the European Commission Framework
Seven Program (grant number NMP2-SE-2009-228893) as part of the A-
Footprint project .
Telfer and Woodburn Journal of Foot and Ankle Research 2010, 3:19
/>Page 7 of 9
Authors’ contributions
ST and JW conceived the initial idea for the review. ST carried out the initial
literature searches. Both authors drafted and prepared the manuscr ipt and
approved the final manuscript.
Competing interests
The authors declare that they have no competing interests.
Received: 28 May 2010 Accepted: 5 September 2010
Published: 5 September 2010
References
1. Treleaven P: Sizing us up - new 3-d body scanners are reshaping
clothing car seats and more. IEEE Spectrum 2004, 41:17-19.
2. Donelson SM, Gordon CC: 1995 matched anthropometric database of US
marine corp personnel: summary statistics. United States Army Solder
Systems Command Geo-Centres Inc Newton Centre MA 1996.
3. Robinette KM, Daanen H, Paquet E: The caesar project: a 3-D surface
anthropometry survey. The Second International Conference on 3D Imaging
and Modelling: 4-8th October 1999; Ottawa 1999, 0380.
4. Istook CL, Hwang S-J: 3D scanning systems with application to the
apparel industry. J Fash Market Manage 2000, 5:120-132.
5. Zhao J, Xiong S, Bu Y, Goonetilleke RS: Computerized girth determination
for custom footwear manufacture. Comput Ind Eng 2008, 54:359-373.
6. Luximon A, Goonetilleke RS: Foot Shape Modeling. Hum Factors 2004,
46:304-315.
7. Payne C: Cost Benefit comparison of plaster casts and optical scans of
the foot for the manufacture of foot orthoses. Aust J Podiat Med 2007,
41(2):29-31.
8. Chen MJL, Chen CPC, Lew HL, Hsieh WC, Yang WP, Tang SFT:
Measurement of forefoot varus angle by laser technology in people
with flexible flatfoot. Am J Phys Med Rehabil 2003, 83:842-846.
9. De Mits S, Coorevits P, De Clercq D, Elewaut D, Woodburn J, Roosen P:
Validity and reliability of the Infoot 3D foot digitizer for rheumatoid
arthritis patients. Footwear Sci 2009, 1:101-103.
10. Kimura M, Mochimaru M, Kanade T: 3D measurement of feature cross-
sections of foot while walking. Mach Vis Appl .
11. Leng J, Du R: A CAD approach for designing customised shoe last.
Comput Aided D Appl 2006, 3:377-384.
12. Cheung J, Zhang M: Parametric design of pressure relieving foot orthosis
using statistics-based finite element method. Med Eng Phys 2008,
30:269-277.
13. Faustini MC, Neptune RR, Crawford RH, Stanhope SJ: Manufacture of
passive dynamic ankle-foot orthoses using selctive laser sintering. IEEE
Trans Biomed Eng 2008, 55:784-790.
14. Redaelli C, Sorlini M, Boer CR: A laboratory for industrial research on mass
customisation in the footwear industry. Int J Mass Customisation 2006,
1:492-506.
15. Millar RG: Manual of Shoemaking Clarks Training Department, UK 1976.
16. Witana CP, Xiong S, Zhao J, Goonetilleke RS: Foot measurements from
three dimensional scans: a comparison and evaluation of different
methods. Int J Ind Ergon 2006, 36
:789-807.
17. Liu X, Kim W, Drerup B: 3D characterization and localization of
anatomical landmarks of the foot by FastSCAN. Real-Time Imaging 2004,
10:217-228.
18. Goonetilleke RS, Witana CP, Zhao J, Xiong S: The pluses and minuses of
obtaining measurements from digital scans. In Digital Human Modeling.
Edited by: Duffy VG. Berlin: Springer-Verlag; 2009:681-690.
19. Krauss I, Grau S, Mauch M, Maiwald C, Horstmann T: Sex-related
differences in foot shape. Ergonomics 2008, 51:1693-1709.
20. Mauch M, Grau S, Krauss I, Maiwald C, Horstmann T: A new approach to
children’s footwear based on foot type classification. Ergonomics 2009,
52:999-1008.
21. Luo G, Houston VL, Mussman M, Garbarini M, Beattie AC, Thongpop C:
Comparison of male and female foot shape. J Am Podiat Med Assoc 2009,
99:383-390.
22. Wunderlich RE, Cavanagh PR: Gender differences in adult foot shape:
implications for shoe design. Med Sci Sports Exerc 2001, 33:605-11.
23. Houston VL, Luo G, Mason CP, Mussman M, Garbarini M, Beattie AC:
Changes in male foot shape and size with weightbearing. J Am Podiat
Med Assoc 2006, 96:330-343.
24. Xiong S, Goonetilleke RS, Zhao J, Li W, Witana CP: Foot deformations
under different load-bearing conditions and their relationships to
stature and body weight. Anthropol Sci 2009, 117:77-88.
25. Tsung BY, Zhang M, Fan YB, Boone DA: Quantitative comparison of
plantar foot shapes under different weight bearing conditions. J Rehabil
Res Dev 2003, 40:517-26.
26. Oladipo G, Bob-Manuel I, Ezenatein G: Quantitative comparison of foot
anthropometry under different weight bearing conditions amongst
Nigerians. Internet J Bio Anthrop 2009, 3:1.
27. Cheng F-T, Perng D-B: A systematic approach for developing a foot size
information system for shoe last design. Int J Ind Ergon 1999, 25:171-185.
28. Shi N, Yi S, Xiong S, Jiang Z: A CAD system for shoe last customization.
International Joint Conference on Computational Sciences and Optimization:
24-26th April 2009; Sanya, China 2009, 957-960.
29. Lord M, Foulston J, Smith PJ: Technical evaluation of a CAD system for
orthopaedic shoe-upper design. J Eng Med 1991, 205:109-115.
30. Bao HP, Soundar P, Yang T: Integrated approach to design and
manufacture of shoe lasts for orthopaedic use. Comput Eng 1994,
26:411-421.
31. Nácher B, Alemany S, González JC, Alcántara E, García-Hernández J, Heras S,
Juan A: A footwear fit classification model based on anthropometric
data.
Proceedings of the 8th annual digital human modelling for design and
engineering symposium: 4-6th July 2006 Lyon; 2327 .
32. Witana CP, Goonetilleke RS, Feng J: Dimensional differences for evaluating
the quality of footwear fit. Ergonomics 2004, 47:1301-1317.
33. Wang C-S: An analysis and evaluation of fitness for shoe lasts and
human feet. Comput Ind 2010, 61:532-540.
34. Hawke F, Burns J, Radford JA, du Toit V: Custom-made foot orthotics for
the treatment of foot pain. Cochrane Database Syst Rev 2008, 16:
CD006801.
35. Losito JM: Impression casting techniques. In Clinical Biomechanics of the
lower extremity. Edited by: Valmassy R. St Louis; Mosby; 1996.
36. Guldemond NA, Leffers P, Sanders AP, Emmen H, Schaper NC,
Walenkamp GHIM: Casting Methods and plantar pressure: effects of
custom made foot orthoses on dynamic plantar pressure distribution. J
Am Podiat Med Assoc 2006, 96:9-18.
37. Pallari JHP, Dalgarno KW, Woodburn J: Mass customisation of foot
orthoses for rheumatoid arthritis using selective laser sintering. IEEE
Trans Biomed Eng 2010, 57:1750-1756.
38. Ki SW, Leung AKL, Li AMN: Comparison of plantar pressure distribution
patterns between foot orthoses provided by the CAD-CAM and foam
impression methods. Prosthet Orthot Int 2008, 32:356-362.
39. Laughton C, Davis IM, Williams DS: A comparison of four methods of
obtaining a negative impression of the foot. J Am Podiat Med Assoc 2002,
92:261-268.
40. Foulston J, Lord M, West S: Changes in plantar surface shape induced by
corrective foot eversion. Clin Biomech 1990, 5:229-235.
41. Chuter V, Payne C, Miller K: Variability of neutral position casting of the
foot. J Am Podiat Med Assoc 2003, 93:1-5.
42. Coudert T, Vacher P, Smits C, Van Der Zande M: A method to obtain 3D
foot shape deformation during the gait cycle. 9th International
Symposium on the 3D analysis of Human Movement: 28-30th June 2006
Valenciennes, France [ />Abstracts/117-Coudert.pdf].
43. Jezerek M, Mozina J: High-speed measurement of foot shape based on
multiple-laser-plane triangulation. Opt Eng 2009, 48:113604.
44. Borchers RB, Boone DA, Joseph AW, Smith DG, Reiber GB: Numerical
comparison of 3-D shapes: potential for application to the insensate
foot. J Prosthet Orthot 1995, 7:29-39.
45. Pfeiffer M, Kotz R, Ledl T, Hauser G, Sluga M: Prevalence of flat foot in pre-
school-aged children. Pediatrics
2006, 118:634-639.
46. Kouchi M, Mochimaru M: Development of a low cost foot scanner for a
custom shoe making system. Proceedings of the 5th Symposium on
Footwear Biomechanics: 5th-7th July 2009 Zurich, Switzerland .
47. Martedi S, Saito H: Shape measurement system of foot sole surface from
flatbed scanner image. MVA2009 IAPR Conference on Machine Vision
Applications 20-22nd June 2009 Keio, Japan [ />paper/pdf/MVA2009_sandy.pdf].
48. Munoz-Rodriguez JA: Computer vision of the foot sole based on laser
metrology and algorithms of artificial intelligence. Opt Eng 2009,
48:123604.
Telfer and Woodburn Journal of Foot and Ankle Research 2010, 3:19
/>Page 8 of 9
49. Witana CP, Goonetilleke RS, Xiong S, Au EYL: Effects of surface
characteristics on the plantar shape of feet and subjects’ perceived
sensations. Appl Ergon 2009, 40:267-279.
50. Mauch M, Grau S, Krauss I, Maiwald C, Horstmann T: Foot morphology of
normal, underweight and overweight children. Int J Obesity 2008,
32:1068-1075.
51. Wachtel TL, Berry CC, Wachtel EE, Frank HA: The inter-rater reliability of
estimating the size of burns from various burn area chart drawings.
Burns 2000, 26:156-170.
52. Livingston EH, Lee S: Percentage of burned body surface area
determination in obese and non-obese patients. J Surg Res 2000,
91:106-110.
53. Yu C-Y, Tu H-H: Foot surface area database and estimation formula. Appl
Ergon 2009, 40:767-774.
doi:10.1186/1757-1146-3-19
Cite this article as: Telfer and Woodburn: The use of 3D surface
scanning for the measurement and assessment of the human foot.
Journal of Foot and Ankle Research 2010 3:19.
Submit your next manuscript to BioMed Central
and take full advantage of:
• Convenient online submission
• Thorough peer review
• No space constraints or color figure charges
• Immediate publication on acceptance
• Inclusion in PubMed, CAS, Scopus and Google Scholar
• Research which is freely available for redistribution
Submit your manuscript at
www.biomedcentral.com/submit
Telfer and Woodburn Journal of Foot and Ankle Research 2010, 3:19
/>Page 9 of 9