Báo cáo y học: "Effect of children’s shoes on gait: a systematic review and meta-analysis" potx
Bạn đang xem bản rút gọn của tài liệu. Xem và tải ngay bản đầy đủ của tài liệu tại đây (367.4 KB, 13 trang )
RESEARCH Open Access
Effect of children’s shoes on gait: a systematic
review and meta-analysis
Caleb Wegener
1*
, Adrienne E Hunt
1
, Benedicte Vanwanseele
1
, Joshua Burns
2
, Richard M Smith
1
Abstract
Background: The effect of footwear on the gait of children is poorly understood. This systematic review
synthesises the evidence of the biomechanical ef fects of shoes on children during walking and running.
Methods: Study inclusion criteria were: barefoot and shod conditions; healthy children aged ≤ 16 years; sample
size of n > 1. Novelty footwear was excluded. Studies were located by online database-searching, hand-searching
and contact with experts. Two authors selected studies and assessed study methodology using the Quality Index.
Meta-analysis of continuous variables for homogeneous studies was undertaken using the inverse variance
approach. Significance level was set at P < 0.05. Heterogeneity was measured by I
2
. Wher e I
2
> 25%, a random-
effects model analysis was used and where I
2
< 25%, a fixed-effects model was used.
Results: Eleven studies were included. Sample size ranged from 4-898. Median Quality Index was 20/32 (range
11-27). Five studies randomised shoe order, six studies standardised footwear. Shod walking increased: velocity,
step length, step time, base of support, double-support time, stance time, time to toe-off, sagittal tibia-rearfoot
range of motion (ROM), sagittal tibia-foot ROM, ankle max-plantarflexion, Ankle ROM, foot lift to max-plantarflexion,
‘subtalar’ rotation ROM, knee sagittal ROM and tibialis anterior activity. Shod walking decreased: cadence, single-
support time, ankle max-dorsiflexion, ankle at foot-lift, hallux ROM, arch length change, foot torsion, forefoot
supination, forefoot width and midfoot ROM in all planes. Shod running decreased: long axis maximum tibial-
acceleration, shock-wave transmission as a ratio of maximum tibial-acceleration, ankle plantarflexion at foot strike,
knee angular velocity and tibial swing velocity. No variables increased during shod running.
Conclusions: Shoes affect the gait of children. With shoes, children walk faster by taking longer steps with greater
ankle and knee motion and increased tibialis anterior activity. Shoes reduce foot motion and increase the support
phases of the gait cycle. During running, shoes reduce swing phase leg speed, attenuate some shock and
encourage a rearfoot strike pattern. The long-term effect of these changes on growth and development are
currently unknown. The impact of footwear on gait should be considered when assessing the paediatric patient
and evaluating the effect of shoe or in-shoe interventions.
Background
Parents, health professionals and shoe manufacturers
assume that children’s shoes do not impede normal foot
function or motor development. While it has long been
thought that poorly designed and fitted shoes contribute
to paediatric foot and toe deformity [1], empirical evi-
dence of specific effects of shoes is equivocal. For exam-
ple, cross-sectional studies suggest that children who
usually wear shoes have a lower medial longitudinal
arch than children who habitually go barefoot [2,3].
However, prospective studies have concluded that the
medial longitudinal arch develo ps naturally and inde-
pendently of footwear [4,5].
There is an existing body of literature on the biome-
chanical effects of shoes on the gait patterns of children.
These effects are described according to the breadth of
biomechanical variables including: spatio-temporal (relat-
ing to space and time); kinematics (relating to move-
ment); kinetics (relating to external force and motion);
electromyography (EMG) (muscle function) and plantar
pressure [6]. While a number of studies have investigated
* Correspondence:
1
Discipline of Exercise and Sports Science, Faculty of Health Sciences, The
University of Sydney, Cumberland Campus, PO Box 170, Lidcombe, 1825,
NSW, Australia
Full list of author information is available at the end of the article
Wegener et al. Journal of Foot and Ankle Research 2011, 4:3
/>JOURNAL OF FOOT
AND ANKLE RESEARCH
© 2011 Wegener et al; licens ee BioMed Central Ltd. This is an Open Access article distributed under the terms of the Creative
Commons Attribution License (http://creativecommons. org/licenses/by/2.0), which permits unrestricted use, distribution, and
reproduction in any medium , provide d the original work is properly cited.
specific variables wit hin these categori es [7-10], there is
no recent cohesive review assimilating the known biome-
chanical effects of shoes on the gait of children. Of the
two previously published reviews of the effects of chil-
dren’ s shoes, one w as published in 1991 [11] and the
other focused only on children’s sports shoes [12]. These
reviews did not focus on the gait of children but rather
on foot development, foot deformity, corrective shoes,
foot anthropometry and the design requirements of
shoes [11,12].
A systemati c revie w updating the bi omechanics litera-
ture would assist in identifying the effects of shoes on
all aspects of children’s gait. Such information will assist
in the clini cal assessment of paediatric shoe an d in-shoe
interventio ns, guide the development of children’sshoes
and assist in directing future research. T he aim of this
systematic review was to evaluate the evidence for bio-
mechanical effects of shoes on walking and running gait,
compared to barefoot in healthy children.
Methods
Inclusion and exclusion criteria
Inclusion and exclusion criteria for this study were
determined apriori. Inclusion criteria were: children
aged ≤ 16 years; barefoot and shod gait compared in a
randomised or non-randomised order; healthy children
described as developing normally and without pathology;
a sample size of n > 1. Exclusion criteria were: novelty
types of footwear such as roller skates or shoes with
cleats; an evaluation of only foot orthoses, arch supports
or innersoles.
Search strategy
To identify relevant studies from online databases, the
following search terms were truncated and adapted:
shoe, footwear, shod, child, kid, p[a]ediatric, toddler,
adolescent, infant, gait, walk, jog, run, ambula[te]tion.
Database Medical Subject Headings (MeSH) terms were
also used in seven of the nine databases (Medline,
EMBASE, CINAHL, The Cochrane Library, AMED,
EBM reviews, Sports Discus). Electronic databases
searched were: MEDLINE (1950 to June 2010), EMBASE
(1966 to June 2010), CINAHL (1967 to June 2010), The
Cochrane Library (Second quarter 2010), Web of
Science (1900 to June 2010), AMED (1985 to June
2010), EBM reviews (June 2010), SPORTDiscus (1790 to
June 2010), Google Scholar (June 2010). Hand-searching
was also undertaken of selected biomechanics journals,
conference proceedings and reference lists of articles.
To reduce publication bias, where studies with non sig-
nificant findings are less likely to have b een published
[13], experts in the field were contacted to identify
unpublished data. No restrictions were applied to year,
language or publication type. One author undertook all
searches in September 2009. Searches were updated in
June 2010.
Two review authors determined independently from
the title and abstract whether a study could be included.
The full text was reviewed for clarification when
required. Difference of opinion was resolved by discus-
sion until consensus was achieved. Failing consensus,
the opinion of a third author was sought.
Quality assessment
The methodological quality of selected studies was
assessed using the Quality Index [14]. The Quality
Index is a validated a nd reliable checklist designed for
the evaluation of ra ndomised and non-randomised stu-
dies of health care interventions [14]. In the absence of
a quality assessment tool designed for biomechanics stu-
dies, the Quality Index was considered appropriate in
rigour with shoes treated as the ‘health intervention’.
A total score of 32 is possible across 27 items organised
into 5 subscales: 10 items assessed study reporting
(including reporting of study objectives, outcomes, parti-
cipants characteristics, interventions, confo unders, find-
ings, adverse events and probability); 3 items assessed
external validity (the ability to generalise the results);
7 items assessed internal validity selection bias (bias in
the measurement of the intervention); 6 items assessed
internal validity confounding (bias in the selection of
study participants); 1 item assessed study power (to
assesses if negative findings from a study could be due
to chance).
Methodological quality of a study was assessed inde-
pendently by two reviewers when published i n English.
The methodological quality of one study published in
German [15] was assessed by a single author fluent in
German. Rating for each item on the Quality Index was
agreed by discussion.
Data extraction
Data were extracted from studies written in English by
one review author and from studies written in German
by a second review author. Study authors were con-
tacted for additional information, as required. Extracted
data were checked by another review author. Shoe type
was classified according to the Footwear Assessment
Form [16]. If no informati on regarding the type of shoe
investigated was attainable, the term ‘unknown’ was
used.
Statistical analysis
Meta-analysis was undertaken of homogenous studies
where appropriate data were attainable. Mean differ-
ences, 95% confidence intervals and effect sizes were
calculated. All analyses were undertaken in Review
Manager 5.0 (The Cochrane Collaboration, Copenhagen,
Wegener et al. Journal of Foot and Ankle Research 2011, 4:3
/>Page 2 of 13
Denmark) using the inverse variance statistical method
to calculate mean differences and 95% confidence inter-
vals (CI) for continuous variables. This conservative
technique assumes participant independence between
the barefoot and shod groups, therefore increasing the
confidence interval [13]. In biomechanical studies the
standard practice has been to report the mean and stan-
dard deviation/error for the intervention and the control
conditions, rather than reporting change sc ores between
intervention and control conditions and change score
standard deviation/error. This reporting practice prohi-
bits the application of less conservative statistical
techniques.
Statistical heterogeneity of included studies was
assessed to determine if differences in results between
studies included in the review were due to chance alone
orstudydesign.ThequantityI
2
was utilised to assess
statistical heterogeneity, where I
2
values of 25%, 50%
and 75% represented low, moderate and high heteroge-
neity, respectively [17]. Where I
2
was greater than 25%,
a random effects model analysis was used. Where I
2
was
less than 25%, a fixed-effects model was used. When
necessary, reported measures were converted to stan-
dard units, and standard errors were converted to stan-
dard deviations. Results were considered statistically
significant if P < 0.05.
Results
Search results
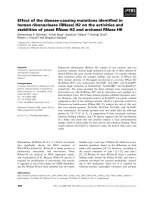
Eleven studies met the inclusion criteria. The search and
selection process is described in Figure 1. Nine papers
were located through searching of online databases.
Contact with known experts in the field located two
additional unpublished research papers. An English
translation of an abstract published in German indicated
that the study met the criteria; however, the German
text did not report a comparison between barefoot and
shoes, making it ineligible for the review [18]. One
unpublished thesis [19], was withdrawn from the review
since the abstract provided insufficient data and the
author was unable to be contacted for further data.
Study quality
The median score for the Quality Index was 20 out of
32 (range 11-27 out of 32) (Table 1). In no study were
participants blinded to the shoe interventions. In five
studies the order of interventions was randomised
[9,20-23].
Participants
Data of children aged 1.6 to 15 years were evaluated
from the included studies (Table 2). All but three stu-
dies in the review included children in middle childhood
(ages 7 to 11 years) [15,20,24,25]. Boys accounted for
52% of participants.
Shoe conditions
The shoe types that were commonly investigated were
walking shoes (n = 5), athletic shoes (n = 4) and Oxford
style footwear (n = 2) (Table 2). Four stu dies investi-
gated multiple types of shoes [8,15,20,21]. Four studies
did not describe the style of shoe investigated
[10,22,25,26]. Five studies did not standardise the shoe
worn [7,9,10,25,26].
Description and methodological approach of included
studies
The description and nature of the included studies are
shown in Table 2. Nine studies investigated spatio-
temporal variables, six studies investigated kinematic
variables, two studies investigated kinetic variables and
one study investi gated EMG variables. Eight studies
investigated variables in more than one type of biome-
chanical category. All but one study allowed participants
to self-select gait velocity [22]. No studies reported
monitoring gait velocity between conditions/trials. One
study examined maximum sprinting velocity [26].
Wilkinson and colleagues [20] collected spatio-
temporal variables from footprints of children walking
barefoot and in two types of shoes. In order to reduce
the variables examined, Wilkinson and co researchers
[20] averaged all related measures to produce composite
variables relating t o time, angl e of gait and stride/step
length. The variable ‘time’ comprised the average of
stride time, percent of time to foot lift, percent of time
to maximum plantarflexion and the percent of time
from foot lift to peak plantarflexion. The variable angle
comprised the average of angle of gait relative to ipsilat-
eral line of progression and angle of gait relative to the
direction of gait. The variable length comprised the
average of stride and step length. Wilkinson and co-
invest igators [20] also investigated the effect of footwear
over time by reviewing c hildren after a month of wear-
ing randomly allocated athletic or Oxfo rd style s hoes.
However, at the time of retesting analysis focused o n
comparison between shoes at the initial session and
Studies included in the review (n=11)
Excluded studies (n=57)
x Age (n=13)
x No biomechanical gait data (n=19)
x Children not ‘normal’ (n=7)
x
Footwear not independent variable
(n=12)
x No comparisons to barefoot (n=5)
x Novel footwear(n=1)
Studies identified in search (n=1680)
1 study withdrawn because full text could
not be obtained and abstract did not provide
adequate information
Potentially appropriate studies that
underwent full text review (n=69)
Studies fulfilling the a priori
inclusion criteria (n=12)
Figure 1 Search and selection process for the review studies.
Wegener et al. Journal of Foot and Ankle Research 2011, 4:3
/>Page 3 of 13
retest session and barefoot gait at the initial session and
retest session. Therefore the retest data could not be
included in this review.
Various methods were used across the six studies
investigating kinematic variabl es [8,9,20,23,25,26]. Kine-
matics were investigated in three dimensions using mul-
tiple cameras in three studies [8,9,23] and in two
dimensions using a single camera in three studies
[20,25,26].
Biomechanical foot models also varied between studies.
The foot was modelled as a single rigid body [9,20,25,26],
and also as a multi-segmented structure [8,23]. Wegener
and co-investigators [23] used a foot mode l of rearfoot
(three calcaneal markers), forefoot (markers located at
the navicular, 5
th
metatarsal head and 1
st
metatarsal
head) and hallux segments (distal hallux marker). Motion
was reported in three planes at the rearfoot complex and
midfoot joints as flexion/extension, inversion/ eversion
and abduction/adduction in respect to the proximal seg-
ment, while resultant motion of the hallux was reported
in two dimensions, primarily flexion/extension. Wolf and
colleagues [8] used a modified Heidelberg foot model
where the distance and rotations between the calcaneus
and 1
st
and 5
th
metatarsal head markers were used to
Table 1 Methodological quality of the studies included in the review as assessed by the Quality Index
Author Reporting
(score/11)
External validity
(score/3)
Bias
(score/7)
Confounding
(score/6)
Power
(score/5)
Total
(score/32)
Alcantara et al. [21] 7 1 4 1 4 17
Kristen et al. [15] 7 1 5 2 5 20
Lieberman et al. [25] 5 1 4 4 5 19
Lythgo et al. [7] 8 3 4 4 5 24
Moreno-Hernandez et al. [10] 7 1 4 3 5 20
Mueller et al. [22] 6 1 3 5 5 20
Oeffinger et al. [9] 6 1 5 1 5 18
Tazuke [26] 4 1 3 1 2 11
Wegener et al. [23] 8 1 5 4 5 23
Wilkinson et al. [20] 11 1 5 5 5 27
Wolf et al. [8] 8 1 5 2 5 21
Table 2 Description and methodological approach of studies included in the review
Author Design Sample
size
Participants Gait
type
Shoe conditions Outcome
measure/s
Alcantara et al.
[21]
Randomised
repeated measures
8 4 girls and 4 boys, aged 7 to 14 years,
mean age 10 years
run barefoot/athletic/
walking/walking
Kinetics
Kristen et al. [15] Repeated measures 30 1.8-4.8 years walk barefoot/walking Spatio-temporal,
kinetics
Lieberman et al.
[25]
Repeated measures 17 10 boys, 7 girls mean age 15 years run barefoot/unknown Spatio- temporal
kinematics,
Lythgo et al. [7] Repeated measures 898 52% boys, aged 5-12 years walk barefoot/athletic Spatio-temporal
Moreno-
Hernandez et al.
[10]
Repeated measures 61 31 girls, 30 boys, aged 10-13 years, walk barefoot/unknown Spatio-temporal
Mueller et al. [22] Randomised
repeated measures
234 2-15 years, mean age 7.7 years treadmill
walk
barefoot/unknown Electromyography
Oeffinger et al. [9] Randomised
repeated measures
14 8 females, 6 males aged 7-14 years walk barefoot/athletic Spatio-temporal,
kinematics
Tazuke [26] Repeated measures 4 3 girls, 1 boy aged 8-13 years, mean
age 10 years
run barefoot/unknown Spatio-temporal,
kinematics
Wegener et al. [23] Randomised
repeated measures
20 8 girls, 12 boys aged 6-13 years, mean
age 9 years
walk barefoot/Oxford shoe Spatio-temporal,
kinematics
Wilkinson et al.
[20]
Randomised
repeated measures
31 17 girls, 14 boys, aged 1.1-2.7 years,
mean age 1.6 years
walk barefoot/athletic/
Oxford shoe
Spatio-temporal,
kinematics
Wolf et al. [8] Repeated measures 18 8 girls, 10 boys aged 6-10 years, mean
age 8 years
walk barefoot/walking/
flexible walking
Spatio-temporal,
kinematics
Wegener et al. Journal of Foot and Ankle Research 2011, 4:3
/>Page 4 of 13
provide a measure of intrinsic foot function. The rota-
tional angles within the foot were defined by the motion
of 2D line-like segments around a perpendicular axis
with respect to the proximal segment. This allowed for
the examination of 10 variables to descr ibe intrinsic foot
function. Sagittal plane rearfoot motion was described by
tibia-foot flexion, foot motion (rigid segment) relative to
the tibia, and tibio-talar flexion, hindfoot motion relat ive
to the tibia. Transverse plane foot motion was measured
by foot rotation (complete foot motion relative to the
tibia) and foot torsion (forefoot motion relative to the
rearfoot). Frontal plane foot motion was described by
‘subtalar’ rotation (hindfoot motion relative to the tibia)
and forefoot supination (forefoot motion relative to th e
ankle). Arch function was described by the change in dis-
tance between the medial calcaneal marker and 1
st
meta-
tarsal marker. Change in forefoot width was described by
the distance between the 1
st
and 5
th
metatarsal markers.
Foot progression angle was described by the orientation
of the long foot axis relative to the direction of gait. Hal-
lux sagittal plane motion (relative to the forefoot) was
also described.
In addition to kinematics, information was obtained
from kinetics and electromyography. Kinetics were
investigated from force platform data in two studies
[15,21] and from a tibial mounted accelerometer in one
study [21]. EMG amplitude of the tibialis anterior, pero-
neus longus, and medial gastrocn emius during treadmill
walking was investigated using surface electrodes [22].
Spatio-temporal findings
The findings for mean difference, 95% CI, statistical
significance, weighting and heterogeneity of walking
spatio-temporal variables are presented in Table 3.
Additional walking spatio-temporal details, including
barefoot and shod values for each study, are reported in
Additional File 1. Compared to barefoot walking, shod
walking resulted in: increased walking velocity; longer
stride length; longer step length; increased stride time;
increased step time; decreased cadence; wider base of
support; later toe-off time during the gait cycle;
increased double support time; decreased single support;
and longer stance time.
The findings f or mean diff erence, 95% CI, sta tistical
significance, weighting and heterogeneity of running
spatio-temporal variables are presented in Table 4.
Additional running spatio-temporal details, including
barefoot and shod values for each study, are reported in
Additional File 2. There were no differences between
barefoot running and shod running.
Kinematic findings
The findings for mean difference, 95% CI, statistical signif-
icance, weighting and heterogeneity of kinematic variables
while walking are presented in Table 5. Additional walking
kinematic details, including baref oot and shod values for
each study, are reported in Additional File 3. Compared to
barefoot, shod walking resulted in: increased sagittal plane
tibia-rearfoot range of motion (ROM); increased tibia-foot
ROM in athletic shoes; increased max-plantarflexion in
athletic shoes; increased ankle ROM from foot lift to max-
plantarflexion; decreased ankle max-dorsiflexion in Oxford
shoes; decreased plantarflexion at foot lift in Oxford shoes;
increased ‘subtalar’ rotation ROM; increased sagittal plane
knee ROM; decreased hallux ROM; reduced change in the
length of the medial arch; decreased foot torsion ROM;
decreased forefoot supination ROM; decrease d widening
of the forefoot; decreased sagittal plane midfoot ROM;
decreased frontal plane midfoot ROM; and decreased
transverse plane midfoot ROM.
The mean difference, 95% CI, statistical significance,
weighting and heterogeneity of kinematic range of
motion variables while running are presented in Table 6.
Additional running kinematic details, including barefoot
and shod values for each study, are reported in Addi-
tional File 4. Compared to barefoot running, significant
changes during shod running were: reduced ankle plan-
tarflexion angle at foot strike; reduced plantar foot angle
at foot strike (angle between the ground and the plantar
surface of the f oot/shoe); decreased angular velocity of
the knee; and decreased swing-back velocity of the tibia.
Lieberman and co-investigators, [25] reported that rear-
foot strike mode increased from 62% to 97% during shod
running while midfoot and forefoot strike reduced from
19% for both to 3% and 0% respectively.
Kinetic findings
The mean difference, 95% CI, statistical significance,
weighting and heterogeneit y of kinetic v ariables during
walking are presented in Table 7. Additional walking
kinetic details, including barefoot and shod values for
each study, are reported in Additional File 5. No signifi-
cant differences were found in kinetic walking variables.
However, a higher vertical ground reaction force for shod
walking was reported by Kristen and co-researchers [15]
using the less cautious Chi-Square test for significance.
The mean difference, 95% CI, statistical significance,
weighting and heterogeneity of k inetic variables during
running are p resented in Table 8. Additional running
kinetic details, including barefoot and shod values for
each study, are reported in Additional File 6. Compared
to barefoot running, significant kinetic changes during
shod running were: reduced ‘long axis’ maximum tibial
acceleration; decreased rate of tibial acceleration; and
decreased shock wave transmission as a ratio of maxi-
mum tibial acceleration. However, Alcantar a and collea-
gues [21] using a multifactor analysis of variance
(ANOVA) t o test for significance, reported that vertical
Wegener et al. Journal of Foot and Ankle Research 2011, 4:3
/>Page 5 of 13
Table 3 Mean differences and statistical significance for spatio-temporal variables for shod and barefoot walking
Variable Shoe Condition Authors n Weighting Mean difference
[95%CI]
Statistical significance: z
Score (P)
Heterogeneity:
I
2
%
Velocity (m/s) Athletic Lythgo et al. [7]* 898 94.0% 0.07 [0.06, 0.09] - 98%
Unknown Moreno-Hernandez
et al.[10]
61 2.2% 0.05 [-0.01, 0.12] - -
Athletic Oeffinger et al. [9] 14 0.8% 0.04 [-0.08, 0.16] - -
Oxford Wegener et al. [23] 20 0.9% 0.03 [-0.08, 0.14] - -
Walking Wolf et al. [8] 18 1.4% -0.01 [-0.10, 0.08] - -
Combined Pooled effect 1011 100.0% 0.07 [0.06, 0.08] 12.97 (P < 0.00001) 97%
Walking (greater
flexibility)
Wolf et al. [8] 18 100.0% 0.02 [-0.07, 0.11] 0.41 (P = 0.68) N/A
Stride length (m) Athletic Lythgo et al. [7]* 781 97.60% 0.11 [0.11, 0.12] - 97%
Unknown Moreno-Hernandez
et al.[10]
61 1.10% 0.07 [0.02, 0.12] - -
Athletic Oeffinger et al. [9] 14 0.30% 0.12 [0.02, 0.21] - -
Oxford Wegener et al. [23] 20 0.20% 0.11 [0.00, 0.22] - -
Walking Wolf et al. [8] 18 0.70% 0.07 [0.01, 0.13] - -
Combined Pooled effect 894 100.0% 0.11 [0.10, 0.12] 40.49 (P < 0.00001) 93%
Walking (greater
flexibility)
Wolf et al. [8] 18 100.0% 0.06 [-0.01, 0.13] 1.71 (P = 0.09) N/A
Step length (%) Walking Kristen et al. [15] 30 6.2% 0.20 [-2.26, 2.66] - -
Athletic Lythgo et al. [7]* 781 87.5% 9.69 [8.77, 10.61] - 100%
Unknown Moreno-Hernandez
et al.[10]
61 6.3% 6.57 [4.14, 8.99] - -
Combined Pooled effect 872 100.0% 8.90 [8.04, 9.77] 20.16 (P < 0.00001) 100%
Length (m) Oxford Wilkinson et al. [20] 31 100.0% 0.03 [-0.01, 0.07] 1.52 (P = 0.13) N/A
Athletic Wilkinson et al. [20] 30 100.0% 0.04 [0.00, 0.07] 2.25 (P = 0.02) N/A
Stride time (s) Athletic Lythgo et al. [7]* 790 94.0% 0.03 [0.02, 0.04] - 99%
Oxford Wegener et al. [23] 20 2.6% 0.08 [0.03, 0.13] - -
Walking Wolf et al. [8] 18 3.4% 0.07 [0.03, 0.11] - -
Combined Pooled effect 828 100.0% 0.03 [0.02, 0.04] 7.61 (P < 0.00001) 99%
Walking (greater
flexibility)
Wolf et al. [8] 18 100.0% 0.03 [-0.01, 0.07] 1.50 (P = 0.13) N/A
Step time (s) Athletic Lythgo et al. [7]* 728 100.0% 0.01 [0.01, 0.02] 5.25 (P < 0.00001) 99%
Time Oxford Wilkinson et al. [20] 31 100.0% -0.40 [-1.98, 1.18] 0.50 (P = 0.62) N/A
Athletic Wilkinson et al. [20] 30 100.0% -0.20 [-1.98, 1.58] 0.22 (P = 0.83) N/A
Cadence (steps/
min)
Athletic Lythgo et al. [7]* 471 70.5% -5.68 [-9.05, -2.31] - 100%
Unknown Moreno-Hernandez
et al.[10]
61 11.0% -3.51 [-8.51, 1.49] - -
Athletic Oeffinger et al. [9] 14 4.2% -8.30 [-19.76, 3.16] - -
Oxford Wilkinson et al. [20] 31 4.1% -2.10 [-13.80, 9.60] - -
Walking Wolf et al. [8] 18 10.3% -8.70 [-14.11, -3.29] - -
Combined Pooled effect 564 100.0% -5.71 [-8.39, -3.02] 4.16 (P < 0.0001) 99%
Oxford Wilkinson et al. [20] 31 100.0% -0.20 [-9.99, 9.59 0.04 (P = 0.97) N/A
Walking (greater
flexibility)
Wolf et al. [8] 18 100.0% -4.60 [-9.99, 0.79] 1.67 (P = 0.09) N/A
Support base (m) Athletic Lythgo et al. [7]* 753 99.1% 0.01 [0.00, 0.01] - 89%
Oxford Wegener et al. [23] 20 0.5% 0.01 [-0.01, 0.03] - -
Oxford Wilkinson et al. [20] 31 0.4% 0.01 [-0.00, 0.03] - -
Combined Pooled effect 804 100.0% 0.01 [0.00, 0.01] 9.23 (P < 0.00001) 96%
Athletic Wilkinson et al. [20] 30 100.0% 0.00 [-0.01, 0.02] 0.49 (P = 0.62) N/A
Toe-off (%) of
gait cycle
Walking Wolf et al. [8] 18 100.0% 2.30 [1.61, 2.99] 6.56 (P < 0.00001) N/A
Wegener et al. Journal of Foot and Ankle Research 2011, 4:3
/>Page 6 of 13
ground reaction force was lower in walking shoes than
either athletic shoes or when barefoot for boys and girls.
Boys had higher forces in athletic shoes compared to
barefoot and walking shoes, where as girls had higher
values unshod compared to athletic shoes and walking
shoes, rate of load at impact was significantly higher
during barefoot running than both shod running condi-
tions for boys and girls [21].
Electromyography
Mueller and co-investigators [22] reported that EMG
amplitude of the tibialis anterior during weight accep-
tan ce and midstance was signi ficantly (P < 0.05) greater
during shod walking (mean 1.78) than barefoot walking
(mean 1.63) usi ng a univariate ANOVA. There were no
differences for the peroneus longus, and medial
gastrocnemius [22]. No additional data were able to be
obtained for further meta-analysis.
Discussion
This systematic review identified 11 studies ev aluating
biomechanical differences between barefoot and shod
gait in children. A total of 62 variables describing bare-
foot and shod walking and running were examined. The
maximum number of studies that were able to be com-
bined for met a-analyses was limited to five studies
between the three variables of stride length, walking velo-
city and cadence.
Walking
Children walked faster when wearing shoes. Since walk-
ing cadence was found to decrease, the increase in stride
Table 3 Mean differences and statistic al signi ficance for spatio-temporal variables for shod and barefoot walking
(Continued)
Walking (greater
flexibility)
Wolf et al. [8] 18 100.0% 2.20 [1.51, 2.89] 6.28 (P < 0.00001) N/A
Double support
(%)
Athletic Lythgo et al.* 898 100.0% 1.53 [1.30, 1.77] - 99%
Oxford Wegener et al. [23] 20 0.0% 2.49 [-14.15, 19.13] - -
Combined Pooled effect 918 100.0% 1.54 [1.27, 1.80] 11.40 (P < 0.00001) 99%
Single support
(%)
Athletic Lythgo et al. [7]* 898 100.0% -0.79 [-0.92, -0.65] 11.26 (P < 0.00001) 99%
Stance time (%) Athletic Lythgo et al. [7]* 898 98.50% 0.81 [0.70, 0.92] - -
Unknown Moreno-Hernandez
et al.[10]
61 1.5% 0.74 [-0.12, 1.60] - -
Combined Pooled effect 959 100.0% 0.81 [0.70, 0.92] 14.24 (P < 0.00001) 98%
Swing time (%) Shoe Moreno-Hernandez
et al.[10]
61 100.0% -0.74 [-1.60, 0.12] 1.68 (P = 0.09) N/A
Contact time
(ms)
Walking Kristen et al. [15] 30 100% 49.00 [-9.88, 107.88] 1.63 (P = 0.10) N/A
Angle of gait (°) Athletic Lythgo et al. [7]* 898 99.9% -0.03 [-0.34, 0.28] - 98%
Walking Wolf et al. [8] 18 0.1% -3.10 [-16.02, 9.82] - -
Combined Pooled effect 916 100.0% -0.03 [-0.35, 0.29] 0.19 (P = 0.85) 98%
Walking (greater
flexibility)
Wolf et al. [8] 18 100.0% -2.50 [-5.58, 0.58] 1.59 (P = 0.11) N/A
Progression
angle (°)
Oxford Wilkinson et al. [20] 31 100.0% -2.50 [-7.32, 2.32] 1.02 (P = 0.31) N/A
Athletic Wilkinson et al. [20] 30 100.0% -0.40 [-5.19, 4.39] 0.16 (P = 0.87) N/A
A negative mean difference value indicates a decrease during shod walking compared to barefoot walking. *Pooled effect calculated using inverse variance
method in Review manager 5.0 for all eligible reported data. N/A indicates not applicable.
Table 4 Mean differences and statistical significance for spatio-temporal variables for shod and barefoot running
Variable Shoe
Condition
Authors n Weighting Mean difference
[95%CI]
Statistical significance: z
Score (P)
Heterogeneity:
I
2
%
Running velocity
(m/s)
Unknown Lieberman et al.
[25]
17 100.0% -0.20 [-0.54, 0.14] 1.17 (P = 0.24) N/A
Sprinting velocity
(m/s)
Unknown Tazuke [26] 4 100.0% -0.16 [-0.77, 0.45] 0.52 (P = 0.60) N/A
A negative mean difference value indicates a decrease during shod running compared to barefoot running. N/A indicates not applicable
Wegener et al. Journal of Foot and Ankle Research 2011, 4:3
/>Page 7 of 13
Table 5 Mean differences and statistical significance for kinematic variables for shod and barefoot walking
Variable Shoe Condition Authors n Weighting Mean difference
[95%CI]
Statistical significance:
z Score (P)
Heterogeneity:
I
2
%
Hallux flexion ROM(°) Oxford Wegener
et al. [23]
20 64.5% -11.52 [-13.64,
-9.40]
Walking Wolf et al. [8] 18 35.5% -11.40 [-14.26,
-8.54]
Combined Pooled effect 38 100.0% -11.48 [-13.18,
-9.78]
13.22 (P < 0.00001) 0%
Walking (increased
flexibility)
Wolf et al. [8] 18 100.0% -9.30 [-12.29,
-6.31]
6.09 (P < 0.00001) N/A
Sagittal tibia-rearfoot ROM (°) Oxford Wegener
et al. [23]
20 43.5% 1.24 [-1.80, 4.28] - -
Walking Wolf et al. [8] 18 56.5% 4.10 [1.84, 6.36] - -
Combined Pooled effect 38 100.0% 2.86 [0.08, 5.64] 2.01 (P = 0.04) 54%
Walking (increased
flexibility)
Wolf et al. [8] 18 100.0% 3.20 [0.91, 5.49] 2.74 (P = 0.006) N/A
Sagittal tibia-foot ROM (°) Oxford Wilkinson
et al. [20]
27 49.3% 6.40 [3.40, 9.40] - -
Walking Wolf et al. [8] 18 50.4% -0.80 [-3.53, 1.93] - -
Combined Pooled effect 45 100.0% 2.75 [-4.31, 9.80] 0.76 (P = 0.45) 91%
Athletic Wilkinson
et al.[20]
26 100.0% 7.60 [4.13, 11.07] 4.29 (P < 0.0001) N/A
Walking (increased
flexibility)
Wolf et al. [8] 18 100.0% -1.00 [-3.82, 1.82] 0.70 (P = 0.49) N/A
Medial arch length ROM (°) Walking Wolf et al. [8] 18 100.0% -4.00 [-5.35, -2.65] 5.82 (P < 0.00001) N/A
Walking (increased
flexibility)
Wolf et al. [8] 18 100.0% -3.90 [-5.32, -2.48] 5.37 (P < 0.00001) N/A
’Subtalar’ rotation ROM(°) Walking Wolf et al. [8] 18 100.0% 0.90 [-0.09, 1.89] 1.78 (P = 0.07) N/A
Walking (increased
flexibility)
Wolf et al. [8] 18 100.0% 1.10 [0.11, 2.09] 2.18 (P = 0.03) N/A
Foot torsion ROM (°) Walking Wolf et al. [8] 18 100.0% -5.10 [-6.67, -3.53] 6.36 (P < 0.00001) N/A
Walking (increased
flexibility)
Wolf et al. [8] 18 100.0% -4.60 [-6.27, -2.93] 5.41 (P < 0.00001) N/A
Forefoot supination ROM (°) Walking Wolf et al. [8] 18 100.0% -1.90 [-3.48, -0.32] 2.36 (P = 0.02) N/A
Walking (increased
flexibility)
Wolf et al. [8] 18 100.0% -1.90 [-3.40, -0.40] 2.48 (P = 0.01) N/A
Foot rotation ROM (°) Walking Wolf et al. [8] 18 100.0% -2.20 [-4.88, 0.48] 1.61 (P = 0.11) N/A
Walking (increased
flexibility)
Wolf et al. [8] 18 100.0% -1.50 [-4.32, 1.32] 1.04 (P = 0.30) N/A
Forefoot width ROM (%) Walking Wolf et al. [8] 18 100.0% -5.40 [-6.97, -3.83] 6.74 (P < 0.00001) N/A
Walking (increased
flexibility)
Wolf et al. [8] 18 100.0% -3.80 [-5.37, -2.23] 4.74 (P < 0.00001) N/A
Midfoot sagittal plane ROM (°) Oxford Wegener
et al.[23]
20 100.0% -7.44 [-11.15,
-3.73]
3.93 (P < 0.0001) N/A
Midfoot frontal plane ROM (°) Oxford Wegener
et al. [23]
20 100.0% -3.07 [-5.04, -1.10] 3.06 (P = 0.002) N/A
Midfoot transverse plane ROM
(°)
Oxford Wegener
et al. [23]
20 100.0% -5.01 [-6.55, -3.48] 6.39 (P < 0.00001) N/A
Rearfoot frontal plane ROM (°) Oxford Wegener
et al. [23]
20 100.0% -1.68 [-4.27, 0.90] 1.28 (P = 0.20) N/A
Rearfoot transverse plane
ROM (°)
Oxford Wegener
et al. [23]
20 100.0% 0.39 [-2.52, 3.29] 0.26 (P = 0.79) N/A
Knee sagittal plane ROM (°) Oxford Wegener
et al. [23]
20 100.0% 9.21 [3.22, 15.21] 3.01 (P = 0.003) N/A
Knee frontal plane ROM (°) Oxford Wegener
et al. [23]
20 100.0% 0.02 [-1.48, 1.52] 0.02 (P = 0.98) N/A
Wegener et al. Journal of Foot and Ankle Research 2011, 4:3
/>Page 8 of 13
Table 5 Mean differences and statistical significance for kinematic variables for shod and barefoot walking (Continued)
Knee transverse plane ROM (°) Oxford Wegener
et al. [23]
20 100.0% -0.13 [-4.80, 4.55] 0.05 (P = 0.96) N/A
Hip sagittal plane ROM (°) Oxford Wegener
et al. [23]
20 100.0% 2.04 [-1.21, 5.29] 1.23 (P = 0.22) N/A
Hip frontal plane ROM (°) Oxford Wegener
et al. [23]
20 100.0% -0.40 [-2.39, 1.58] 0.40 (P = 0.69) N/A
Hip transverse plane ROM (°) Oxford Wegener
et al. [23]
20 100.0% 1.10 [-1.05, 3.25] 1.00 (P = 0.32) N/A
Ankle max dorsiflexion (°) Oxford Wilkinson
et al.[20]
27 100.0% -7.20 [-11.18,
-3.22]
3.54 (P = 0.0004) N/A
Athletic Wilkinson
et al.[20]
26 100.0% -1.70 [-5.45, 2.05] 0.89 (P = 0.37) N/A
Ankle angle at foot lift (°) Oxford Wilkinson
et al.[20]
27 100.0% -5.70 [-10.45,
-0.95]
2.35 (P = 0.02) N/A
Athletic Wilkinson
et al.[20]
26 100.0% -1.50 [-5.92, 2.92] 0.67 (P = 0.51) N/A
Ankle max plantarflexion (°) Oxford Wilkinson
et al.[20]
27 100.0% -0.70 [-5.94, 4.54] 0.26 (P = 0.79) N/A
Athletic Wilkinson
et al.[20]
26 100.0% 5.80 [1.58, 10.02] 2.69 (P = 0.007) N/A
Ankle ROM, foot lift to max
plantarflexion (°)
Oxford Wilkinson
et al.[20]
27 100.0% 5.00 [1.79, 8.21] 3.05 (P = 0.002) N/A
Athletic Wilkinson
et al.[20]
26 100.0% 7.30 [3.56, 11.04] 3.82 (P = 0.0001) N/A
A negative mean difference value indicates a decrease during shod walking compared to barefoot walking. N/A indicates not applicable.
Table 6 Mean differences and statistical significance for kinematic variables for shod and barefoot running
Variable Shoe
Condition
Authors n Weighting Mean difference
[95%CI]
Statistical significance: z
Score (P)
Heterogeneity:
I
2
%
Ankle angle at foot strike (°) Unknown Lieberman
et al. [25]
17 100.0% -6.80 [-13.52, -0.08] 1.98 (P = 0.049) N/A
Plantar foot angle at foot
strike (°)
Unknown Lieberman
et al. [25]
17 100.0% -9.70 [-16.43, -2.97] 2.83 (P = 0.005) N/A
Knee angle at foot strike (°) Unknown Lieberman
et al. [25]
17 100.0% -0.50 [-4.90, 3.90] 0.22 (P = 0.82) N/A
Knee lift angle (°) Unknown Tazuke [26] 4 100.0% -1.20 [-16.25, 13.84] 0.16 (P = 0.88) N/A
Knee angular velocity (°/s) Unknown Tazuke [26] 4 100.0% -160.59 [-304.34,
-16.83]
2.19 (P = 0.03) N/A
Swing-back velocity (°/s) Unknown Tazuke [26] 4 100.0% -84.24 [-158.64, -9.84] 2.22 (P = 0.03) N/A
A negative mean difference value indicates a decrease during shod running compared to barefoot running. N/A indicates not applicable.
Table 7 Mean differences and statistical significance for kinetic variables for shod and barefoot walking
Variable Shoe
Condition
Authors n Weighting Mean difference
[95%CI]
Statistical significance: z
Score(P)
Heterogeneity:
I
2
%
Vertical ground reaction force
(%BW)
Walking Kristen et al.
[15]
30 100.0% 6.30 [-2.82, 15.42] 1.35 (P = 0.18) N/A
Anterior Posterior Max GRF
(%BW)
Walking Kristen et al.
[15]
30 100.0% -0.90 [-3.66, 1.86] 0.64 (P = 0.52) N/A
Anterior Posterior Min GRF
(%BW)
Walking Kristen et al.
[15]
30 100.0% -1.00 [-5.99, 3.99] 0.39 (P = 0.69) N/A
A negative mean difference value indicates a decrease during shod walking compared to barefoot walking. N/A indicates not applicable.
Wegener et al. Journal of Foot and Ankle Research 2011, 4:3
/>Page 9 of 13
Table 8 Mean differences and statistical significance for kinetic variables for shod and barefoot running
Variable Shoe
Condition
Authors n Weighting Mean difference
[95%CI]
Statistical
significance:
z Score (P)
Heterogeneity:
I
2
%
Max vertical impact
force (BW)
Athletic Alcantara et al. [21]
(girls)
4 49.4% -0.32 [-0.42, -0.22] - -
Athletic Alcantara et al. [21]
(boys)
4 50.6% 0.05 [-0.01, 0.11] - -
Athletic Pooled effect 8 100.0% -0.13 [-0.50, 0.23] 0.72 (P = 0.47) 97%
Walking Alcantara et al. [21]
(girls)
4 49.9% -0.16 [-0.22, -0.10] - -
Walking Alcantara et al. [21]
(boys)
4 50.1% -0.68 [-0.73, -0.63] - -
Walking Pooled effect 8 100.0% -0.42 [-0.93, 0.09] 1.62 (P = 0.11) 99%
Rate of load at
impact (BW/s)
Athletic Alcantara et al. [21]
(girls)
4 49.5% -139.71 [-161.60,
-117.82]
Athletic Alcantara et al. [21]
(boys)
4 50.5% -43.64 [-56.16, -31.12] - -
Athletic Pooled effect 8 100.0% -91.24 [-185.38, 2.90] 1.90 (P = 0.06) 98%
Walking Alcantara et al. [21]
(girls)
4 49.6% -146.63 [-168.67, -124.59] - -
Walking Alcantara et al. [21]
(boys)
4 50.4% -41.88 [-54.47, -29.29] - -
Walking Pooled effect 8 100.0% -93.85 [-196.50, 8.80] 1.79 (P = 0.07) 98%
Long axis max tibial
acceleration (g)
Athletic Alcantara et al. [21]
(girls)
4 49.9% -2.16 [-2.61, -1.71] - -
Athletic Alcantara et al. [21]
(boys)
4 50.1% -0.94 [-1.37, -0.51] - -
Athletic Pooled effect 8 100.0% -1.55 [-2.74, -0.35] 2.54 (P = 0.01) 93%
Walking Alcantara et al. [21]
(girls)
4 49.7% -2.65 [-3.12, -2.18] - -
Walking Alcantara et al. [21]
(boys)
4 50.3% -1.67 [-2.11, -1.23] - -
Walking Pooled effect 8 100.0% -2.16 [-3.12, -1.20] 4.40 (P < 0.0001) 89%
Rate of tibia
acceleration (g/s)
Athletic Alcantara et al. [21]
(girls)
4 50.6% -252.59 [-292.21,
-212.97]
Athletic Alcantara et al. [21]
(boys)
4 49.4% -135.17 [-181.84, -88.50] - -
Athletic Pooled effect 8 100.0% -194.56 [-309.62, -79.49] 3.31 (P = 0.0009) 93%
Walking Alcantara et al. [21]
(girls)
4 56.4% -261.63 [-302.88,
-220.38]
Walking Alcantara et al. [21]
(boys)
4 43.6% -145.83 [-192.73, -98.93] - -
Walking Pooled effect 8 100.0% -211.13 [-242.11,
-180.16]
13.36 (P < 0.00001) 92%
Shock wave
transmission
as a ratio of
maximum
acceleration (g/BW)
Athletic Alcantara et al. [21]
(girls)
4 54.8% -0.35 [-0.57, -0.13] - -
Athletic Alcantara et al. [21]
(boys)
4 45.2% -0.59 [-0.86, -0.32] - -
Athletic Pooled effect 8 100.0% -0.46 [-0.69, -0.22] 3.84 (P = 0.0001) 45%
Walking Alcantara et al. [21]
(girls)
4 50.1% -0.14 [-0.40, 0.12] - -
Walking Alcantara et al. [21]
(boys)
4 49.9% -0.78 [-1.05, -0.51] - -
Walking Pooled effect 8 100.0% -0.46 [-1.09, 0.17] 1.43 (P = 0.15) 91%
A negative mean difference value indicates a decrease during shod running compared to barefoot running.
Wegener et al. Journal of Foot and Ankle Research 2011, 4:3
/>Page 10 of 13
length is parti cularly noteworthy. Possible e xplanations
for t he longer stride in shoes include that of an effective
increase of leg length of approximately 1 cm to 2 cm.
Indeed, in children aged between 5 and 6, a 7 cm increase
in stride length can be expected for a 4 cm increase in leg
length [7]. The increased stride length could also be due
to the increase in mass of the shod foot, which results in
increased inertia of the leg during the swing phase [9]. It
is also possible that the shoe provides a perception of
protection, giving confidence to the wearer to ‘stride out’.
Increased double-limb support time and base of sup-
port during shod walking might be indicat ive of modifi-
cations to the gait pattern to improve stability [27,28].
Shoes could act as a sensory filter by reducing proprio-
ceptive feedback, and leading to gait modifications to
improve stability [29]. The increased sole width of
shoes, compared to when barefoot, could also cause a
child to increase their base o f support to avoid contact
between feet. Alternatively the greater shoe ground con-
tact area compared to barefoot could result in the mea-
surement of an increase in the base of support. While
the increase of base of support was statistically signifi-
cant, the 1 cm increase of the distance between their
feet during walking may not be functionally significant.
The increased time spent in double support may be due
to the increased length and breadth of the shod foot
which in turn would lead to longer ground contact time
and delayed toe-off time during the gait cycle.
Spatio-temporal walking v ariables showed greater
homogeneity than studies investigating other categories
of biomechanical variables. Between two and five studies
were able to be combined for meta-analyses for 9 of the
17 spatio-temporal walking variables.
Shoes decrease the intrinsic motion of the foot during
walking. Eight of the nine range of motion variables
measuring foot motion were reduced in shoes. ‘Subtalar’
rotation was the only range of motion variable to
increase in one shoe condition, designed to have greater
flexibility, possibly because of the lateral lever arm effect
of footwear increasing ‘subtalar’ joint motion [30]. The
extent of the reduced foot motion indicates that shoes
have a splinting effect on foot joints. A consequence of
motion reduction could be that of less stimulus to foot
musculature and therefore muscle strength, since shoes
with increased flexibility have been shown to increase
foot muscle strength in adults [31].
The reduction of hallux motion that occurs while walk-
ing in shoes may adversely affect the ‘windlass’ mechan-
ism in which winding of the plantar aponeurosis around
the metatarsophalangeal joint during hallux extension
assists raising the medial longitudinal arch and inverting
the rearfoot following heel rise [32]. It is likely that the
increases in sagittal plane motion at the ankle and knee
are due to the increased stride length while walking in
shoes [8,23]. Unfortunately, meta-analysis of kinematic
variables was restricted by inconsistencies in biomechani-
cal models and under-reporting of standard deviations/
error. Meta-analysis of kinematic variab les could only be
performed for hallux ROM, tibia-rearfoot ROM and
tibia-foot ROM between two studies [8,20,23].
Running
Vertical ground reaction force does not seem to be
reduced by shoes during running. This interesting finding
concurs with adult footwear research showing that forces
are relatively unchanged during barefoot and shod run-
ning [33]. However, shoes appear to attenuate loading
since long-axis tibial acceleration was reduced during
shod running in children. In addition, there was a trend
for the rate of load at impact to be reduced by shoes.
Sprinting with shoes resulted in decreased angular
velocity of the knee joint and swing back velocit y of the
tibia [26]. The increased weight of shoes on the end o f
the foot and the consequent increase in the moment of
inertia may be responsible for these changes.
During shod running there was an increase in the preva-
lence of a rearfoot strike pattern from 62% barefoot to 97%
shod [25]. There was a corresponding decrease of forefoot
and midfoot strike patterns [25]. This change in pattern
from barefoot to shod running is a consistent finding with
that of adults [25,33]. It has previously been hypothesised
that a forefoot and midfoot strike pattern while running
barefoot is a strategy to improve shock attenuation [25,33].
Interestingly,themajorityofchildren(62%)ranwitha
rearfoot strike pattern whilst barefoot [25].
Quality assessment
The majority of the included studies had moderate metho-
dological quality. The main limitations were with external
and internal validity, selection and confounding biases.
Although blinding and randomisation are considered to
have the greatest confounding effects [13], only five studies
randomised the order of assessment [9,20-23] and no study
blinded the participants to shoe interventions. While blind-
ing is difficult to achieve with barefoot gait, randomisation
of assessment should be implemented in future studies to
improve methodological quality. While there was a potential
for bias in this review by including non-randomised studi es,
the effect of carryover between interventions in repeated
measures studies was considered small compared to the
chance of a type I error by not including these studies.
Clinical implications
In this systematic review, 45 of the 62 (73%) biomechani-
cal comparisons between barefoot and shod gait were
statistically significant. Shoes therefore have a substantial
effect on the gait of children. The extent of the biome-
chanical differences between barefoot and shod gait
Wegener et al. Journal of Foot and Ankle Research 2011, 4:3
/>Page 11 of 13
warrants further investigation into the effects of shoes on
long-term growth and development of children. While
the review included participants aged 1.6 to 15 years all
but 3 studies included children in middle childhood
(7-11 years), meaning extrapolation of the results of the
rev iew to children outside this age range should be done
with some caution. The clinical assessment of shoe and
in-shoe interventions in children should consider the
numerous effects of shoes on their gait. Perhaps a
standardised shod condition could be utilised during the
clinical assessment and prescription of in-shoe interven-
tions to ensure that any improvement is due to the inter-
vention, rather than the shoe only.
From this review it is not possible to prescribe the
optimal shoe for children. Nonetheless, previous reviews
have suggested that children’s shoes should be based on
the barefoot model [11]. However, since the design of
some of the shoes examined in the current review were
designed on these recommendations and still result in
considerable differences between barefoot and shod
walking [8], further refinement to children’ sshoesin
respect to foot function, proprioception and stab ility is
required. Future research could investigate the effects of
specific shoe modif ications on proprioception and the
walking and running gait of children. Further attention
could also be paid to reducing the weight of shoes
which may be responsible for some of the changes
found in children’s walking and running gait.
The findings of this review will help guide future
research, including the investi gation of the long-term
impacts of the differences between barefoot and shod
gait on paediatric growth and development. While diver-
sity in methodology is the nature of biomechanics
research, inconsistencies of variables investigated by dif-
ferent study groups restricted the pooling of data and
the ability t o draw clear conclusions. A universal set of
recommendations for reporting the most valid and reli-
able gait parameters might assist the evaluation of the
iatrogenic or the therapeutic effects of shoes. These vari-
ables should close ly reflect events or movements in the
gait cycle and avoid the creation of abstract composite
variables with r educed clinical or functional relevance.
A shift in reporting practices in the biomechanics litera-
ture to report change scores and their corresponding
variabi lity would assist future statistical meta-analy sis by
allowing the use of less conservative statistical tests such
as the generic inverse variance method, thereby reducing
the risk of type 1 error [13].
Conclusion
Shoes affect the gait of children. With shoes, children
walk faster by taking longer steps with greater ankle and
knee motion and increased tibialis anterior activity.
Shoes reduce foot motion and increase the support
phases of the gait cycle. During running, shoes reduce
swing phase leg speed, attenuate some shock and encou-
rage a rearfoot strike pattern. The impact of footwear on
gait should be considered when assessing the paediatric
patient and evaluating the effect of shoe or in-shoe
interventions.
Additional material
Additional file 1: Spatio-temporal variables for barefoot and shod
walking.
Additional file 2: Spatio-temporal variables for barefoot and shod
running.
Additional file 3: Kinematic variables for barefoot and shod
walking.
Additional file 4: Kinematic variables for barefoot and shod
running.
Additional file 5: Kinetic variables for barefoot and shod walking.
Additional file 6: Kinetic variables for barefoot and shod running.
Acknowledgements
CW is an Australian Postgraduate Award PhD Scholar. We thank Chrystal
Choi for developing the database search strategy.
Author details
1
Discipline of Exercise and Sports Science, Faculty of Health Sciences, The
University of Sydney, Cumberland Campus, PO Box 170, Lidcombe, 1825,
NSW, Australia.
2
Faculty of Health Sciences, The University of Sydney/Institute
for Neuroscience and Muscle Research, The Children’s Hospital at Westmead,
Locked Bag 4001 Westmead, NSW, 2145, Australia.
Authors’ contributions
CW led and designed the review, carried out searches, eligibility checks,
performed quality assessment, extracted data, performed meta-analysis,
interpreted the findings and drafted the manuscript. AEH assisted in
designing the review, carried out eligibility checks, performed quality
assessment, checked extracted data, assisted in the interpretation of the
findings and the drafting of the manuscript. BV assisted in designing the
review, performed quality assessment of studies published in German,
assisted in the interpretation of the findings and in the drafting of the
manuscript. JB assisted in designing the review methodology, interpretation
of the findings and in the drafting of the manuscript. RMS assisted in the
interpretation of the findings and in the drafting of the manuscript. All
authors read and approved the final manuscript.
Competing interests
The authors declare that they have no competing interests.
Received: 17 September 2010 Accepted: 18 January 2011
Published: 18 January 2011
References
1. Emslie M: Prevention of foot deformities in children. Lancet 1939,
234:1260-1263.
2. Rao UB , Jo seph B: The influence of footwear on the prevalence of
flat foot. A survey of 2300 children. JBoneJointSurgBr1992,
74:525-527.
3. Echarri JJ, Forriol F: The development in footprint morphology in 1851
Congolese children from urban and rural areas, and the relationship
between this and wearing shoes. J Pediatr Orthop B 2003, 12:141-146.
4. Gould N, Moreland M, Alvarez R, Trevino S, Fenwick J: Development of the
child’s arch. Foot Ankle 1989, 9:241-245.
Wegener et al. Journal of Foot and Ankle Research 2011, 4:3
/>Page 12 of 13
5. Wenger DR, Mauldin D, Speck G, Morgan D, Lieber RL: Corrective shoes
and inserts as treatment for flexible flatfoot in infants and children. J
Bone Joint Surg Am 1989, 71:800-810.
6. Kirtley C: Clinical Gait Analysis Theory and Practice Sydney: Elsevier Churchill
Livingstone; 2006.
7. Lythgo N, Wilson C, Galea M: Basic gait and symmetry measures for
primary school-aged children and young adults whilst walking barefoot
and with shoes. Gait Posture 2009, 30:502-506.
8. Wolf S, Simon J, Patikas D, Schuster W, Armbrust P, Doederlein L: Foot
motion in children shoes: A comparison of barefoot walking with shod
walking in conventional and flexible shoes. Gait Posture 2008, 27:51-59.
9. Oeffinger D, Brauch B, Cranfill S, Hisle C, Wynn C, Hicks R, Augsburger S:
Comparison of gait with and without shoes in children. Gait Posture
1999, 9:95-100.
10. Moreno-Hernández A, Rodríguez-Reyes G, Quiñones-Urióstegui I, Núñez-
Carrera L, Pérez-SanPablo AI: Temporal and spatial gait parameters
analysis in non-pathological Mexican children. Gait Posture 2010, 32:78-81.
11. Staheli LT: Shoes for children: a review. Pediatrics 1991, 88:371-375.
12. Walther M, Herold D, Sinderhauf A, Morrison R, Walther M, Herold D,
Sinderhauf A, Morrison R: Children sport shoes–A systematic review of
current literature. Foot Ankle Surg 2008, 14:180-189.
13. Higgins J, Green S, Eds: Cochrane Handbook for Systematic Reviews of
Interventions. Chichester: John Wiley & Sons Ltd; 2008.
14. Downs SH, Black N: The feasibility of creating a checklist for the
assessment of the methodological quality both of randomised and non-
randomised studies of health care interventions. J Epidemiol Community
Health 1998, 52:377-384.
15. Kristen KH, Kastner J, Holzreiter S, Wagner P, Engel A: Biomechanics of
children shoes using gait analyses in saddlers. Z Orthop Grenzg 1998,
136:457-462.
16. Barton C, Bonanno D, Menz H: Development and evaluation of a tool for
the assessment of footwear characteristics. J Foot Ankle Res 2009, 2:10.
17. Higgins JPT, Thompson SG, Deeks JJ, Altman DG: Measuring inconsistency
in meta-analyses. BMJ 2003, 327:557-560.
18. Lampe R, Mitternacht J, Gerdesmeyer L, Gradinger R: Plantar pressure
measurement in children and youths during sports activities. Klin Padiatr
2005, 217:70-75.
19. Gallifa Irujo O: Influencia cinetica en la marcha humana con diferentes
tipos de calzado. Dr. Universitat de Barcelona; 1992.
20. Wilkinson MJ: The effects of footwear on slected parameters of gait in
early independent walking. Masters thesis La Trobe University, Faculty of
Health Sciences; 1997.
21. Alcantara E, Perez A, Lozano L, Garica AC: Generation and transmission of
heel strike impacts in children running, footwear and gender influence.
In Proceedings of the XIV Symposium on biomechanics in sports: 25-29 June
1996; Funchal Edited by: Abrantes JMCS, Edicoes FMH 1996, 297-300.
22. Mueller S, Baur H, Hirschmueller A, Mayer F: Effects of orthotic insoles on
biomechanical gait characteristics in healthy children (Poster Session).
Isokinet Exerc Sci 2004, 12:80-81.
23. Wegener C, O’Meara DM, Smith RM, Hunt AE, Vanwanseele B: The effect of
school shoes on foot and leg motion during functional activies in
children. The University of Sydney, Faculty of Health Sciences; 2009.
24. Burns J, Ryan MM, Ouvrier RA: Evolution of foot and ankle manifestations
in children with cmt1a. Muscle Nerve 2009, 39:158-166.
25. Lieberman DE, Venkadesan M, Werbel WA, Daoud AI, D’Andrea S, Davis IS,
Mang ‘Eni RO, Pitsiladis Y: Foot strike patterns and collision forces in
habitually barefoot versus shod runners. Nature 2010, 463:531-535.
26. Tazuke S: The first step: which is better, the children’s sprint (50 m
running) with shoes or without shoes? - from the viewpoint of 2
dimensional biomechanical motion analyse. In proceedings of the 2004
Pre-Olympic Congress: 6-11 August 2004; Thessaloniki. Edited by: Klisouras V.
Aristotle University of Thessaloniki: Department of Physical Education
2004:315-316.
27. Menant JC, Perry SD, Steele JR, Menz HB, Munro BJ, Lord SR, Menant JC,
Perry SD, Steele JR, Menz HB, et al : Effects of shoe characteristics on
dynamic stability when walking on even and uneven surfaces in young
and older people. Arch Phys Med Rehabil 2008, 89:1970-1976.
28. Forssberg H: Ontogeny of human locomotor control. 1. Infant stepping,
supported locomotion and transition to independent locomotion. Exp
Brain Res 1985, 57:480-493.
29. Robbins S, Waked E, Allard P, McClaran J, Krouglicof N: Foot position
awareness in younger and older men: the influence of footwear sole
properties. J Am Geriatr Soc 1997, 45:61-66.
30. Nigg BM, Morlock M: The influence of lateral heel flare of running shoes
on pronation and impact forces. Med Sci Sports Exerc 1987, 19:294-302.
31. Bruggemann GP, Potthast W, Braunstein B, Niehoff A: Effect of increased
mechanical stimuli on foot muscles functional capacity. Proceedings of
the ISB XXth Congress - ASB 29th Annual Meeting: 31 July - 5 August 2005;
Cleveland 2005, 553.
32. Hicks JH: The mechanics of the foot. 2. The plantar aponeurosis and the
arch. J Anat 1954, 88:25-31.
33. De Wit B, De Clercq D, Aerts P:
Biomechanical analysis of the stance
phase during barefoot and shod running. J Biomech 2000, 33:269-278.
doi:10.1186/1757-1146-4-3
Cite this article as: Wegener et al.: Effect of children’s shoes on gait: a
systematic review and meta-analysis. Journal of Foot and Ankle Research
2011 4:3.
Submit your next manuscript to BioMed Central
and take full advantage of:
• Convenient online submission
• Thorough peer review
• No space constraints or color figure charges
• Immediate publication on acceptance
• Inclusion in PubMed, CAS, Scopus and Google Scholar
• Research which is freely available for redistribution
Submit your manuscript at
www.biomedcentral.com/submit
Wegener et al. Journal of Foot and Ankle Research 2011, 4:3
/>Page 13 of 13
![Báo cáo Y học: Effect of adenosine 5¢-[b,c-imido]triphosphate on myosin head domain movements Saturation transfer EPR measurements without low-power phase setting ppt](https://media.store123doc.com/images/document/14/rc/vd/medium_vdd1395606111.jpg)