Báo cáo y học: " Clinical utility of tibial motor and sensory nerve conduction studies with motor recording from the flexor hallucis brevis: a methodological and reliability study" pptx
Bạn đang xem bản rút gọn của tài liệu. Xem và tải ngay bản đầy đủ của tài liệu tại đây (340.06 KB, 9 trang )
METH O D O LOG Y AR T I C LE Open Access
Clinical utility of tibial motor and sensory nerve
conduction studies with motor recording from
the flexor hallucis brevis: a methodological and
reliability study
Kathleen M Galloway
1,2*†
, Mark E Lester
1†
and Rachel K Evans
1†
Abstract
Background: Standard tibial motor nerve conduction measures are established with recording from the abductor
hallucis. This technique is often technically challenging and clinicians have difficulty interpreting the information
particularly in the short segment needed to assess focal tibial nerve entrapment at the medial ankle as occurs in
posterior tarsal tunnel syndrome. The flexor hallucis brevis (FHB) has been described as an alternative site for
recording tibial nerve function in those with posterior tarsal tunnel syndrome. Normative data has not been
established for this technique. This pilot study describes the technique in detail. In addition we provide reference
values for medial and lateral plantar orthodromic sensory measures and assessed intrarater reliability for all
measures.
Methods: Eighty healthy female participants took part, and 39 returned for serial testing at 4 time points. Mean
values ± SD were recorded for nerve conduction measures, and coefficient of variation as well as intraclass
correlation coefficients (ICC) were calculated.
Results: Motor latency, amplitude and velocity values for the FHB were 4.1 ± 0.9 msec, 8.0 ± 3.0 mV and 45.6 ±
3.4 m/s, respectively. Sensory latencies, amplitudes, and velocities, respectively, were 2.8 ± 0.3 msec, 26.7 ± 10.1 μV,
and 41.4 ± 3.5 m/s for the medial plantar nerve and 3.2 ± 0.5 msec, 13.3 ± 4.7 μV, and 44.3 ± 4.0 msec for the
lateral plantar nerve. All values demonstrated significant ICC values (P ≤ 0.007).
Conclusion: Motor recording from the FHB provides technically clear waveforms that allow for an improved ability
to assess tibial nerve functio n in the short segments used to assess tarsal tunnel syndrome. The reported means
will begin to establish normal values for this technique.
Background
Posterior tarsal tunnel syndrome is a clinical description
of tibial nerve compression at the ankle, as the tibial
nerve pa sses through the tarsal tunnel posterior to the
medial malleolus. The tibial nerve then branches into
the medial plantar and lateral pl antar nerves either at
the level of the tarsal tunnel or immediately distal as the
branches enter the foot. In this same region, there are
calcaneal branches from the tibial nerve that supply
sensation to the inferior aspect of the heel [1]. Pes pla-
nus, activity level and lower extremity edema are factors
that have been proposed to create posterior tarsal tunnel
syndrome [1-5]. There are also reports of posterior tar-
saltunnelsyndromerelatedto foot deformities, [6,7]
tumor and varicosities [2,8-11].
Posterior tarsal tunnel syndrome m ay present with
select ive involvement of the medial plantar, lateral plan-
tar, and/or calcaneal branches of the tibial nerve
[2,6,12]. Clinical presentation of posterior tarsal tunnel
syndrome often includes burning in the sole of the foot
and may include pain in the inferior calcaneus. Nerve
conduction and electromyographic studies are
* Correspondence:
† Contributed equally
1
United States Army Research Institute of Environmental Medicine, Natick,
MA, USA
Full list of author information is available at the end of the article
Galloway et al. Journal of Foot and Ankle Research 2011, 4:14
/>JOURNAL OF FOOT
AND ANKLE RESEARCH
© 2011 Galloway et al; licensee BioMed Central Ltd. This is an Open Access article distributed under the terms of the Creative
Commons Attribution License (http://creativeco mmons.org/licenses/by/2.0), which permits unrestricted use, dist ribution, and
reproduction in any medium, pro vided the original work is properly cite d.
collectively referred to as electrodiagnostic studies which
are considered to be definitive objective tests for poster-
ior tarsal tunnel syndrome [2]. The complete electro-
diagnostic exam i ncludes evaluation for other as sociated
pathologies that may produce burning in the sole of the
foot to include lumbosacral radiculopathy and poly-
neuropathy. Once these pathologies have been evalu-
ated, the examiner assesses the conduction of the tibial
motor and sensory nerve branches across the tarsal tun-
nel [13].
The most common recording techniques for the med-
ial plantar motor branch o f the tibial nerve (S2-S3)
involve reco rding over the motor poin t of the abductor
hallucis muscle [ 13]. Proper ele ctrode placement over
the motor point of the muscle ensures a w aveform with
a clear initial negative deflection from baseline. The
latencyortimemeasureofthemotornerveisrecorded
at the point the waveform is initiated. Precise distance
and latency measurements are needed to ensure accu-
rate nerve conduction values [2].
Another muscle innervatedbythemedialplantar
motor branch of the tibial nerve (S2-S3) is the flexor
hallucis brevis (FHB) muscle. Recording from the FHB
may then give similar information to abductor hallucis.
The FHB has its proximal attachment over the plantar
aspect of the cuboid and lateral cuneiform bones, with
distal attachment on both the medial and lateral sides of
theproximalphalanxofthehallux.TheFHBactsto
flex the proximal phalanx of digit one. The muscul ature
of the plantar foot is often described in layers. There are
four layers with layer one being the most superficial and
layer four being the deepest layer. The abductor hallucis,
flexor digitorum brevis and abductor digiti minimi mus-
cles are described in layer one. The tendons of the
flexor ha llucis longus and flexor digitorum longus with
associated lumbricals and quadratus plantae are located
in layer two. The flexor hallucis brevis is described in
layer three with the more laterally placed adductor hal-
lucis and flexor digiti minimi brevis muscles. The dorsal
and plantar interosseous muscles are deepest and
located in layer four [1].
Normative values have been published for the tibial
motor nerve with recording from the abductor hallucis,
however recording from t he abductor hallucis some-
times leads to technical challenges [14-17]. In fact, Del
Toro et al indicate that there may be multiple motor
points in the abductor hallucis muscle, leading to diffi-
culty establishing a clear initial negative deflection from
baseline [17]. It becomes challenging to accurately
determine nerve conduction velocity without a clear
onset of the motor response. This is particularly difficult
when assessing a short segment such as tibial motor
nerve conduction velocity across the tarsal tunnel [18].
A minor deviation in laten cy marker placement can
have a large impact on the conduction velocity calcu-
lated in the tarsal tunnel segment. This technical diffi-
culty has led some clinicians to conclude that nerve
conduction studies are not highly sensitive in detecting
posterior tarsal tunnel syndrome, and some make the
diagnosis of posterior tarsal tunnel syndrome without
objective nerve c onduction or electromyographic find-
ings [7-9]. Powell reports a false negative result of 9.5%
with electrodiagnostic studies in posterior tarsal tunnel
syndrome [19].
Tibial motor nerve recording from the flexor hallucis
brevis muscle has been referenced as an alternative to
abductor hallucis recording [20]. This is clinically useful
since the FHB, like the abductor hallucis is supplied b y
the medial plantar nerve branch of the tibial nerve [1].
Felsenthal et al reported recording a medial plantar
motor latency response from the flexor hallucis brevis in
a trans-tarsal technique with 20 normal young adult
participants [20]. It is possible that recording from the
FHB may be valuable especially when recording from
the abductor ha llucis has become problematic. There
were no additional reported normative values or reliabil-
ity studies for recording from the FHB identified.
Tibial sensory conduction values also need to be eval-
uated in patients with possible tarsal tunnel syndrome
complaint s [13,20]. Updated normative values have been
published for both antidromic [21,22] and orthodromic
medial and lateral plantar sensory techniques [23,24].
There are, however, few well controlled studies using
adequate sample sizes to establish normative data for
tibial sensory n erve conduction values. Additionall y, the
reliability of these measures has not been well estab-
lished. Belen et al anecdotally reported good reliability
with an N of 41 participants using an orthodromic tech-
nique [23]. In addition, Loseth et al reported acceptable
intraobserver agreement of a single investigator per-
forming two separate medial plantar sensory conduction
studies on 22 healthy participants [25]. These authors
found no statistically significant difference between
amplitude and velocity measurements. They further
reported interobserver agreement between two observers
using the same technique on 46 participants and found
no significant differences between measurements [25].
The purpose of our study was to establish normative
values for motor studies recorded from the FHB, and to
provide additional reference values for medial and lat-
eral plantar orthodromic sensory measures. We also
sought to assess intrarater reliability for all techniques.
Methods
To establish normal values, 80 women between the ages
of 18 and 35 were recruited from the student and com-
munity populations surro unding a university in South-
eastern Michigan. A sub-group of 40 participants were
Galloway et al. Journal of Foot and Ankle Research 2011, 4:14
/>Page 2 of 9
available to participate in serial collections at 2, 4, and 6
months following the initial session to establish intra-
rater reliability of the measures. All participants
included in this analysis were participants in a larger
study of the effects of whole body vibration on bone
density in y oung women. The results of this larger pro-
ject are not yet published. The initial 80 participants
had nerve conductions completed prior to participating
in any whole body vibration intervention, while the 40
participants who returned for serial nerve conduction
studies were control participants for this s ame study.
Each participant read and signed a written informed
consent doc ument before proceeding with the study . A
screening questionnaire was used to determine whether
potential participants had a history of back pain, dia-
betes, peripheral neuropathy, polyneuro pathy, planned
pregnancy, kidney disease, foot pain, history of leg or
foot injury, cardiac pathology, current pregnancy, malig-
nancy, balance disorders or vascular pathology. Potential
participants with a history of the aforementioned condi-
tions were e xcluded, as were individuals who partici-
pated in weight bearing sporting activities more than
three times per week. Participants not excluded by med-
ical history or activity level were allowed to enroll in the
study. The institutional review boards at Oakland Uni-
versity, Rochester, MI, and the U.S. Army Research
Institute of Environmental Medicine, Natick, MA
approved the protocol and study design.
Participants reported to the research laboratory in ath-
letic attire (shor ts and t-shirts), w ith their shoes
removed. Height (cm) was measured using a stadi-
ometer, and body weight (kg) was recorded using a digi-
tal scale. A body mass index was calculated.
Motor and sensory nerve conduction values (latency,
amplitude and velocity) were assess ed on the non-domi-
nant leg using the Cadwell Sierra LT EMG machine
(Cadwell Laboratories, Inc ., Kennewick, WA). The parti-
cipant was asked to lie in a supine position on a treat-
ment table. Moist hot packs were applied to the foot in
order to maintain skin temperature at or above 29
degrees Celsius [16,26,27]. We established 29 degrees
Celsius as a lower limit for surface skin temperature as
in the Felsenthal study [20], however all participants
received a hot pack prior to examination and exceeded
this value. The hot pack was removed immediately prior
to nerve conduction evaluation. Skin temperature was
monitored at the dorsum of the foot using a digital sur-
face thermometer model 100A (VWR Scientific, West
Chester, PA 19380) throughout the examination to
maintain the temperature between 30 and 32 degrees
Celsius.
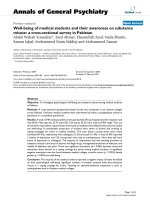
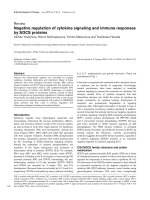
The tibial motor study was conducted with placement
of the active recording electrode over the motor point
of the flexor hallucis brevis muscle, and the refe rence
electrode 3 cm distal to the active recording electrode.
Placement of the active recording electrode was approxi-
mately 2 cm lateral and 3-4 cm distal to the navicular
tuberosity over the lateral head of the flexor hallucis
brevis, immediately to the lateral side of the flexor hallu-
cis longus tendon. The reference electrode was p laced 3
cm distal (Figure 1).
The distal stimulation site for the tibial motor nerve
was located 12 cm proximal to the reference electrode
posterior to the medial malleolus, however the recording
cathode was repositioned if a clear waveform was not
recorded. Separate supramaximal stimulations were
delivered posterior to the medial malleolus and at the
popliteal fossa using a square monophasic waveform, a
pulse width varying between 0.1 and 1.0 msec, and
intensity up to 100 mA. The skin was marked at each
stimulation site and the distance between them mea-
sured using a standard tape measure. Motor latencies
were recorded from the waveform onset. Motor ampli-
tude was measured from the waveform baseline to the
waveform peak.
The tibial (medial and lateral plantar) sensory study
was co mpleted by first placing the active recording elec-
trode posterior to the medial malleolus, and the refer-
ence electrode 3 cm proximal to the active recording
electrode. The stimulation point for the medial plantar
sensory nerve was placed between the first and second
metatarsals 12 cm distal to the recording electrode,
however if an adequate waveform could not be elicited,
the stimulating and/or recording electrodes were reposi-
tioned. The stimulation point for the lateral plantar sen-
sory nerve was between the fourth and fifth metatarsals
14 cm distal to the active recording electrode, again if
an adequate waveform could not be elicited; the stimu-
lating and/or recording electrodes were repositioned.
Latency was measured from the peak of the initial nega-
tive deflection and used to calculate conduction velocity.
Amplitude was measured from waveform peak to peak.
Descriptive statistics were used to present mean and
standard deviation values for all parameters at baseline
and at subsequent 8 week, 16 week and 24 week data
collection sessions. The root mean square error, stan-
dard error of the measurement, and minimal detectable
change values were also calculated for each parameter
to establish variability and determine a clinically mean-
ingful detectable difference. Two forms of the coefficient
of variation (CV) were calculated to include the variable
coefficient of variation to establish between participant
variability at a given time point. I n addition a model
coefficient of variation was calculated by dividing the
mean of the absolute value of the root mean square by
the group mean to establish within participant variability
over time. We examined reliability for serial measures
using an ANOVA technique to assure there were no
Galloway et al. Journal of Foot and Ankle Research 2011, 4:14
/>Page 3 of 9
significant differe nces between time points. Intraclass
correlations (ICC) ( model 3,1) were calculated to deter-
mine reliability between all time points for the nerve
conduction measures. Correlation coefficient values
greater than 0.5 were considered to indicate good relia-
bility [28]. Significance was set at P ≤ 0.05. Data were
analyzed using SPSS (Statistical Package for the Social
Sciences, version 16.0, SPSS Inc., Chicago, IL).
Results
Motor amplit ude and velocity parameters as well as the
medial and lateral plantar sensory nerve conduction
valuesandamplitudevalueswerefoundtohaveanor-
mal distribution. The motor latency, as well as the
medial plantar latency and lateral plantar sensory ampli-
tude and latency data was found to have a non-normal
positively skewed distribution. The motor latency data
was transformed with a square root as this most closely
approximated a normal curve. A natural logarithm
transformation was completed on the medial and lateral
plantar sensory amplitude and latency values to produce
the most normal curve for this data. All reliability calcu-
lations for skewed data were computed on normalized
data.
Eighty participants were present for baseline assess-
ment, and 39 participants were tested in four t est ses-
sions over 6 months. One outlier was removed from the
final analysis, so that 79 participants were included in
referenc
e
active
Figure 1 Recording sites for tibial motor study. Active and reference recording sites for the tibial motor study, located over the lateral head
of the flexor hallucis brevis muscle on the plantar surface of the foot, with the reference electrode distal.
Galloway et al. Journal of Foot and Ankle Research 2011, 4:14
/>Page 4 of 9
the baseline assessment. Participant characteristics are
presented separately for both groups (Table 1).
Tibial motor nerve recording from th e FHB y ie lded a
clear and consistent initial negative deflection from
baseline, as did all motor waveforms included in this
study. Motor and sensory mean ± SD nerve values, as
well as range and upper and lower limits of normal (± 2
SD), first, second, third quartiles and th e 10
th
and 90
th
percentiles at baseline are presented in Table 2.
The serial means ± SD as well as measures of reliabil-
ity (ICC) and variability including the variable coefficient
of variation and model coefficient of variation values are
presented in Table 3. ICC calculations were completed
on the raw data with the exception of the motor latency,
as well as the medial and lateral plantar sensory ampli-
tude and latency values in which the calculation wa s
completed on the transformed values.
Tibial motor (FHB) latency values demonstrated up to
16% variability between partic ipants and 24% variability
within participants. The motor FHB lat ency values
demonstrated an ICC value of 0.2 (P = 0.003). The med-
ial plantar sensory latency variability maximum values
were 10% between par ticipants and 9% wi thin partici-
pants. The medial plantar sensory latency study also
demonstrated good reliability with an ICC value of 0.5
( P < 0.001). The lateral plantar sensory latency coeffi-
cient of variation values displayed up to 10% variability
between participants and a maximum of 15% variability
within participants. The lateral plantar sensory latency
ICC value was 0.2 (P = 0.003).
Tibial motor FHB amplitudes demonstrated variability
ranges up to 36% between participants and 31% within
participants. The ICC value for the tibial FH B motor
amplitude revealed a correlation value of 0.2 (P =
0.001). Medial plantar sensory amplitude values demon-
strated variabi lity between and within participants up to
39% and 31% respectively. Medial plantar sensory ampli-
tude studies displayed an ICC value of 0.5 (P < 0.001).
The lateral plantar sensory amplitude revealed variability
ranging up to 45% between participants and 44% within
participants and an ICC value of 0.2 (P = 0.002).
Tibial motor FHB velocity coefficients of variation
revealed up to 7% variability between participants and
6% variability within parti cipants. The tibial motor FHB
velocity ICC value was 0.4 (P < 0.001). The medial plan-
tar sensory conduction velocity values revealed up to
10% variability both between and within participants.
The medial plantar sensory velocity reliability coefficient
was 0.4 (P < 0.001). The lateral plantar sensory co nduc-
tion velocity calculations demonstrated up to 10% varia-
bility between participants and 9% variability within
participants. The lateral plantar sensory velocity ICC
value revealed a value of 0.4 (P < 0.001).
Discussion
Our findi ngs indicate that tibial motor nerve recording
from the FHB is practi cal and reproducible. In addition,
Table 1 Participant description
N=79 N=38
Age (years) 23.6 ± 2.7 23.4 ± 2.6
Height (cm) 165.6 ± 6.4 166.0 ± 6.2
Weight (kg) 64.6 ± 12.4 62.8 ± 10.8
BMI 23.4 ± 3.4 22.7 ± 3.3
Anthropometric characteristics (mean ± SD) at baseline for 79 participants
(normative data analysis) and 38 participants returning for reliability testing.
Table 2 Tibial normative data
Mean ± SD Range Upper/lowerlimit Q1 Q2
Median
Q3 10
percentile
90
percentile
Tibial Motor (FHB)
Latency (ms)
11.5 cm distance
4.1 ± 0.9 2.9 - 7.0 < 5.9 3.5 3.9 4.6 3.2 5.5
Amplitude (mV) 8.0 ± 3.0 1.8 - 18.4 > 2.0 5.5 8.0 10.0 3.8 11.4
Velocity (m/s) 45.6 ± 3.4 39.4 - 54.4 > 39.0 43.1 45.4 48.3 41.0 50.0
Medial plantar Sensory
Latency (ms)
11.5 cm distance
2.8 ± 0.3 2.0 - 3.7 < 3.8 2.6 2.7 2.9 2.5 3.2
Amplitude (μV) 26.7 ± 10.1 6.6 - 40.9 > 6.5 20.3 26.8 35.4 13.7 43.1
Velocity (m/s) 41.4 ± 3.5 32.3 - 48.4 > 34.4 39.1 42.2 43.9 35.8 46.0
Lateral plantar sensory
Latency (ms)
14.0 cm distance
3.2 ± 0.5 2.3 - 6.0 < 4.2 2.9 3.1 3.3 2.7 3.7
Amplitude (μV) 13.3 ± 4.7 6.0 - 36.8 > 3.9 10.3 13.3 19.6 7.9 25.7
Velocity (m/s) 44.3 ± 4.0 34.5 - 52.7 > 36.3 41.8 45.0 46.9 39.2 49.5
Normative data for nerve conduction parameters (mean ± SD, range) with clinically relevant upper and lower limits presented as the value 2 SD above/below the
mean.
Footnote: Distances are rounded to the nearest 1/2 centimeter (cm). Q1 = first quartile, Q2 = second quartile, Q3 = third quartile.
Galloway et al. Journal of Foot and Ankle Research 2011, 4:14
/>Page 5 of 9
we have presented reference values for this approach in
a young adult female population. We have further added
to the body of normal values for orthodromic medial
and lateral plantar sensory studies . The American Asso-
ciation of Neuromuscular and Ele ctrodiagnostic Medi-
cine recommends both motor and sensory studies for
the evaluation of posterior tarsal tunnel syndrome, mak-
ing these tests particularly relevant [13].
Felsenthal et al reported recording the medial plantar
motor branch from the FHB muscle, however they
reported only latencies in a small number of participants
[20]. Our recording techniques differed from Felsenthal’s
description in that we recorded from the lateral head of
the FHB, while he described recording from the medial
head. We noted a clearer waveform with recording from
the lateral head, possibly due to positioning further
from the abductor hallucis. When using our described
technique for tibial motor recording, the recordi ng elec-
trode placement over the FHB needs to be located
immediately adjacent to the lateral side of the flexor hal-
lucis longus tendon to ensure placement is over the
FHB and not neighboring intrinsic muscles. The two
heads of the FHB surround the flexor hallucis longus
tendon. Neighboring intrinsic muscles would most likely
Table 3 Tibial reliability data
Mean ± SD ICC (3,1) P value MDC CV
variable
CV
model
Motor Flexor hallucis brevis Latency (ms) Baseline 4.2 ± 0.9 0.2 0.003 0.16
8 wks 4.2 ± 0.7 1.63 0.14 0.24
16 wks 4.3 ± 0.6 1.38 0.14 0.14
24 wks 4.3 ± 0.6 1.38 0.13 0.12
Amplitude (mV) Baseline 7.9 ± 2.9 0.5 < 0.001 0.36
8 wks 8.4 ± 2.7 4.97 0.32 0.31
16 wks 9.3 ± 2.7 4.69 0.29 0.23
24 wks 8.4 ± 2.8 4.69 0.34 0.20
Velocity (m/s) Baseline 45.3 ± 3.1 0.4 < 0.001 0.07
8 wks 44.5 ± 2.9 4.97 0.06 0.06
16 wks 44.1 ± 2.7 4.69 0.06 0.05
24 wks 43.9 ± 2.7 4.86 0.06 0.04
Medial plantar sensory Latency (ms) Baseline 2.8 ± 0.3 0.5 < 0.001 0.10
8 wks 2.8 ± 0.3 0.52 0.10 0.09
16 wks 2.8 ± 0.3 0.52 0.10 0.08
24 wks 2.8 ± 0.3 0.52 0.10 0.08
Amplitude (μV) Baseline 27.7 ± 9.8 0.5 < 0.001 0.35
8 wks 26.7 ± 9.4 16.34 0.36 0.31
16 wks 28.7 ± 11.1 17.22 0.39 0.27
24 wks 26.9 ± 10.3 17.91 0.39 0.31
Velocity (m/s) Baseline 41.0 ± 3.2 0.4 < 0.001 0.08
8 wks 45.3 ± 4.6 8.58 0.10 0.10
16 wks 44.3 ± 4.0 7.81 0.09 0.09
24 wks 43.8 ± 4.4 8.39 0.10 0.08
Lateral plantar sensory Latency (ms) Baseline 3.2 ± 0.3 0.3 < 0.001 0.10
8 wks 2.9 ± 0.3 0.64 0.10 0.15
16 wks 2.9 ± 0.3 0.64 0.10 0.10
24 wks 2.9 ± 0.3 0.64 0.10 0.09
Amplitude (μV) Baseline 15.8 ± 7.1 0.2 0.007 0.45
8 wks 14.9 ± 5.1 10.90 0.36 0.44
16 wks 14.9 ± 5.0 10.30 0.34 0.34
24 wks 15.2 ± 5.8 11.60 0.39 0.40
Velocity (m/s) Baseline 43.6 ± 3.4 0.4 < 0.001 0.08
8 wks 47.5 ± 4.1 8.77 0.09 0.09
16 wks 46.4 ± 4.4 9.38 0.10 0.09
24 wks 46.8 ± 4.6 9.83 0.10 0.08
Serial tibial nerve values (mean ± SD) for participants completing the reliability study (baseline, 8 wks, 16 wks, 24 wks) with intraclass correlation coefficient (ICC)
values, corresponding P values, variable coefficient of variation and model coefficient of variation (CV) values
Galloway et al. Journal of Foot and Ankle Research 2011, 4:14
/>Page 6 of 9
be the medial plantar motor innervated first lumbrical,
or the lateral plantar motor innervated oblique head of
the adductor hallucis muscle [1]. Our re cording location
just lateral to the flexor hallucis longus tendon main-
tains positioning over the first metatarsal and lateral
head of the FHB. This location would be distal to the
first lumbrical which although it is medial plantar inner-
vated is a very small muscle a nd not likely to be large
enough to impact the recording from the FHB. The
oblique head of the adductor hallucis lays deep and lat-
eral to the FHB muscle, so that if the recording elec-
trode is positio ned immediately next to the flexor
hallucis longus tendon, it is most likely to be recording
from the more superficial FHB. The first dorsal and
plantar interosseous muscles are also nearby, but are
deep to the adductor hallucis so that recording from the
interossei would be un likely with our montage. In addi-
tion, we have observed that supramaximal stimulation of
the medial plantar motor branch in the foot 5 cm proxi-
mal to the recording electrode over the FHB produces
the same waveform amplitude and morphology as does
stimulation of the tibial nerve pro per at the ankle. This
would indicate that this r ecording site is medial plantar
nerve supplied; ruling out the possibility of recording
from the lateral plantar innervated oblique head of the
adductor hallucis.
When examining a patient with suspected tarsal tun-
nel syndrome, tibial motor recording from the FHB may
be superior to the more commonly used abductor hallu-
cis. This i s especially significant, since the abducto r hal-
lucis has been noted to produce technical difficulty,
leading to error in assessing tarsal tunnel conduction
[17]. We did note a clear consistent initial negative
deflection from baseline with recording from the FHB in
all participants, which would improve the ability to
obtain an accurate nerve conduction velocity in a short
segment such as through the tarsal tunnel. We
attempted to approximate a clinical situation, however
this did lead to some limited amount of control particu-
larly in that foot size variations produced some varying
degree in distances used for the latency values. The
standard distance for motor recording electrodes to be
placed from the distal stimulating electrode is 8 cm
[2,14,16], however recording from such a distal point
over the FHB makes an 8 cm distance impractical in
that stimulation would then be applied in the foot rather
than at the ankle. Our established 12 cm distance for
the tibial motor and medial plantar sensory and our
established lateral plantar sensory distance of 14 cm
required some variation to produce an optimal response
in some participants. The motor and senso ry latency
valueswerequitestableovertimeindicatingthat
although there was some movement o f electrodes to
achieve the best waveform, a significant deviation was
not needed i n the majo rity of par ticipants. The m ean
distance from the motor and medial plantar sensory
recording electrodes to the distal stimulation site was
11.5 cm. The mean distance from the lateral plantar
sensory recording electrodes and the distal stimulation
site was 13.9 cm.
Calipers are sometimes used rather than tape mea-
sures to measure irregular surfaces such as in the arm
and axilla [16,29]. We chose a tape measure technique
for determining all distances including the foot, as we
felt it would more accurately assess the length of the
tibial nerve i n the medial ankle area. In a cadaver com-
parison o f surface measures of the radial nerve, it was
reported that surface tape measures more accurately
correlated with the length of the dissected nerve, than
did caliper measurements [29]. In addition, large norma-
tive tibial motor studies with recording from the abduc-
tor hallucis and flexor digiti minimi also used a tape
measur e to assess distances in the foot [14,30]. The var-
iation in distances used to produce an optimal waveform
is a limitation of our study, however it may indicate that
motor latency to the flexor hallucis brevis will be diffi-
cult to standardize clinically so that conduction velocity
through the tarsal tunnel may be the most ideal mea-
sure of distal motor function. It may also be particularly
useful to compare distal motor latency with the unin-
volved side when possible.
It is difficult to compare our sensory latency and con-
duction velocity values with other studies that used a
similar recording montage. The American Association
of Neuromuscular and Electrodiagnostic Medicine
recommends the use of peak medial and lateral plantar
values in the evaluation of potential posterior tarsal tun-
nel syndrome [13]. We also chose to use peak sensory
latency values as did Loseth et al [25], while Iyer et al
[21], Galardi et al [31], and Antunes et al [24] reported
latency and conduction velocity values from the onset of
the sensory waveform instead of the peak of the wave-
form. Not all normativ e studies maintained temperature
control, making a direct comparison with our results
difficult [21]. Loseth et al reported warming the limb if
surface temperature dropped below 27 degrees Celsius
[25]. Buschbacher reported warming the limb and moni-
toring temperature such that all limbs were greater than
31 degrees Celsius in normative tibial and peroneal
motor studies. No range of actual recorded temperatures
was reported [14,25,30,32]. Antunes et al evaluated sen-
sory potentials in an orthodromic fashion similar to our
protocol and reported establishing a fixed distance for
medial and lateral plantar sensory studies at 14 cm with
repositioning of the electrodes as needed to obtain an
adequate potential. They did not further report their
range o f distances in the event electrodes we re reposi-
tioned[24].Ponsfordetal[33]alsousedasimilar
Galloway et al. Journal of Foot and Ankle Research 2011, 4:14
/>Page 7 of 9
orthodromic technique, but did not report their dis-
tances. Ponsford e t al [33], Antunes et al [24] and
Loseth et al [25] did not make note of a caliper versus
tape measure technique. Utilizing the same distance for
medial and lateral plantar sensory studies would make a
direct comparison between the medial and lateral plan-
tar sensory latency valuable, however in some indivi-
duals it may be difficult to obtain the opti mal wa veform
at the same distance. It may be that due to callous for-
mation and large variations in foot size, sensory nerve
conduction velocities are a more accurate measure of
sensory nerve function in the foot than latency values.
Our sensory amplitude to SD ratios were similar to
those of previous normative studies [19,23,27,33] and
sensoryamplitudesarereportedlyhighlyvariableover
time [16]. We also recorded larger medial and lateral
plantar sensory amplitudes than reported in previous
studies using the same orthodromic mixed nerve techni-
que [21,25,33]. The larger amplitude values may be due
to the younger participant po pulation in our study as
compared with other published studies. Many authors
note that amplitude and velocity does decrea se with age,
and that tibial sensory values are difficult to obtain in
those over 60 years of age [14,25,31]. Body mass index
(BMI) may also be a factor in nerve conduction studies,
with Bushbacher reporting a decrement in recorded sen-
sory and mixed nerve amplitude values in those with
higher BMI values [34]. Our studied population had a
relatively low mean BMI with little variance. This may
further explain why our sensory amplitude values are
larger than those published previously.
A moderate degree of variability was noted in our
reported tibial (FHB) motor as well as medial plantar and
lateral plantar sensory amplitudes both within and
between participants. All amplitude parameters did, how-
ever, demonstrate a statistically significant correlation over
time. Latency parameters for all measures also revealed
significant correlations indicating that they are reliable
measures as well, even though some variation was noted
in the distance needed to produce an optimal potential.
The velocity values were the most stable measures with a
model motor coefficient of variability between 4 and 6%.
The medial and lateral plantar conduction velocity model
values were a little more varied with values that ranged
from 8-10% and 8-9% respectively.
We observed low ICC values for a number of our
measures. The ICC is the most robust and widely used
statistic to describe reliability of clinical tests. However,
the ICC is limited by the fact that its value is subject to
the variability of the sample used to construct it. The
ICC will be low if the variability of the sample is too
large, but is also susceptible to being low if the sample
from which it is cal cula ted has low variability (the sam-
ple is ver y homogenous). Despite a low ICC value for
several of our measures (tibial motor velocity, medial
plantar sensory amplitude and ve locity, lateral plantar
latency and velocity), the low variability of an indivi-
dual’s measurements over time allows some latitude to
be exercised in interpreting appropriate statistical relia-
bility. In other words, given the low temporal variability
of these measure s, we can be confident in identifying
differences in these measures over time, despite a low
ICC value. Similarly, the between participant variability
in our sample was quite low for latency (0.10-0.16) and
velocity (0.06-0.10) measures for both motor and sen-
sory studies, though the ICC values for these measures
ranged between 0.20 and 0.50. The fact that variability
between individuals consistently falls bel ow our
observed ICC values demonstrates the ability of these
values to serve as appropriate normal values for this
population of individuals.
The participants in this s tudy were women between
the ages of 18 and 35, so that res ults may no t be gener-
alizable to other ages and genders. Future studies should
include trans-tarsal conduction values, larger age ranges,
greater sample size, and greater geographic diversity and
should include men as well as women. A larger sample
size would allow for a calculation of percentiles among
different age groups as suggested by Obrien et al as a
more effective way of reporting normal values [35].
Conclusion
Our study results indicate that motor recording from
the FHB produces a clear and consistent initial negati ve
deflection from baseline, allowing for an accurate assess-
ment of nerve conduction velocity across the tarsal tun-
nel. This may make recording from the FHB preferable
in assessing posterior tarsal tunnel syndrome when tech-
nical challenges occur with abdu ctor hallucis recordi ng.
The motor recording from the FHB, as well as the
orthodromic medial and lateral plantar sensory values
have acceptable intra-rater reliability and variability.
Acknowledgements
The authors thank Amanda Antczak for her assistance with many aspects of
this project, as well as the participants from Oakland University and
surrounding areas for their time and dedication. The U.S. Army Medical
Research and Materiel Command Bone Health and Military Medical
Readiness Research Program supported this research, in part.
Author details
1
United States Army Research Institute of Environmental Medicine, Natick,
MA, USA.
2
Oakland University, Rochester, MI, USA.
Authors’ contributions
KG carried out the nerve conduction studies. KG performed statistical
analysis. All authors participated in the design and coordination of the study.
All authors helped draft the manuscript, and have read and approved the
final manuscript.
Competing interests
The authors declare that they have no competing interests.
Galloway et al. Journal of Foot and Ankle Research 2011, 4:14
/>Page 8 of 9
Received: 17 November 2010 Accepted: 24 May 2011
Published: 24 May 2011
References
1. Moore KL, Dalley AF, Agur AM: Clinically Oriented Anatomy. 6 edition.
Philadelphia: Lippincott Williams & Wilkins; 2009.
2. Oh SJ, Meyer RD: Entrapment neuropathies of the tibial (posterior tibial)
nerve. Neurol Clin 1999, 17:593-615, vi.
3. Trepman E, Kadel NJ, Chisholm K, Razzano L: Effect of foot and ankle
position on tarsal tunnel compartment pressure. Foot & Ankle
International 1999, 20:721-6.
4. Aldridge T: Diagnosing heel pain in adults. Am Fam Physician 2004,
70:332-8.
5. Kinoshita M, Okuda R, Yasuda T, Abe M: Tarsal tunnel syndrome in
athletes. Am J Sports Med 2006, 34:1307-12.
6. Budak F, Bamac B, Ozbek A, Kultuay P, Komsuoglu S: Nerve conduction
studies of lower extremities in pes planus subjects. Electromyogr Clin
Neurophysiol 2001, 41:443-6.
7. Garcher DJ, Lewis JE, DiDomenico LA: Hypertrophic sustentaculum tali
causing a tarsal tunnel syndrome: A case report. J Foot Ankle Surg 2001,
40:110-112.
8. Still G: Neurilemoma of the medial plantar nerve: a case report. J Foot
Ankle Surg 2001, 40:236-239.
9. Tsai C, Lin T, Lai C, Lin S: Tarsal tunnel syndrome secondary to
neurilemoma- a case report. Kaohsiung J Med Sci 2001, 17:216-220.
10. Spinner RJ, Dellon AL, Rosson GD, Anderson SR, Amrami KK: Tibial
intraneural ganglia in the tarsal tunnel: Is there a joint connection?
J Foot Ankle Surg 2007, 46:27-31.
11. Low HL, Stephenson G: These boots weren’t made for walking: tarsal
tunnel syndrome. CMAJ 2007, 176:1415-6.
12. Farooki S, Theodurou DJ, Sokoloff RM, Theodurou SJ, Trudell DJ, Resnick D:
MRI of the medial and lateral plantar nerves. J Comput Assist Tomogr
2001, 25:412-416.
13. Patel AT, Gaines K, Malamut R, Park TA, Del Toro DR, Holland N: Usefulness
of electrodiagnostic techniques in the evaluation of suspected tarsal
tunnel syndrome: an evidence-based review. Muscle Nerve 2005,
32:236-40.
14. Buschbacher RM: Tibial nerve motor conduction to the abductor hallucis.
Am J Phys Med Rehabil 1999, 78(6 Suppl):S15-20.
15. Fu R, DeLisa J, Kraft G: Motor nerve latencies through the tarsal tunnel in
normal adult subjects: standard determinations corrected for
temperature and distance. Arch Phys Med Rehabil 1980, 61
:243-8.
16. Kimura J: Electrodiagnosis in Diseases of Nerve and Muscle. 3 edition. New
York: Oxford University Press; 2001.
17. Del Toro DR, Park TA: Abductor hallucis false motor points:
electrophysiologic mapping and cadaveric dissection. Muscle Nerve 1996,
19:1138-43.
18. Brashear A, Kincaid J: The Influence of the Reference Electrode on CMAP
configuration: Leg Nerve Observations and an Alternative Reference
Site. Muscle Nerve 1996, 19:63-67.
19. Powell G: Electrodiagnosis: an overview. Clin Podiatr Med Surg 1994,
11:571.
20. Felsenthal G, Butler DH, Shear MS: Across-tarsal-tunnel motor-nerve
conduction technique. Arch Phys Med Rehabil 1992, 73:64-9.
21. Iyer KS, Kaplan E, Goodgold J: Sensory nerve action potentials of the
medial and lateral plantar nerve. Arch Phys Med Rehabil 1984, 65:529-30.
22. Kim W, Kim HJ, Blumenthal FS, Joynt RL: Antidromic sensory nerve
conduction studies of medial and lateral plantar nerves in normals.
Electromyogr Clin Neurophysiol 1993, 33:289-94.
23. Belen J: Orthodromic sensory nerve conduction of the medial and lateral
plantar nerves. A standardization. Am J Phys Med 1985, 64:17-23.
24. Antunes AC, Nobrega JA, Manzano GM: Nerve conduction study of the
medial and lateral plantar nerves. Electromyogr Clin Neurophysiol 2000,
40:135-8.
25. Loseth S, Nebuchennykh M, Stalberg E, Mellgren SI: Medial plantar nerve
conduction studies in healthy controls and diabetics. Clin Neurophysiol
2007, 118:1155-61.
26. Dumitru D, Amato AA, Zwarts M: Electrodiagnostic Medicine. 2 edition.
Philadelphia, Hanley and Belfus Inc; 2002.
27. Franssen H, Wieneke GH: Nerve conduction and temperature: necessary
warming time. Muscle Nerve 1994, 17:336-44.
28. Portney LG, Watkins MP: Foundations of clinical research: Applications to
practice. 3 edition. Upper Saddle River, Prentice Hall Health; 2008.
29. Kalantri A, Visser B, Dumitru D, Grant AE: Axilla to elbow radial nerve
conduction. Muscle Nerve 1988, 11:133-135.
30. Buschbacher RM: Tibial nerve conduction to the flexor digiti minimi
brevis. Am J Phys Med Rehabil 1999, 78:S21-S25.
31. Galardi G, Amadio S, Maderna L, Meraviglia MV, Brunati L, Dal Conte G,
et al: Electrophysiologic studies in tarsal tunnel syndrome. Diagnostic
reliability of motor distal latency, mixed nerve and sensory nerve
conduction studies. Am J Phys Med Rehabil 1994, 73:193-8.
32. Buschbacher RM: Peroneal nerve motor conduction to extensor
digitorum brevis. Am J Phys Med Rehabil 1999, 78:S26-S31.
33. Ponsford SN: Sensory conduction in medial and lateral plantar nerves.
J Neurol Neurosurg Psychiatry 1988, 51:188-91.
34. Buschbacher RM: Body mass index effect on common nerve conduction
study measurements. Muscle Nerve 1998, 21:1398-404.
35. O’Brien PC, Dyck PJ: Procedures for setting normal values. Neurology 1995,
45:17-23.
doi:10.1186/1757-1146-4-14
Cite this article as: Galloway et al.: Clinical utility of tibial motor and
sensory nerve conduction studies with motor recording from the flexor
hallucis brevis: a methodological and reliability study. Journal of Foot
and Ankle Research 2011 4:14.
Submit your next manuscript to BioMed Central
and take full advantage of:
• Convenient online submission
• Thorough peer review
• No space constraints or color figure charges
• Immediate publication on acceptance
• Inclusion in PubMed, CAS, Scopus and Google Scholar
• Research which is freely available for redistribution
Submit your manuscript at
www.biomedcentral.com/submit
Galloway et al. Journal of Foot and Ankle Research 2011, 4:14
/>Page 9 of 9