báo cáo khoa học: "Low-level expression of HER2 and CK19 in normal peripheral blood mononuclear cells: relevance for detection of circulating tumor cells" doc
Bạn đang xem bản rút gọn của tài liệu. Xem và tải ngay bản đầy đủ của tài liệu tại đây (377.45 KB, 10 trang )
BioMed Central
Page 1 of 10
(page number not for citation purposes)
Journal of Hematology & Oncology
Open Access
Research
Low-level expression of HER2 and CK19 in normal peripheral blood
mononuclear cells: relevance for detection of circulating tumor
cells
Fanglei You
†1
, Lisa A Roberts
†2
, S Peter Kang
4
, Raquel A Nunes
1
,
Cinara Dias
1
, J Dirk Iglehart
1,3
, Natalie A Solomon*
2
, Paula N Friedman
2
and
Lyndsay N Harris*
4
Address:
1
Department of Cancer biology/Adult Oncology, Dana-Farber Cancer Institute, Boston, MA 02115, USA,
2
Abbott Molecular, Inc. 1300 E.
Touhy Avenue, Des Plaines, IL 60018, USA,
3
Department of Surgery, Brigham and Women's Hospital, Boston, MA 02115, USA and
4
Section of
Medical Oncology, Yale University School of Medicine/Yale Cancer Center, 333 Cedar Street, New Haven, Connecticut 06520, USA
Email: Fanglei You - ; Lisa A Roberts - ; S Peter Kang - ;
Raquel A Nunes - ; Cinara Dias - ; J Dirk Iglehart - ;
Natalie A Solomon* - ; Paula N Friedman - ;
Lyndsay N Harris* -
* Corresponding authors †Equal contributors
Abstract
Background: Detection of circulating tumor cells (CTC) in the blood of cancer patients may have
prognostic and predictive significance. However, background expression of 'tumor specific
markers' in peripheral blood mononuclear cells (PBMC) may confound these studies. The goal of
this study was to identify the origin of Cytokeratin 19 (CK19) and HER-2 signal in PBMC and
suggest an approach to enhance techniques involved in detection of CTC in breast cancer patients.
Methods: PBMC from healthy donors were isolated and fractionated into monocytes,
lymphocytes, natural killer cells/granulocytes and epithelial populations using immunomagnetic
selection and fluorescent cell-sorting for each cell type. RNA isolated from each fraction was
analyzed for CK19, HER2 and Beta 2 microglobulin (B2M) using real-time qRT-PCR. Positive
selection for epithelial cells and negative selection for NK/granulocytes were used in an attempt to
reduce background expression of CK19 and HER2 markers.
Results: In normal PBMC, CK19 was expressed in the lymphocyte population while HER-2
expression was highest in the NK/granulocyte population. Immunomagnetic selection for epithelial
cells reduced background CK19 signal to a frequency of <5% in normal donors. Using negative
selection, the majority (74–98%) of HER2 signal could be removed from PBMC. Positive selection
methods are variably effective at reducing these background signals.
Conclusion: We present a novel method to improve the specificity of the traditional method of
detecting CTC by identifying the source of the background signals and reducing them by negative
immunoselection. Further studies are warranted to improve sensitivity and specificity of methods
of detecting CTC will prove to be useful tools for clinicians in determining prognosis and
monitoring treatment responses of breast cancer patients.
Published: 28 May 2008
Journal of Hematology & Oncology 2008, 1:2 doi:10.1186/1756-8722-1-2
Received: 25 April 2008
Accepted: 28 May 2008
This article is available from: />© 2008 You et al; licensee BioMed Central Ltd.
This is an Open Access article distributed under the terms of the Creative Commons Attribution License ( />),
which permits unrestricted use, distribution, and reproduction in any medium, provided the original work is properly cited.
Journal of Hematology & Oncology 2008, 1:2 />Page 2 of 10
(page number not for citation purposes)
Background
The presence of circulating tumor cells (CTC) in periph-
eral blood and disseminated tumor cells (DTC) in bone
marrow has been associated with negative clinical out-
comes in numerous studies [1-4]. The capacity to detect
CTC in the peripheral blood of cancer patients may pro-
vide a unique tool to determine prognosis and monitor
for recurrence of breast cancer [5-7]. Unlike currently
available tumor markers, the advantage of CTC might be
the ability to characterize tumor phenotype ex vivo, pro-
viding what could be considered as a 'virtual biopsy' of
tumor tissue.
While the study of CTC in circulation is an active area of
research, many challenges remain to accurately character-
ize these cells. Firstly, tumor cells in circulation are infre-
quent, ranging from 1/105 to 1/107 peripheral blood
mononuclear cells (PBMC), even in patients with meta-
static tumors[5]. In an effort to improve sensitivity, analy-
sis of gene expression using reverse transcription
polymerase chain reaction (RT-PCR) has been employed
for detection of micrometastases. While these methods
have increased sensitivity, and allow the detection of as
few as one epithelial cell in 107 mononuclear blood cells,
specificity remains an important problem [5]. One of the
factors that compromises the specificity of RT-PCR meth-
ods in detecting micrometastases is the background
expression of 'tumor markers' in normal peripheral
blood. Understanding the origin of background and
developing methods to selectively eliminate it is a critical
step to improving the specificity of the RT-PCR method.
The goal of this study is to identify the source of back-
ground signals for Cytokeratin 19 (CK19) and HER-2 in
PBMC and propose an approach to reduce the cells con-
tributing to the background to improve the specificity of a
currently available and sensitive method of detecting
CTC. We measured CK19 and HER2 in PBMC using quan-
titative, real-time RT-PCR after immunomagnetic selec-
tion for epithelial cells using BerEP4 antibody. We found
that CK19 signal was occasionally observed in the periph-
eral blood of normal controls, and that the HER2 signal
was frequently present in the peripheral blood of both
normal controls and breast cancer patients. In addition,
the HER2 signal seen in the blood of breast cancer
patients was not restricted to patients with HER2 positive
tumors. To better understand the source of the HER2 and
CK19 signals in peripheral blood, we isolated subpopula-
tions from the PBMC fraction and characterized them for
HER2 and CK19. Understanding the biology of the back-
ground expression of tumor markers will be instrumental
in development of more specific methods to detect CTC.
Materials and methods
Metastatic Breast Cancer Patient Blood samples
Blood samples were obtained from 120 untreated meta-
static breast cancer patients on an IRB-approved trial for
the study of biomarkers in blood of breast cancer patients.
HER2 levels were characterized by immunohistochemis-
try (DAKO Herceptest
®
) on primary tumors from these
patients and considered positive if the tumor showed 3+
membrane staining.
Isolation of PBMC from Whole Blood
Blood was collected from each human subject in 8 ml CPT
Vacutainer tubes (BD Biosciences) and centrifuged within
2 hours of a blood draw at 2800 rpm for 30 minutes at
room temperature in a Beckman CS-6R with a swinging
bucket rotor. The cells above the gel plug were resus-
pended in the plasma layer, washed once in 2% FBS, 0.6%
Sodium citrate, DPBS (without Ca
++
/Mg
++
) and centri-
fuged at 1200 rpm for 10 minutes to obtain the PBMC
fraction.
Serial Immunomagnetic Positive Selection
Thirty-two milliliters of blood was collected in 4 CPT
blood collection tubes from each of 4 healthy human sub-
jects under an approved IRB protocol. For each subject,
the PBMC fraction from one tube was resuspended in 1
mL 1% FBS, 0.6% Sodium citrate, DPBS (without Ca
++
/
Mg
++
) and subjected to immunomagnetic selection with
Dynal M450 Sheep anti-mouse magnetic particles coated
with 40 μg/mL BerEP4 antibody (Dako) per manufac-
turer's instructions.
Two tubes from each subject were resuspended in 2 mL
0.1% BSA, 1 mM EDTA, DPBS (without Ca
++
/Mg
++
) and
then subjected to serial immunomagnetic selection.
Briefly, Dynal M450 Sheep anti-mouse magnetic particles
were coated with 40 μg/mL α-CD3 antibody (clone
UCHT1, Dako), α-CD19 antibody (clone HD37, Dako),
α-CD14 antibody (clone M5E2, Pharminagen) or α-
CD16 antibody (clone 3G8, Pharminagen). Each PBMC
aliquot was incubated with 250 μL α-CD3 antibody and
50 μL α-CD19 coated particles for 1 hour at 2–8°C. The
magnetic beads were collected and the supernatants were
transferred to a new tube. The supernatants underwent
serial immunomagnetic selection with 100 μL α-CD14
coated magnetic particles followed by 25 μL α-CD16
coated microparticles. Each α-CD positively selected pop-
ulation was washed 3× with 2 mL BSA/EDTA buffer before
proceeding to RNA isolation. Cell selection efficiency and
specificity was determined by obtaining cell profiles on
the starting PBMC sample and each transferred superna-
tant using the Hematology Analyzer Abbott CellDyn
3000. The PBMC fraction from one tube per subject
underwent RNA isolation and served as a total RNA (unse-
lected) control.
Journal of Hematology & Oncology 2008, 1:2 />Page 3 of 10
(page number not for citation purposes)
Immunomagnetic Selection of Individual PBMC
Subpopulations
Seven CPT tubes (56 mL) were collected from each of 4
healthy human subjects under an IRB-approved protocol
and the PBMC fractions were isolated. Immunomagnetic
selection was performed using the protocol listed above.
Each tube was selected independently (BerEP4, α-CD3, α-
CD19, α-CD14, α-CD16, or α-CD56 (25 μL)). The super-
natants from these 6 tubes and the 7
th
, unselected, tube,
were gently spun down and the cells underwent RNA iso-
lation followed by HER-2, CK19 and B2M RNA quantita-
tion using the Real Time RT-PCR Assays.
RNA isolation and Real Time RT-PCR
RNA was isolated from each positive and negative selected
cell sample using the RNeasy
®
mini RNA isolation kit
(Qiagen) and eluted in 50 μL per the manufacturer's
instructions. Real-time RT-PCR for HER-2 was performed
with 5 μl of RNA template and the Promega Access Ampli-
fication kit (Promega Inc. Madison, WI) using 1.5 mM
MgSO
4
and 200 nM HER-2 primers, 300 nM HER-2 Taq-
man probe (Table 1: Sequence of primers used in the
paper). Real time RT-PCR was performed on a BioRad iCy-
cler with the following cycling conditions: 1 cycle at 48°C
for 45 minutes, 1 cycle at 95°C for 1 minute, 40 cycles of
96°C for 1 second, 66°C for 30 seconds.
For the CK19/B2M Duplex assay, 5 μl of RNA template
was added to 45 μl Master Mix (Promega Access Amplifi-
cation kit), using 2.0 mM MgSO
4
and 200 nM B2M For-
ward and Reverse primer, 300 nM B2M Vic Beacon, 250
nM CK19 Forward primer, 500 nM CK19 Reverse primer
and 300 nM CK19 FAM Beacon probe (Table 1: Sequence
of primers used in the paper). Individual RUO CK19 and
B2M primer/probe mixes are now available (Abbott
Molecular, Inc., Des Plaines, IL). Real time RT-PCR was
performed on an ABI Prism 7000 Real Time Thermalcycler
with the following cycling condition: 1 cycle at 48°C for
45 minutes, 1 cycle at 94°C for 1 minute, 5 cycles of 94°C
for 15 seconds, 63°C for 30 seconds followed by 40 cycles
of 94°C for 1 second, 62°C for 30 seconds, and 50°C for
30 seconds.
HER-2 and CK19 quantities were calculated using an
MDA-MB-361 breast cancer cell line standard curve and
expressed as MDA-MB-361 cell equivalents of RNA (ce).
B2M quantitation was determined from a normal human
PBMC pool RNA standard curve.
CK19 detection by the Abbott LCx method
Amplification was performed using unit dose vials con-
taining buffer, nucleotides and a thermostable polymer-
ase with reverse transcriptase activity. Prior to
amplification, the oligonucleotide mix, Mn
++
and 5 μL of
RNA were added to the unit dose vial. Thermal cycling
conditions were as follows: incubation at 60° for 60 min-
utes, then 94° for 40 seconds and 58° for 1 minute for 45
cycles. After cycling was complete, the temperature was
increased above the melting point of the amplification
product and quickly lowered to 12°C, to allow the detec-
tion probe present in the mix to anneal to dissociated
product strands and generate a detectable amplicon-probe
complex. Microparticle Enzyme Immunoassay (MEIA)
detection using the LCx
®
Analyzer (Abbott Laboratories)
was performed as previously described,[8] and the results
are reported as counts/sec/sec (c/s/s).
HER2 RT-PCR Assay Sensitivity
Approximately 1000, 500, or 100 SKBR3, MDA-MB-361,
MDA-MB-453 or MCF-7 Cells (ATCC) were spiked into
aliquots of 1 × 10
7
PBMC (Normal donor leukopak) and
subjected to immunomagnetic selection with BerEP4 anti-
body coated beads and RNA isolation per the protocols
above. One-tenth of each RNA sample was analyzed by
the HER2 qRT-PCR assay. One and 0.1 cell equivalent
samples were derived from 10 and 100 fold dilutions of
the 100 cell spiked RNA samples.
Cell Sorting by Flow Cytometry
The PBMC fraction was isolated from 6 CPT Vacutainer
blood tubes collected from one healthy human subject
per the protocol above. The PBMC were washed a total of
3 times, pooled and resuspended to 2.0 × 10
7
cells/mL in
RPMI 1640 media. 3.5 × 10
7
PBMC were incubated with
704 μL of α-CD3-Cy5, α-CD19-APC, α-CD16-FITC, and
α-CD14-PE (Pharminagen) in the dark for 30 minutes on
ice. The labeled cells were washed once in RPMI media,
filtered through a 35 μm mesh filter tube with strainer cap
(Falcon) and then placed in the cell sorter (MoFLO, Dako-
Cytomation Ft. Collins, CO). Two-thirds of the sample
Table 1: Sequence of primers used in the paper
Primer/Probe Sequence
Her-2 Forward Primer 5' CCCAACCAGGCGCAGAT 3'
Her-2 Reverse Primer 5' AGGGATCCAGATGCCCTTGTA 3'
Her-2 Taqman Probe 5' 6FAM-CGCCAGATCCAAGCACCTTCACCTT-TAMRA 3'
CK19 Forward Primer 5' CCGCGACTACAGCCACTACTACAC 3'
CK19 Reverse Primer 5' GAGCCTGTTCCGTCTCAAA 3'
CK19 FAM Beacon Probe 5' FAM-CGTGGTGCCACCATTGAGAACTCCAGGACCACG-BHQ1 3'
Journal of Hematology & Oncology 2008, 1:2 />Page 4 of 10
(page number not for citation purposes)
was sorted for α-CD16-FITC and α-CD14-PE while the
remaining third of the sample was sorted for α-CD19-
APC/α-CD3-Cy5 and α-CD16-FITC. Two million PBMC
were incubated with mouse isotype control antibodies
labeled with each fluorophore. These samples served as
negative controls to adjust the cell sorter instrument set-
tings. The isolated cells were characterized for purity after
sorting and then spun down and resuspended in RNeasy
lysis buffer for subsequent RNA isolation.
Results
Semi-quantitative RT-PCR LCx assays for CK19 and B2M
were developed to detect epithelial cells from the periph-
eral blood of patients with metastatic breast cancer. Figure
1 depicts a representative sample of 10 patients with met-
astatic breast cancer prior to adjuvant treatment (See Fig-
ure 1).
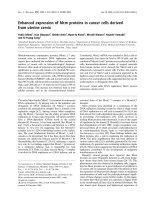
Sample 10 demonstrates the utility of the B2M assay to
assess RNA integrity as low B2M signal indicates that the
RNA is not adequate and the CK19 result cannot be inter-
preted. These assays were highly specific with CK19 signal
present in 50–60% of metastatic breast cancer patients (n
= 120) and <5% of normal donors (n = 75); however this
method was only semi-quantitative. To better characterize
circulating tumor cells, we developed quantitative RT-PCR
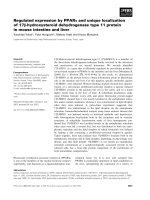
assays for CK19 and HER2 mRNA. To test the sensitivity
of HER2 detection, real time quantitative RT-PCR was per-
formed on BerEP4 immunomagnetic selected leukopak
blood spiked with serial dilutions of breast cancer cell
lines with varying levels of HER2 amplification [9,10]. In
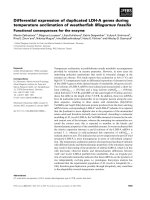
MDA-MB-361 and SK-BR3 cells, with relatively high
HER2 expression, real time RT-PCR could detect 0.1 cell
equivalent (ce) spiked into 8 mL of peripheral blood. The
detection limit increased to 10 ce and 50 ce per 8 mL in
cell lines expressing intermediate and low levels of HER2
(MDA-MB-453 and MCF7 respectively) (See Figure 2).
The sensitivity of the CK19 assay, as tested by dilutions of
the cell line RNAs, was approximately 0.01 ce for each cell
line (data not shown). Using this method in healthy con-
trol samples subjected to immunomagnetic selection with
BerEP4, we verified that HER2 was consistently expressed,
although at a lower level than in spiked samples.
We then further explored our ability to detect HER2
expressing CTC from patients and evaluated whether a
cut-off in HER2 expression could be established between
healthy controls/HER2 negative patients and HER2 posi-
tive patients with CTC. In this experiment, we subjected
peripheral blood samples from 36 patients with meta-
static breast cancer and 23 normal donors to immu-
nomagnetic enrichment for epithelial cells using the
BerEP4 antibody. After RNA extraction from the positively
selected cellular fraction, real time RT-PCR was performed
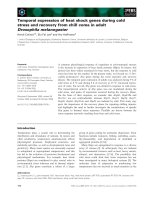
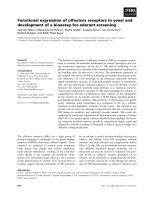
to detect HER2 mRNA in these samples. While there was
a distinct difference in the amount of HER2 signal in met-
astatic patients compared with normal controls, signifi-
cant overlap was seen between these populations (See
Figure 3) In addition, patients whose tumors were HER2
positive (black bars), were more likely to have a positive
signal for HER2 but considerable overlap was seen
Titration of cell lines for HER2 signalFigure 2
Titration of cell lines for HER2 signal. To test the sensi-
tivity of HER2 detection in blood, real time quantitative RT-
PCR was performed on RNA isolated from mock positive
controls of 8 ml of leukopak cells spiked with serial dilutions
of breast cancer cell lines with varying levels of HER2 expres-
sion. The control samples were immunomagnetically selected
with BerEP4 antibody prior to RNA isolation. Error bars rep-
resent the standard deviation of duplicate PCR reactions. If a
sample never crossed the threshold, it is plotted as zero on
this graph.
Number of Breast Cancer Cells Spiked into Leukopak (8ml)
Threshold Cycle (Ct)
0
10
20
30
40
100 50 10 1 0.1
SKBR3
MDA-MB-361
MDA-MB-453
MCF7
Detection of Cytokeratin 19 (CK19) by LCx in metastatic breast cancer patientsFigure 1
Detection of Cytokeratin 19 (CK19) by LCx in meta-
static breast cancer patients. Semi-quantitative RT-PCR
for CK19 and Beta2 microglobulin (B2M) was performed on
PBMC after BerEP4 immunomagnetic selection for malignant
epithelial cells from 10 patients with untreated metastatic
breast cancer. CK19 assays were run in duplicate on two
separate occasions with the average from each sample shown
using error bars. B2M assays were run once per sample as
previous experiments have shown the CV of duplicates to be
<2%. The change in fluorescent energy serves as the
reported value expressed in counts/sec/sec (c/s/s).
0
200
400
600
800
1000
1200
1400
12345678910
Patient Number
CK 19 Value by LCx (c/s/s)
CK19
B2M
Journal of Hematology & Oncology 2008, 1:2 />Page 5 of 10
(page number not for citation purposes)
between HER2 positive and negative tumors. This suggests
that the HER2 signal in peripheral blood might not be
specific for epithelial cells. Immunomagnetic selection
typically decreases the PBMC in the sample by 1000-fold
or more. However, in instances where the enrichment is
less than 1000-fold, it is possible to see some background
CK19 signal in samples from normal subjects (data not
shown). The levels of signal are lower than for HER2, but
still may confound the interpretation of the CK19 signal.
To better understand the source of HER2 and CK19 signal
from peripheral blood we isolated subpopulations of
mononuclear cells from blood of 4 normal donors for
measurement of these markers. PBMC were isolated by
gradient centrifugation and subjected to serial immu-
nomagnetic positive selection with antibody against
monocytes (CD14), lymphocytes (CD3/CD19), and nat-
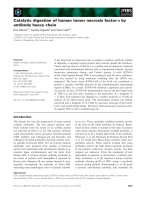
ural killer cells/granulocytes (CD16). We found that CK19
signal was most commonly expressed in the lymphocyte
population (CD3/CD19 population) (See Figure 4) A sec-
ond experiment from a new group of four normal donors
confirmed these findings showing that the lymphocyte
population (CD3/CD19) contained the highest CK19 sig-
nal and the NK cells/granulocytes (CD16) population
demonstrated the highest abundance of HER2 expression
in all 4 new donors (data not shown). Isolation of natural
killer cells using anti-CK56 antibody showed that these
cells were also a source of HER2; however, expression of
HER2 in this subpopulation varied by subject and was not
the only source of signal in the CD16 fraction.
To further confirm the sources of CK19 and HER2 signals
in peripheral blood, PBMC from a normal donor were
labeled with fluorescent conjugated antibodies to CD3/
HER2 signal after BerEP4 selection in normal donors, patient samples and SKBR3 spiked normal blood samplesFigure 3
HER2 signal after BerEP4 selection in normal donors, patient samples and SKBR3 spiked normal blood sam-
ples. Blood samples from 36 metastatic breast cancer patients, 23 normal donors and three normal donor samples spiked with
10 SKBR3 human breast cancer cells were subjected to BerEP4 immunomagnetic enrichment for epithelial cells. After RNA
extraction from the positively selected cellular fraction, HER2 and B2M expression were quantitated by real time qRT-PCR.
The standard curve was obtained by serial dilution of DNA from a HER2 positive breast cancer cell line (BT474). HER2 relative
expression per sample was calculated by obtaining the HER2 value/B2M value ratio for each sample and then normalizing
against the HER2/B2M ratio of Normal Control Sample N4, as it represented the median value for HER2 in normal samples.
Error bars represent the standard deviation of triplicate reactions. Normal controls are depicted by cross hatched mark. Sam-
ples from breast cancer patients are depicted in grey bars (HER2 negative tumors) and black bars (HER2 positive tumors).
Ratio HER2/B2M expression Normalized to Normal
Control Sample 4
Normal Controls Metastatic Breast Cancer Patients
Spikes
0
1
2
3
4
5
6
7
8
9
10
N1 N2 N3 N4 N5 N6 N7 N8 N10 N13 N14 N15 N16 N1 7 N18 N1 9 N20 N21 N22 N23 N12 N24 N25 50 63 75 76 59 67 52 62 53 74 51 69 49 65 72 73 77 78 79 80 81 82 83 84 85 86 143 144 147 148 57 56 55 70 54 64 10/ 1 10/ 2 10/3
100
200
blood sample from HER2
negative breast cancer patient
Normal blood spiked with
10 SKBR3 cells
Normal blood
blood sample from HER2
positive breast cancer patient
Journal of Hematology & Oncology 2008, 1:2 />Page 6 of 10
(page number not for citation purposes)
CK19 and HER2 RNA expression from serial immunomagnetic selection of peripheral blood mononuclear cells (PBMC) from 4 normal subjectsFigure 4
CK19 and HER2 RNA expression from serial immunomagnetic selection of peripheral blood mononuclear
cells (PBMC) from 4 normal subjects. Subpopulations of PBMC from 4 normal subjects (C, D, E, F) were isolated by serial
immunomagnetic selection with CD14 (monocytes), CD3/CD19 (lymphocytes), and CD16 (natural killer cells/granulocytes).
An additional PBMC sample from each subject underwent immunomagnetic selection with BerEP4 (epithelial cells) as a nega-
tive control. MDA-MB-361 RNA was used for standard curves when detecting CK19 and HER2. RNA from normal leukocytes
was used for standard curve for B2M detection. End cells: cells remaining after the serial selection. Panel A. CK19 signal
detected using quantitative real-time RT-PCR and expressed as cell equivalents of MDA-MB-361 from epithelial cell and mono-
nuclear cell subfractions. Panel B. HER2 signal detected using quantitative real-time RT-PCR and expressed as cell equivalents
of MDA-MB-361 from epithelial cell and mononuclear cell subfractions.
A
50 10
CK 19
B2M
C D
E
F
C D E
C D
E
FC
DE
FC DE F
CD3/CD19 ells P4CD14 CD16 End c Ber E
45
0
1
2
3
4
5
6
7
8
9
B2M Cell Equivalents (X10
5
)
CK19 Cell Equivalents (X10
-2
)
40
35
30
25
20
15
10
5
0
Antibod
y
used for selection
10
12
14
16
18
9
10
B
B2M
HER 2
HER2 Cell Equivalents (X10
–2
)
B2M Cell Equivalents (X10
5
)
8
7
6
5
8
4
6
3
4
2
2
1
C D E F
C D E C D E F C D E F C D E F
CD3/C 19D lls 4CD14 CD16 End ce Ber EP
0 0
Antibod
y
used for selection
Journal of Hematology & Oncology 2008, 1:2 />Page 7 of 10
(page number not for citation purposes)
CD19 (Magenta), CD16 (green), and CD14 (red) and
subjected to FACS analysis (See Figure 5A–D). This
method was highly effective at purification of cellular sub-
types with 93.7%, 96.4% and 96.5% purity for CD16,
CD14 and CD3/19 fractions respectively. RNA from these
subpopulations was isolated and subjected to quantitative
RT-PCR for CK19 and HER2. These experiments again
demonstrated that the CK19 signal was observed predom-
inantly in the lymphocyte population (CD3/CD19),
although some expression of CK19 in the monocyte
(CD14) population was seen (See Figure 5E, F) Confirm-
ing the results of immunomagnetic selection experiments,
HER2 expression was predominantly seen in the CD16
population (NK/granulocytes) (See Figure 5G.H).
HER2 expression per cell, based on the ratio of HER2 to
B2M, was significantly higher than CK19 (CD3/CD19
500×, CD16 40,000×, CD14 300×). Therefore, it appears
that fewer CD16 positive cells are required to generate
background HER2 expression.
In an attempt to deplete HER2 signal in peripheral blood,
and improve the specificity of detection of HER2 overex-
pressing breast cancer cells, we performed negative selec-
tion with increasing amounts of α-CD16-labeled
immunomagnetic beads using blood from three normal
donors. This resulted in a dose-dependent depletion of
HER2 mRNA from the supernatant, suggesting that this
subpopulation was the source of the HER2 signal (See Fig-
ure 6) In addition, it appears that part of the HER2 signal
can be removed from the peripheral blood, although
baseline HER2 and the efficiency of HER2 selection varied
by donor (74–98%). Therefore, negative selection for
CD16 is one method whereby contaminating HER2
PBMC might be removed in studies of circulating cancer
cells.
Discussion
The study of circulating tumor cells is an important area
of research with various clinical implications. Accumu-
lated evidence suggests that CTC detected in the blood
and DTC detected in the bone marrow of breast cancer
patients are independent prognostic factors of disease free
and overall survival [1,11-17]. The clinical impact of CTC
in the blood and DTC in the bone marrow and the fact
that CK19 positive cells present in the bone marrow were
shown to have clonogenic potential suggest that these
cells are unlikely to be benign 'innocent bystanders'[18].
The capacity to detect CTC in peripheral blood gives
researchers non-invasive and more practical ways to use
these markers in a wider clinical setting. However, techni-
cal challenges associated with detecting small numbers of
malignant cells in the peripheral blood have limited the
use of this approach. The development of ultra-sensitive
molecular biological techniques has facilitated this very
important area of research; however specificity issues
remain a concern.
As with IHC, cytokeratins are most the frequently used tar-
gets to detect breast cancer cells in bone marrow or
peripheral blood using RT-PCR. In serial dilution assays,
RT-PCR detects CK expression from 1 tumor cell in 10
6
or
10
7
mononuclear cells [19-21]. However, PCR can be
associated with false positive results – the most important
limitation of this technique [5,22,23]. False positives are
thought to result mainly from three sources: 1) amplifica-
tion of pseudogenes from contaminating genomic DNA;
2) amplification of illegitimately transcribed genes by
hematopoietic cells and 3) amplification of epithelial
genes from contaminating non-tumor cells [24-27].
Researchers have shown that careful primer design can
eliminate the first issue[28]. However, the other two
sources of false positive results are difficult to deal with
using a highly sensitive method such as RT-PCR. Quanti-
tative, real-time RT-PCR allows quantitation of the tran-
script; therefore, differences in expression between
normal and tumor cells may be better appreciated[29]. In
addition, the quantitation of expression may allow assess-
ment of expression levels of the target and provide addi-
tional information concerning the biology of the target
being studied.
We identified the major source of CK19 in PBMC to be the
lymphocyte population. Our experience also shows that it
is possible to reduce CK19 background to a certain level
(when the enrichment for CTC is over 1000-fold) by
immunomagnetic selection and use this method to detect
circulating tumor cells in clinical patients, with improved
specificity.
Limited data exists on the expression of HER2 in
micrometastatic cells. Braun, et al. have evaluated the
presence of HER2 positive cells in the bone marrow of
breast cancer patients by IHC or PCR. HER2 signal was
positively correlated with a higher tumor stage but was
not found to be associated with any established prognos-
tic factors, including the expression of HER2 in the pri-
mary tumor[30]. Patients whose bone marrow cells
demonstrated HER2 expression had a worse survival and
HER2 expression in these cells was an independent prog-
nostic factor. Although these results are intriguing, the
population in this study was small. Furthermore, the dis-
cordance between expression in the bone marrow and the
primary tumor is unexpected as HER2 expression is gener-
ally maintained in tumor cells throughout cancer progres-
sion and into the metastatic deposits[31]. Other
investigators have attempted to measure HER2 in malig-
nant cells in the circulation, and also report discordance
Journal of Hematology & Oncology 2008, 1:2 />Page 8 of 10
(page number not for citation purposes)
A-D Flow cytometry sorting of peripheral blood mononuclear cells (PBMC) subpopulations: CD3/CD19, CD14, and CD16Figure 5
A-D Flow cytometry sorting of peripheral blood mononuclear cells (PBMC) subpopulations: CD3/CD19,
CD14, and CD16. PBMC were incubated with an antibody cocktail of CD3-Cy5, CD19-APC, CD16-FITC, and CD14-PE,
then placed in the cell sorter. This method showed 93.7%, 96.4% and 96.5% purity for CD16, CD14 and CD3/19 fractions
respectively. E-H. CK19 and HER2 signal was detected in sorted subpopulations of Peripheral Blood Mononu-
clear Cells. RNA from subpopulations of flow cytometry sorted cells was isolated and subjected to quantitative RT-PCR for
CK19, HER2, and B2M. HER2 and CK19 expression/cell was calculated as the ratio of HER2/CK19 cell equivalents over the
total number of PBL cells within the sample (determined using B2M expression). E. CK19 expression in sorted normal PBL. F.
CK19 expression/cell in sorted normal PBL. G. HER2 expression in sorted normal PBL. H. HER2 expression/cell in sorted
normal PBL
F
I
T
C
L
o
g
10
3
10
2
10
1
10
0
10
3
10
2
10
1
10
0
10
3
10
2
10
1
10
0
Neutrophil/NK cells after sort
PE Log
10
3
10
2
10
1
10
0
PMT1 Log
P
E
C
Y
5
L
o
g
T and B cells after sort
CD 16 FITC 93.7%
CD 14 PE 1.5%
CD3
PECY5
96.5%
F
I
T
C
L
o
g
10
3
10
2
10
1
10
0
10
3
10
2
10
1
10
0
PE Log
Monocytes after sort
P
M
T
1
L
o
g
10
3
10
2
10
1
10
0
0
1023
Starting PBMC Sample
PE Log
Monocytes
T and B cells
NK cells
Neutrophils
CD14 PE
96.4%
CD16
FITC
0.1%
Size 90.6%
A
B
CD
B2M Cell Equivalents (X10
5
)
CK19 Cell Equivalents (X10
–2
)
Cytokeratin 19
Cell number by B2M
0
2
4
6
8
10
12
14
16
18
20
CK19 Cell Equivalents/Cell (X 10
–8
)
B2M Cell Equivalents (x 10
5
)
HER-2 Cell Equivalents (x10)
0
5
10
15
20
HER-2 Cell Equivalents/Cell (X 10
–4
)
HER2
Cell number by B2M
EF
GH
C
D
1
4
C
D
1
6
C
D
3
/
1
9
T
o
t
a
l
C
D
1
4
C
D
1
6
C
D
3
/
1
9
T
o
t
a
l
0
2
4
6
8
10
12
14
CD14 CD16 CD3/19 total PBMC
Antibody used for cell sorting
0
1
2
3
4
5
6
7
0
5
10
15
20
25
30
35
40
CD14 CD16 CD3/19 total PBMC
0
1
2
3
4
5
6
7
Antibody used for cell sorting
Antibody used for cell sorting
Antibody used for cell sorting
Journal of Hematology & Oncology 2008, 1:2 />Page 9 of 10
(page number not for citation purposes)
between expression of HER2 in circulating cells compared
with the primary tumor[6,32].
Our findings are consistent with the notion that white
blood cells present in blood or bone marrow may be the
source of false positive readings for HER2, and express this
marker at an unexpectedly high per cell level in peripheral
blood natural killer cell and granulocyte populations.
While the expression of HER2 in normal PBMC may still
be much lower than HER2 levels in malignant tumors that
overexpress the gene, the relative frequency of malignant
epithelial cells in the circulation is much lower than that
of the mononuclear cells (1 per 10
5
–10
7
) making the
background signal an important source of false positive
results. In addition, the problem of background expres-
sion of HER2 in PBMC is more pronounced than that
observed with CK19. The relative levels of HER2 are lower
than CK19 in epithelial cells, (even in cells with an ampli-
fied HER2 gene) while the expression of HER2 is higher
than the expression of CK19 in PBMC. The negative selec-
tion we used reduced the background HER2 to some
extent, but is still not specific enough to be used in a clin-
ical setting.
Conclusion
In conclusion, we present a novel approach to improve
the specificity of the established method to detect CTC by
identifying the source of the background signals and
reducing them by the proposed method of negative
immunoselection. Our method was successful in reducing
background CK19 signals, which will improve specificity
in detecting CTC. However, based upon our experience, it
is still premature to use HER2 as an RT-PCR marker for cir-
culating tumor cells until the development of improved
methods of negative and positive selection to remove the
source of background signals from peripheral blood sam-
ples.
Non invasive and highly specific and sensitive methods of
detecting CTC will prove to be extremely useful tools for
clinicians in diagnosing breast cancers, determining prog-
nosis and monitoring treatment responses. More effort
should be invested in optimizing these methods.
List of abbreviations
CTC: Circulating tumor cells; PBMC: Peripheral blood
mononuclear cells; CK19: Cytokeratin; B2M: Beta 2
microglobulin; RT-PCR: Reverse transcription polymerase
chain reaction
Competing interests
Lisa A Roberts and Natalie A Solomon are employed by
Abbott Molecular, Inc.
Paula N Friedman was employed by Abbott Molecular,
Inc. at the time of the study.
Fanglei You, S. Peter Kang, Raquel A. Nunes, Cinara Dias,
J. Dirk Iglehart and Lyndsay N. Harris declare that they
have no competing interests
Authors' contributions
FY Participated in the design of the study, carried out
molecular studies, and drafted manuscript, LR Partici-
pated in the design of the study, carried out molecular
studies, and drafted manuscript, SPK Reviewed draft and
revised of the manuscript, RN Carried out molecular stud-
ies and reviewed manuscript, CD Carried out molecular
studies, DI Participated in the design of the study and
reviewed manuscript, NS Participated in the design of the
study, involved in drafting and revision of the manuscript,
PF Participated in the design of the study, interpretation of
data, involved in drafting and revision of the manuscript,
LNH Designed the study, involved in analysis and inter-
pretation of data, drafted and revised manuscript. All
authors read and approved the final manuscript
Acknowledgements
Support provided by the Dana-Farber Harvard Cancer Center SPORE in
Breast Cancer, Grant # DAMD17-01-1-0220
References
1. Braun S, Vogl FD, Naume B, Janni W, Osborne MP, Coombes RC,
Schlimok G, Diel IJ, Gerber B, Gebauer G, Pierga JY, Marth C, Oruzio
D, Wiedswang G, Solomayer EF, Kundt G, Strobl B, Fehm T, Wong
GY, Bliss J, Vincent-Salomon A, Pantel K: A pooled analysis of
bone marrow micrometastasis in breast cancer. N Engl J Med
2005, 353:793-802.
2. Cote RJ, Rosen PP, Lesser ML, Old LJ, Osborne MP: Prediction of
early relapse in patients with operable breast cancer by
Increasing volume of CD16 beads resulted in HER2 signal depletionFigure 6
Increasing volume of CD16 beads resulted in HER2
signal depletion. Negative selection was performed on 3
PBL samples per 3 normal subjects with increasing amounts
of CD16-labelled immunomagnetic beads. HER2 RNA
expression was measured in both the CD16 selected cells
(beads) and unselected cells (supernatant) by Real-time qRT-
PCR. Data is expressed as the percent HER2 signal in each
subfraction (bead or supernatant) over total HER2 signal for
that subject.
0
20
40
60
80
100
120
25
Normal Donor 1
CD 16 Bead Volume (ul)
Percentage of HER2 Expression (%)
Beads
Supernatant
50 100
25 50 100 25 50 100
Normal Donor 2 Normal Donor 3
Journal of Hematology & Oncology 2008, 1:2 />Page 10 of 10
(page number not for citation purposes)
detection of occult bone marrow micrometastases. J Clin
Oncol 1991, 9:1749-1756.
3. Berger U, Bettelheim R, Mansi JL, Easton D, Coombes RC, Neville
AM: The relationship between micrometastases in the bone
marrow, histopathologic features of the primary tumor in
breast cancer and prognosis. Am J Clin Pathol 1988, 90:1-6.
4. Diel IJ, Kaufmann M, Costa SD, Holle R, von Minckwitz G, Solomayer
EF, Kaul S, Bastert G: Micrometastatic breast cancer cells in
bone marrow at primary surgery: Prognostic value in com-
parison with nodal status. J Natl Cancer Inst 1996, 88:1652-1658.
5. Bostick PJ, Chatterjee S, Chi DD, Huynh KT, Giuliano AE, Cote R,
Hoon DS: Limitations of specific reverse-transcriptase
polymerase chain reaction markers in the detection of
metastases in the lymph nodes and blood of breast cancer
patients. J Clin Oncol 1998, 16:2632-2640.
6. Hayes DF, Walker TM, Singh B, Vitetta ES, Uhr JW, Gross S, Rao C,
Doyle GV, Terstappen LW: Monitoring expression of her-2 on
circulating epithelial cells in patients with advanced breast
cancer. Int J Oncol 2002, 21:1111-1117.
7. Cristofanilli M, Budd GT, Ellis MJ, Stopeck A, Matera J, Miller MC,
Reuben JM, Doyle GV, Allard WJ, Terstappen LW, Hayes DF: Circu-
lating tumor cells, disease progression, and survival in meta-
static breast cancer. N Engl J Med 2004, 351:781-791.
8. Marshall RLCJ, Friedman P, Hayden M, Hodges S, Holas C, Jennings C,
Jou CK, Kratochvil J, Laffler T, Lewis N, Scheffel C, Traylor D, Wang
L, Solomon N: Detection of gb virus c by the rt-pcr lcx system.
J Virol Methods 1998, 73:99-107.
9. Jarvinen TA, Tanner M, Rantanen V, Barlund M, Borg A, Grenman S,
Isola J: Amplification and deletion of topoisomerase iialpha
associate with erbb-2 amplification and affect sensitivity to
topoisomerase ii inhibitor doxorubicin in breast cancer. Am
J Pathol 2000, 156:839-847.
10. Kauraniemi P, Hautaniemi S, Autio R, Astola J, Monni O, Elkahloun A,
Kallioniemi A: Effects of herceptin treatment on global gene
expression patterns in her2-amplified and nonamplified
breast cancer cell lines. Oncogene 2004, 23:1010-1013.
11. Berger U, Bettelheim R, Mansi JL, Easton D, Coombes RC, Neville
AM: The relationship between micrometastases in the bone
marrow, histopathologic features of the primary tumor in
breast cancer and prognosis. Am J Clin Pathol 1988, 90:1-6.
12. Mansi JL, Easton D, Berger U, Gazet JC, Ford HT, Dearnaley D,
Coombes RC: Bone marrow micrometastases in primary
breast cancer: Prognostic significance after 6 years' follow-
up. Eur J Cancer 1991, 27:1552-1555.
13. Salvadori B, Squicciarini P, Rovini D, Orefice S, Andreola S, Rilke F,
Barletta L, Menard S, Colnaghi MI: Use of monoclonal antibody
mbr1 to detect micrometastases in bone marrow specimens
of breast cancer patients. Eur J Cancer 1990, 26:865-867.
14. Molino A, Pelosi G, Micciolo R, Turazza M, Nortilli R, Pavanel F, Cetto
GL: Bone marrow micrometastases in breast cancer
patients. Breast Cancer Res Treat 1999, 58:123-130.
15. Braun S, Pantel K, Muller P, Janni W, Hepp F, Kentenich CR, Gastroph
S, Wischnik A, Dimpfl T, Kindermann G, Riethmuller G, Schlimok G:
Cytokeratin-positive cells in the bone marrow and survival of
patients with stage i, ii, or iii breast cancer. N Engl J Med 2000,
342:525-533.
16. Braun S, Kentenich C, Janni W, Hepp F, de Waal J, Willgeroth F, Som-
mer H, Pantel K: Lack of effect of adjuvant chemotherapy on
the elimination of single dormant tumor cells in bone mar-
row of high-risk breast cancer patients. J Clin Oncol 2000,
18:80-86.
17. Janni W, Gastroph S, Hepp F, Kentenich C, Rjosk D, Schindlbeck C,
Dimpfl T, Sommer H, Braun S: Prognostic significance of an
increased number of micrometastatic tumor cells in the
bone marrow of patients with first recurrence of breast car-
cinoma. Cancer 2000, 88:2252-2259.
18. Ross AA, Cooper BW, Lazarus HM, Mackay W, Moss TJ, Ciobanu N,
Tallman MS, Kennedy MJ, Davidson NE, Sweet D, et al.: Detection
and viability of tumor cells in peripheral blood stem cell col-
lections from breast cancer patients using immunocyto-
chemical and clonogenic assay techniques. Blood 1993,
82:2605-2610.
19. Moscinski LC, Trudeau WL, Fields KK, Elfenbein GJ: High-sensitiv-
ity detection of minimal residual breast carcinoma using the
polymerase chain reaction and primers for cytokeratin 19.
Diagn Mol Pathol 1996, 5:173-180.
20. Datta YH, Adams PT, Drobyski WR, Ethier SP, Terry VH, Roth MS:
Sensitive detection of occult breast cancer by the reverse-
transcriptase polymerase chain reaction. J Clin Oncol 1994,
12:475-482.
21. Fields KK, Elfenbein GJ, Trudeau WL, Perkins JB, Janssen WE, Moscin-
ski LC: Clinical significance of bone marrow metastases as
detected using the polymerase chain reaction in patients
with breast cancer undergoing high-dose chemotherapy and
autologous bone marrow transplantation. J Clin Oncol 1996,
14:1868-1876.
22. Krismann M, Todt B, Schroder J, Gareis D, Muller KM, Seeber S,
Schutte J: Low specificity of cytokeratin 19 reverse tran-
scriptase-polymerase chain reaction analyses for detection
of hematogenous lung cancer dissemination. J Clin Oncol 1995,
13:2769-2775.
23. Burchill SA, Bradbury MF, Pittman K, Southgate J, Smith B, Selby P:
Detection of epithelial cancer cells in peripheral blood by
reverse transcriptase-polymerase chain reaction. Br J Cancer
1995, 71:278-281.
24. Ruud P, Fodstad O, Hovig E: Identification of a novel cytokeratin
19 pseudogene that may interfere with reverse tran-
scriptase-polymerase chain reaction assays used to detect
micrometastatic tumor cells. Int J Cancer 1999, 80:119-125.
25. Zippelius A, Kufer P, Honold G, Kollermann MW, Oberneder R,
Schlimok G, Riethmuller G, Pantel K: Limitations of reverse-tran-
scriptase polymerase chain reaction analyses for detection
of micrometastatic epithelial cancer cells in bone marrow. J
Clin Oncol 1997, 15:2701-2708.
26. Mapara MY, Korner IJ, Hildebrandt M, Bargou R, Krahl D, Reichardt
P, Dorken B: Monitoring of tumor cell purging after highly effi-
cient immunomagnetic selection of cd34 cells from leuka-
pheresis products in breast cancer patients: Comparison of
immunocytochemical tumor cell staining and reverse tran-
scriptase-polymerase chain reaction. Blood 1997, 89:337-344.
27. Eltahir EM, Mallinson DS, Birnie GD, Hagan C, George WD, Purush-
otham AD: Putative markers for the detection of breast car-
cinoma cells in blood. Br J Cancer 1998, 77:1203-1207.
28. Stathopoulou A, Ntoulia M, Perraki M, Apostolaki S, Mavroudis D,
Malamos N, Georgoulias V, Lianidou ES: A highly specific real-
time rt-pcr method for the quantitative determination of ck-
19 mrna positive cells in peripheral blood of patients with
operable breast cancer. Int J Cancer 2006, 119:1654-1659.
29. Wynendaele WAJ, Paridaens RP, et al.: Quantification of ck 19
mrna in peripheral blood from breast cancer (breast cancer)
patients and healthy volunteers by a real-time reverse-tras-
criptase polymerase chain reaction (rt-pcr). Proc Am Soc Clin
Oncol 2000, 19:381.
30. Braun SHI, Schlimok G: The her 2 oncogene identifies breast
cancer stem cells: Prognostic and therapeutic implications.
Proc Breast Cancer Res Treat 1999, 57:. Abstract 509
31. Carlsson J, Nordgren H, Sjostrom J, Wester K, Villman K, Bengtsson
NO, Ostenstad B, Lundqvist H, Blomqvist C: Her2 expression in
breast cancer primary tumours and corresponding metas-
tases. Original data and literature review. Br J Cancer 2004,
90:2344-2348.
32. Meng S, Tripathy D, Shete S, Ashfaq R, Haley B, Perkins S, Beitsch P,
Khan A, Euhus D, Osborne C, Frenkel E, Hoover S, Leitch M, Clifford
E, Vitetta E, Morrison L, Herlyn D, Terstappen LW, Fleming T, Fehm
T, Tucker T, Lane N, Wang J, Uhr J: Her-2 gene amplification can
be acquired as breast cancer progresses. Proc Natl Acad Sci USA
2004, 101:9393-9398. Epub 2004 Jun 9311.