báo cáo khoa học: "Toxicity of CdSe Nanoparticles in Caco-2 Cell Cultures" pptx
Bạn đang xem bản rút gọn của tài liệu. Xem và tải ngay bản đầy đủ của tài liệu tại đây (4.55 MB, 15 trang )
BioMed Central
Page 1 of 15
(page number not for citation purposes)
Journal of Nanobiotechnology
Open Access
Research
Toxicity of CdSe Nanoparticles in Caco-2 Cell Cultures
Lin Wang
1
, Dattatri K Nagesha
2
, Selvapraba Selvarasah
3
,
Mehmet R Dokmeci
3
and Rebecca L Carrier*
1
Address:
1
Chemical Engineering Department, Northeastern University, Boston, MA, 02115, USA,
2
Physics Department, Northeastern University,
Boston, MA, 02115, USA and
3
Electrical and Computer Engineering Department, Northeastern University, Boston, MA, 02115, USA
Email: Lin Wang - ; Dattatri K Nagesha - ; Selvapraba Selvarasah - ;
Mehmet R Dokmeci - ; Rebecca L Carrier* -
* Corresponding author
Abstract
Background: Potential routes of nanomaterial exposure include inhalation, dermal contact, and
ingestion. Toxicology of inhalation of ultra-fine particles has been extensively studied; however,
risks of nanomaterial exposure via ingestion are currently almost unknown. Using enterocyte-like
Caco-2 cells as a small intestine epithelial model, the possible toxicity of CdSe quantum dot (QD)
exposure via ingestion was investigated. Effect of simulated gastric fluid treatment on CdSe QD
cytotoxicity was also studied.
Results: Commercially available CdSe QDs, which have a ZnS shell and poly-ethylene glycol (PEG)
coating, and in-house prepared surfactant coated CdSe QDs were dosed to Caco-2 cells. Cell
viability and attachment were studied after 24 hours of incubation. It was found that cytotoxicity
of CdSe QDs was modulated by surface coating, as PEG coated CdSe QDs had less of an effect on
Caco-2 cell viability and attachment. Acid treatment increased the toxicity of PEG coated QDs,
most likely due to damage or removal of the surface coating and exposure of CdSe core material.
Incubation with un-dialyzed in-house prepared CdSe QD preparations, which contained an excess
amount of free Cd
2+
, resulted in dramatically reduced cell viability.
Conclusion: Exposure to CdSe QDs resulted in cultured intestinal cell detachment and death;
cytotoxicity depended largely, however, on the QD coating and treatment (e.g. acid treatment,
dialysis). Experimental results generally indicated that Caco-2 cell viability correlated with
concentration of free Cd
2+
ions present in cell culture medium. Exposure to low (gastric) pH
affected cytotoxicity of CdSe QDs, indicating that route of exposure may be an important factor
in QD cytotoxicity.
Background
Nanotechnology offers many benefits in various areas,
such as drug delivery, imaging, water decontamination,
information and communication technologies, as well as
the production of stronger, lighter materials [1]. Synthesis
of nanomaterials has become increasingly more common
since the early 1980s. Various kinds of nanomaterials,
such as quantum dots (QDs), carbon nanotubes, and
fullerenes, have been synthesized, and quite a few have
been commercialized (e.g. CdSe QDs, carbon nanotubes).
The nanotechnology market is predicted to be valued at
$1 trillion by 2012, so the likelihood of exposure to syn-
Published: 23 October 2008
Journal of Nanobiotechnology 2008, 6:11 doi:10.1186/1477-3155-6-11
Received: 16 March 2008
Accepted: 23 October 2008
This article is available from: />© 2008 Wang et al; licensee BioMed Central Ltd.
This is an Open Access article distributed under the terms of the Creative Commons Attribution License ( />),
which permits unrestricted use, distribution, and reproduction in any medium, provided the original work is properly cited.
Journal of Nanobiotechnology 2008, 6:11 />Page 2 of 15
(page number not for citation purposes)
thesized nanomaterials will exponentially increase [1,2].
Thus, there is an immediate need for research to address
uncertainties about the health and environmental effects
of nanoparticles. The interactions of nanoparticles with
cells and tissues are poorly understood in general, but cer-
tain diseases have been proven to be associated with
uptake of nanoparticles. For example, the inhalation of
nanoparticales is associated with silicosis, asbestosis and
"black lung" [3,4].
Potential routes of nanomaterial exposure include inhala-
tion, dermal contact, and ingestion. Toxicology of inhala-
tion of atmospheric ultra-fine particles and nanoparticles
in general has been extensively studied compared to other
exposure routes, such as dermal contact or ingestion [5].
Nanomaterials may be delivered into the gastrointestinal
(GI) tract via accidental ingestion by people who work in
the nanomaterial manufacturing industry or nanomate-
rial research laboratories, or by drinking or eating water or
food which is contaminated by nanoindustry waste.
Inhaled nanoparticles trapped in the mucus of the respira-
tory tract can also be swallowed and trans-located into the
GI tract. In the human GI tract, the production of acid and
enzymes by the gastric mucosa can influence properties of
ingested nanomaterials. The gastric phase for food diges-
tion may last 3–4 hours. During this time, ingested mate-
rials are processed by acids and enzymes, and the pH in
the stomach may decrease to 1 [6]. Thus, ingested nano-
materials may spend enough time in this acidic environ-
ment to be broken down and possibly generate toxic
compounds.
Small intestinal epithelial cells form a monolayer lining
the surface of the small intestinal lumen; they separate the
intestinal lumen from the systemic circulation and pre-
vent the uptake of toxic compounds and invasion of bac-
teria through the GI tract [7-9]. Ingested nanoparticles, if
toxic, or toxic compounds generated during digestion,
may injure intestinal epithelial cells. Disruption of intes-
tinal epithelium may impair its protective function [8,9].
In this report, we specifically examined the possible cyto-
toxicity of CdSe QDs to intestinal cells. It has been
reported that cadmium-based QDs are cytotoxic to cells
due to the release of Cd
2+
ions and generation of reactive
oxygen species (ROS) [10-13]. A number of studies in ani-
mal models have suggested that ordinary small intestinal
epithelial cells are capable of the uptake of nanoparticles
with sizes smaller than 200 nm [14-16]. In addition, a
large body of literature suggests that QDs are able to cross
cell membrane due to their small sizes [10,12,17,18]. It
was reported that after exposure to QDs, lysosomes of
cells tended to enlarge and occupy more intracellular
space, and QDs resided preferentially in lysosomes [10].
Lysosomes have a fairly low pH (~4.5) compared with
~7.2 for the cytosol, and this acidic environment may
break down QDs and release free Cd.
Due to the ability of some nanomaterials to cross cell
membranes, translocation across intestinal epithelium is
one possible route of transport into blood circulation. The
translocation of nanoparticles to the blood stream could
result in transport to and uptake by organs, such as the
brain, heart, liver, kidney, spleen, and bone marrow
[19,20], potentially causing toxic effects. For example,
Cd
2+
ions (potentially generated by cadmium-based QDs)
are known to bind to sulfhydryl groups of mitochondrial
proteins and cause hepatic injury [21]. This suggests that
the GI translocation and accumulation of QDs in liver
may induce liver damage. The presence of micro- and nan-
odebris of exogenous origin was also reported in colon tis-
sues affected by cancer and Crohn's disease [22]. Thus,
there is a possible pathologic link between contact of
micro- and nanoparticles with the GI tract and the devel-
opment of colon diseases.
Though the exposure of nanomaterials through ingestion
has not appeared to be a critical problem thus far, it
requires more attention as the nanotechnology industry
grows, and more nanoscale wastes are released into the
environment. To our knowledge, there have been no stud-
ies to date of the cytotoxic effects of QDs on small intesti-
nal cells. CdSe QDs and Caco-2 cells were selected as a
model system to study the possible cytotoxic effect of
nanomaterials through accidental ingestion. Caco-2,
though a colon tumor cell line, has been widely used as an
in vitro model for studying small intestinal epithelial cell
function, because Caco-2 cells display structural and func-
tional characteristics of absorptive enterocytes. The possi-
ble toxic effects of coated and uncoated CdSe QDs on
epithelial cells lining the GI tract were investigated. Both
commercially available EviTag™ T1 490 CdSe/ZnS QDs
and in-house prepared CdSe QDs were incubated with
Caco-2 cells. The EviTag™ T1 QDs has a CdSe core and ZnS
shell, and a PEG hydrophilic coating. The in-house pre-
pared CdSe QDs were utilized both as synthesized and
after dialysis to remove free ions. As oral ingestion exposes
material to the low pH environment of the stomach, QDs
were treated with simulated gastric fluid (SGF). The effects
of QDs and SGF treated QDs on Caco-2 cell viability and
attachment to cell culture substrates were tested.
Results and discussion
Cytotoxic effect of Cd
2+
ion
As cytotoxic effects of cadmium-based QDs are often
attributed to Cd
2+
ion release, the cytotoxicity of Cd
2+
ions
to Caco-2 cells was first investigated. Cells were incubated
in Cd
2+
(2 to 200 nmol/ml) containing medium for 24
hours, and MTT and cell attachment assays were utilized
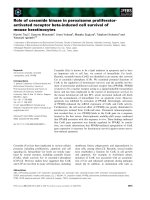
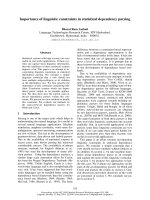
to investigate cytotoxic effects. As shown in Figure 1A, ele-
Journal of Nanobiotechnology 2008, 6:11 />Page 3 of 15
(page number not for citation purposes)
vated free Cd
2+
ion concentrations decreased the viability
of Caco-2 cells. A Cd
2+
concentration of 200 nmol/ml
resulted in a drop in the relative viability of Caco-2 to
0.62, which is significantly lower than control. The cell
attachment assay, counting attached cell nuclei utilizing
Hoechst staining, showed a similar trend. After exposure
to 200 nmol/ml Cd
2+
for 24 hr, 98% of cells were
detached from the cell culture substrate. Results indicate
that free Cd
2+
ion present in cell culture medium causes
Caco-2 cell detachment and decreases cell viability. This is
in agreement with Limaye et al., who found that Cd
2+
con-
centrations ranging from 100–400 nmol/ml lead to sig-
nificant cell death [23]. The toxic effect of Cd
2+
ion on cell
detachment is more prominent than that on cell viability.
Determination of effect of different media and acid
treatment on size and integrity of in-house synthesized
QDs
In experiments to test the cytotoxicity of CdSe QDs, the
QDs were incubated in either cell culture medium, dialy-
sis buffer, or SGF (acidic medium) prior to incubation
with cells. To assess if dialysis buffer or cell culture
medium affects QD size and integrity, UV-vis absorbance
was measured for in-house synthesized QDs after contact
with these media. One of the characteristic features of
semiconductor nanoparticles QDs is the absorption peaks
in the UV-visible range. Observation of these size-depend-
ent peaks in the absorption spectrum is a very good indi-
cator of the presence and quality of these QDs. Only a
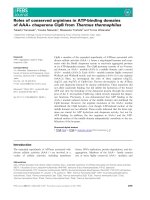
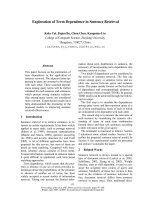
small increase in peak amplitude was observed after all
three types of in-house synthesized QDs were incubated
with cell culture medium for 24 hours (Figure 2). This
suggests that cell culture medium does not affect QD size
and integrity, and possibly stabilizes QDs. A small shift in
the absorption spectra to the blue was observed after QDs
were in contact with dialysis buffer. The blue shift indi-
cates a slight decrease in QD size. In general, both cell cul-
ture medium and dialysis buffer had little effect on QD
size.
To test whether SGF treatment damages CdSe nanoparti-
cle structure and possibly causes release of Cd
2+
ions, UV-
vis absorbance was measured for in-house synthesized
QDs before and after treatment with SGF (and subsequent
neutralization with NaHCO
3
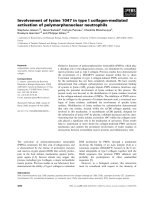
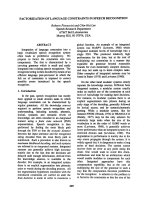
). A dramatic change in the
absorbance profiles of all three types of in-house QD solu-
tions was observed after SGF treatment. As shown in Fig-
ure 3, the absorption peak in the UV-vis spectra of CdSe
1:1 and CdSe 4:1 QDs disappeared. Peak disappearance
suggests breakdown of CdSe QDs in SGF, agglomeration
of CdSe QDs, or both. For CdSe 10:1, a small shift in the
absorption spectra to the red and peak broadening were
observed. The peak broadening suggests increase in size
distribution, likely due to breakdown and agglomeration
of QDs. The presence of the absorption peak indicates
that some of the nanoparticles were able to preserve their
QD structure, and the red shift in the peak position indi-
cates a bit of an increase in their average size [24]. It was
reported in the literature that concentrated HCl (pH = 1.5)
was able to etch and finally dissolve CdSe QDs [25]. As
Effects of Cd
2+
on (A) Caco-2 cell viability assessed with the MTT assay, and (B) Caco-2 cell attachment assessed via Hoescht cell nuclei stainingFigure 1
Effects of Cd
2+
on (A) Caco-2 cell viability assessed with the MTT assay, and (B) Caco-2 cell attachment
assessed via Hoescht cell nuclei staining. Data are expressed as the mean ± SE from three separate experiments using
cells from different cultures. Statistically significant differences in relative viability between certain Cd
2+
doses and control are
indicated by an asterisk (*) (p < 0.05).
Journal of Nanobiotechnology 2008, 6:11 />Page 4 of 15
(page number not for citation purposes)
SGF is mainly composed of HCl and its pH is about 1.5,
the changes in absorption spectra are likely due to the
breakdown of CdSe QDs.
Cytotoxic effect of EviTag™ QDs
The exposure of Caco-2 cells to concentrations of EviTag™
T1 QDs ranging from 0.84 nmol/ml to 105 nmol/ml did
not induce acute cell death as indicated by the MTT viabil-
ity assay (Figure 4A). It should be noted that prior to con-
ducting the MTT assay, medium was changed but cells
were not rinsed, so assay results are indicative of mito-
chondrial activity of firmly as well as loosely attached
cells. The number of attached live and dead cells was also
determined, however, by staining with calcein AM and
ethidium homodimer-1 (EthD-1). Cells were rinsed
extensively prior to this assay, as described in Materials
and Methods; assay results therefore indicate viability of
firmly attached cells. There was a strong correlation
between QD concentration and cell detachment (Figure
4B and Figure 5). The number of attached live cells, as
measured by fluorescent staining with calcein AM and
EthD-1, decreased with increasing concentration of QDs.
At a QD concentration of 105 nmol/ml, almost no adher-
ent cells were observed (Figure 4B, 5D). The total quantity
of attached dead cells also decreased as the concentration
of QDs increased. Cell groups treated with lower concen-
trations of QDs had a higher quantity of attached dead
cells, because the total amount of attached cells was much
higher.
UV-vis absorbance changed little after in-house prepared CdSe 1:1 (A), CdSe 4:1 (B), and CdSe 10:1 (C) QDs were exposed to either cell culture medium or dialysis bufferFigure 2
UV-vis absorbance changed little after in-house prepared CdSe 1:1 (A), CdSe 4:1 (B), and CdSe 10:1 (C) QDs
were exposed to either cell culture medium or dialysis buffer.
UV-vis absorbance changed dramatically after in-house prepared CdSe 1:1 (A), CdSe 4:1 (B), and CdSe 10:1 (C) QDs were exposed to simulated gastric fluid and NaHCO
3
neutralizationFigure 3
UV-vis absorbance changed dramatically after in-house prepared CdSe 1:1 (A), CdSe 4:1 (B), and CdSe 10:1
(C) QDs were exposed to simulated gastric fluid and NaHCO
3
neutralization.
Journal of Nanobiotechnology 2008, 6:11 />Page 5 of 15
(page number not for citation purposes)
The results suggest that the detachment of Caco-2 epithe-
lial cells from culture substrates upon incubation with
Evitag™ T1 CdSe QDs is dose dependent. While exposure
of Caco-2 cells to Evitag™ QDs caused cell detachment,
the majority of the detached cells were still alive, as indi-
cated by the MTT assay. The MTT assay measured the via-
bility of both attached and poorly attached cells, while the
cell attachment assay using Live/Dead staining, a method
involving rinsing of cell cultures, mainly measured firmly
attached cell attachment and viability. These results
emphasize the importance of consideration of the type of
assay utilized in assessing nanomaterial toxicity.
Studies have shown that QD toxicity is mainly due to Cd
2+
ions being released and influencing cells, so that the cyto-
toxicity of QDs is greatly dependent on their surface mol-
ecules [12]. The leakage of core Cd atoms is linked to the
permeability of coating materials to oxygen and protons.
Diffusion of oxygen can cause the oxidation of the CdSe
core, and enable the release of Cd
2+
ions. These released
Cd
2+
ions can bind to the sulfohydryl groups of mitochon-
dria proteins, leading to cell poisoning [21]. Protons can
lead to the detachment of coating layers from the QD sur-
face, and subsequently cause the agglomeration of QDs,
as well as the dissolution of metallic CdSe [26,27]. Due to
CdSe's semiconductive property, the exposure of CdSe
QDs to light can lead to the production of hydroxyl radi-
cals which may damage nucleic acids, enzymes, and cell
organelles, such as mitochondria [11,12,28]. The EviTag™
T1 QDs have a CdSe core, a ZnS shell, and a PEG
hydrophilic coating. It has been reported that the addition
of ZnS and PEG coating is able to prevent Cd
2+
ion release,
thus the toxic effect of CdSe QDs on the cells decreases
[11,12].
Apoptotic epithelial cells are known to detach from
growth substrates as well as neighboring cells [29]. The
detachment of Caco-2 cells from cell culture substrates is
therefore possibly due to the onset of apoptosis. Lopez et
al. reported that in the presence of serum, concentrations
of Cd
2+
lower than 10 nmol/ml did not induce necrotic
cell death but apoptotic cell death in cortical neurons
[30]. The ZnS shell and hydrophilic PEG coating on Evi-
Tag™ T1 QDs prevent bulk leakage of Cd
2+
ions from the
CdSe core into the cell culture medium. Thus, there may
not be a high enough amount of the Cd
2+
to cause acute
cell death in Caco-2 cells. However, the release of a small
amount of Cd
2+
into the cell culture medium from QDs
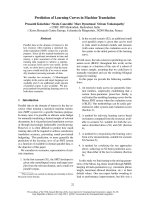
Dependence of EviTag™ T1 CdSe QD toxicity in Caco-2 cell culture on QD concentrationFigure 4
Dependence of EviTag™ T1 CdSe QD toxicity in Caco-2 cell culture on QD concentration. (A) Caco-2 viability
assessed by MTT assay. (B) Caco-2 cell attachment, including both live and dead cells as well as total attached cells, assessed by
Live/Dead fluorescent labelling. Data represent the mean ± SE of three separate experiments from cells of different cultures.
Statistically significant differences in attached live cell number between a QD dosage and all other QD doses are indicated by
an asterisk (*) (p < 0.05). Statistically significant differences in attached dead cells between a QD dosage and all other doses are
indicated by a pound symbol (#) (p < 0.05).
Journal of Nanobiotechnology 2008, 6:11 />Page 6 of 15
(page number not for citation purposes)
may be a possible cause of Caco-2 cell detachment. In
addition, some authors have suggested that a number of
cell lines were able to take up CdSe QDs [26,31]. Ryman-
Rasmussen et al. observed that PEG-carboxyl coated
CdSe/ZnS QDs localized intracellularly within 24 hours
of dosing to human epidermal keratinocytes [32]. Caco-2
cells may take up the Evitag™ QDs into the cytoplasm via
the endocytotic pathway. The ingested QDs may accumu-
late, possibly be degraded and release Cd
2+
ions, form
reactive oxygen species (ROS), or interact with intracellu-
lar components leading to cell malfunction. Previous
research has shown that CdSe/ZnS QDs were taken up by
EL-4 cells and became highly concentrated in endosomes.
It was also observed that the ingested QDs gradually lost
their fluorescence intensity, suggesting the intracellular
degradation of QDs [26]. Intracellular degradation of
QDs, creating free Cd
2+
, may cause DNA damage and lead
to cell apoptosis [33].
Cytotoxic effect of gastric fluid treated EviTag™ QDs
When QDs were treated with SGF and dosed to Caco-2
cells at concentrations of 0.84 and 4.2 nmol/ml in cell cul-
ture medium, MTT assay results suggested that the intro-
duction of acid treatment increased the QDs' cytotoxicity.
The relative viability of Caco-2 cells dropped from 90%
when incubating with 4.2 nmol/ml QDs to 53% when
incubating with the same concentration of QDs treated
with SGF (Figure 6). No cytotoxic effect was observed,
however, when cells were treated with SGF (neutralized by
NaHCO
3
and PBS) in cell culture medium at concentra-
tions encompassing the range experienced when QDs
were dosed to cells (50, 25, 12.5 and 6.25% volume of
Attached live and dead Caco-2 cells after 24 hr incubation with (A) 0.84 nmol/ml, (B) 4.2 nmol/ml, (C) 21 nmol/ml and (D) 105 nmol/ml EviTag™ T1 CdSe QDsFigure 5
Attached live and dead Caco-2 cells after 24 hr incubation with (A) 0.84 nmol/ml, (B) 4.2 nmol/ml, (C) 21
nmol/ml and (D) 105 nmol/ml EviTag™ T1 CdSe QDs. The live cells are stained with calcein AM, a green dye. The dead
cells are stained with EthD-1, a red dye. The scale bar is 500 μm.
Journal of Nanobiotechnology 2008, 6:11 />Page 7 of 15
(page number not for citation purposes)
neutralized SGF per total volume of SGF and cell culture
medium) (data not shown). This result indicates that the
addition of chemicals during the gastric fluid treatment
process did not introduce any extra toxic effects on Caco-
2 cells. These results suggest that the protective function of
the ZnS shell as well as the surface coating cannot with-
stand gastric acid. The ZnS may dissolve in HCl solution
and generate ZnCl
2
and H
2
S. Therefore, gastric acid may
destroy the ZnS shell and leave the CdSe core unprotected.
The disruption of the ZnS shell may also render the QDs
more susceptible to the environment. For example, it was
observed that the disruption of a ZnS layer enabled the
disintegration of the CdSe lattice under oxidative stress
[12,34]. ZnS is the most popular shell material used to
coat QDs.
The Evitag™ QDs also have PEG coatings with carboxyl
terminal groups. The carboxylate ion is a Lewis base; thus,
if the pH of the QD solution drops to a sufficiently low
value, the carboxylated PEG could be protonated and
detach from the surface of the QDs. The detachment of
surface coating can induce QD aggregation and possible
toxicity [12,27]. Thus, contact with stomach juice may
induce QD toxicity. Uncoated QDs or QDs with impaired
coating are prone to produce much higher amount of ROS
and induce cell death [35,36].
Cytotoxic effect of in-house synthesized QDs
To test the correlation between cell viability and synthe-
sized quantum dot dosage, three types of synthesized QDs
(CdSe 1:1, 4:1, and 10:1) were diluted to four different
concentrations (200, 100, 50, and 25 nmol/ml in cell cul-
ture medium) and incubated with Caco-2 cells for 24
hours. The MTT assay demonstrated that Caco-2 viability
decreased with increasing QD concentration (Figure 7A).
At the same concentration, toxic effects increased with
increasing ratio of Cd to Se during synthesis, from CdSe
1:1 to CdSe 4:1 and CdSe 10:1. Cadmium binds to sulfhy-
dryl groups of critical mitochondrial proteins, leading to
oxidative stress and mitochondrial disfunction [21]. The
MTT assay measures mitochondrial activity. Thus, if free
Cd
2+
is the leading cause of cytotoxicity, the MTT data
should correlate with the amount of free Cd
2+
in solution.
The results showed that the CdSe 10:1 QD preparation,
Influence of gastric acid treatment on toxicity of EviTag™ T1 CdSe QDs in Caco-2 cell cultureFigure 6
Influence of gastric acid treatment on toxicity of EviTag™ T1 CdSe QDs in Caco-2 cell culture. The cell viability
was assessed by MTT assay. Data are expressed as the mean ± SE from three separate experiments using cells of different cul-
tures. Statistically significant differences in Caco-2 cell relative viability between a QD dose and the control are indicated by an
asterisk (*) (p < 0.05).
Journal of Nanobiotechnology 2008, 6:11 />Page 8 of 15
(page number not for citation purposes)
which has the highest residual Cd
2+
ion among the three
types of in-house synthesized QDs, was most toxic to
Caco-2 cells. The result suggests that free Cd
2+
existing in
in-house synthesized QDs is the main cause of Caco-2
cytotoxicity.
As described above, the cell attachment (Live/Dead assay)
and MTT assay results showed that when the Evitag™ T1
QD concentration was sufficiently high, cells started to
detach from the cell culture substrate while most of
detached cells were still alive (Figure 4B, 5), suggesting the
onset of cell apoptosis. When Caco-2 cells were incubated
with in-house synthesized CdSe QDs, however, a large
quantity of attached dead cells was observed. This phe-
nomenon could be related to a sufficiently high amount
of free Cd
2+
present in the medium immediately poison-
ing the cells before they were able to detach. This phe-
nomenon was also observed by Lopez et al. and Kirchner
et al. [11,30]. They reported that apoptosis and necrosis
are the pathways for cell death at low and high cadmium
concentrations, respectively. However, when the free Cd
2+
concentration was increased to a high enough level, mas-
sive cell death as well as detachment were observed.
Cytotoxic effect of gastric fluid treated in-house
synthesized QDs
To test the effect of gastric fluid treatment on in-house
synthesized QDs, the three types of synthesized QDs were
treated with SGF and then diluted to three concentrations
(50, 25, and 12.5 nmol/ml in cell culture medium) and
incubated with Caco-2 cells for 24 hours. Treatment with
SGF did not result in enhancement of in-house synthe-
sized QD cytotoxicity as it had with commercially pur-
chased EviTag™ T1 QDs, but rather appeared to decrease
the QD cytotoxity (Figure 7B). When Caco-2 cells were
incubated with 50 nmol/ml of CdSe 4:1 QDs, the relative
viability was 32.2% prior to SGF treatment compared to
78.7% post treatment. For CdSe 10:1 QDs, treatment with
SGF increased the resulting viability from 4.81% to
63.3%. This result may be due to the fact that at the last
step of SGF treatment, hydrogen carbonate was added,
which can react with Cd
2+
and form insoluble cadmium
carbonate (CdCO
3
). The formation of cadmium carbon-
ate could precipitate excessive Cd
2+
ions present in the
solution of synthesized QDs, and consequently increase
cell viability [37]. Though acid treatment may also cause
the dissolution of CdSe cores and the release of Cd
2+
, the
amount of Cd
2+
ion released by SGF treatment is likely
Comparison of cytotoxicity of synthesized CdSe QDs before and after SGF treatment utilizing MTT assayFigure 7
Comparison of cytotoxicity of synthesized CdSe QDs before and after SGF treatment utilizing MTT assay. (A)
The Caco-2 cells were dosed with untreated synthesized CdSe QDs. (B) The Caco-2 cells were dosed with SGF-treated QDs.
Data are expressed as the mean ± SE from three separate experiments using cells of different cultures. Statistically significant
differences in relative viability between certain QD doses and all other doses of the same type of QDs are indicated by an
asterisk (*) (p < 0.05). Statistically significant difference in cell relative viability between certain types of QDs and all other types
of QDs within the same dose are indicated by a pound symbol (#) (p < 0.05).
Journal of Nanobiotechnology 2008, 6:11 />Page 9 of 15
(page number not for citation purposes)
negligible relative to the large quantity of Cd
2+
ions pre-
existing in the synthesized QD solution.
An alternate cause for the decrease in cytotoxicity of in
house synthesized QDs after SGF treatment could be
aggregation. It has been shown that the optical properties
of CdSe QDs are sensitive to pH. Gao et. al reported that
the addition of HCl (pH = 2–4) decreased the fluores-
cence intensity of ZnS-capped CdSe QDs to ~20% of its
original value [38]. Quantum dots' optical properties
depend on particle size, and thus the aggregation or deg-
radation of CdSe nanoparticles could be responsible for
impairing their fluorescence intensity. If SGF treatment
causes the aggregation of CdSe nanoparticles, the aggrega-
tion may decrease the release of Cd
2+
by creating larger
particles with fairly low surface to volume ratio.
Comparing the effects of in-house QDs and SGF treated
in-house QDs on Caco-2 adhesion properties, it was
found that SGF treatment slightly increased the total
Caco-2 attachment on the cell culture substrates. How-
ever, the amount of attached dead cells increased after
SGF treatment (Figure 8).
Cytotoxic effect of dialyzed in-house synthesized QDs
before and after treatment with gastric fluid
The synthesized QDs were toxic to cells presumably
because of pre-existing free Cd
2+
in the QD solution. This
problem was overcome by dialyzing the QD solutions
with Cd
2+
-free sodium citrate solution. When QD solu-
tion and Cd
2+
-free sodium citrate solution are separated
by a dialysis membrane, the Cd
2+
will be transported from
the QDs solution down the concentration gradient into
the sodium citrate solution. The removal of the free Cd
2+
ions dramatically decreased the toxic effect of synthesized
QDs (Figure 9A, B). The MTT assay indicated no influence
of the QD doses tested on viability after dialysis (data not
shown). The results suggest that free Cd
2+
is the leading
cause of Caco-2 cell detachment and death. No obvious
toxic effects were observed when Caco-2 cells were incu-
bated with dialyzed QDs, even for the most toxic CdSe
10:1 QDs at the concentration of 200 nmol/ml. However,
in the case of CdSe 4:1 QDs, the amount of dead cells was
greater in the high QD dosage groups (i.e. 100 and 200
nmol/ml).
The in-house synthesized CdSe QDs are 2.5, 1.5, and 1.4
nm in diameter for CdSe 1:1, CdSe 4:1, and CdSe 10:1,
respectively. For smaller particles, the surface-to-volume
ratio is higher, and the chance of Cd
2+
release from parti-
cle surfaces is higher. Thus, the number of adherent live
cells after incubation with QDs should be the lowest in
the case of CdSe 10:1 QDs, which has the smallest particle
size. However, as seen in Figure 9A, for low QDs concen-
tration, the amount of adherent live cells is significantly
lower for Caco-2 dosed with CdSe 1:1 than those dosed
with CdSe 4:1 and CdSe 10:1 QDs. This result suggests
that the leakage of Cd
2+
may not be the only or main route
causing the toxic effect in this case. The particle size may
also contribute to the cytotoxic reaction in Caco-2 cells,
with larger size nanoparticles being more toxic to Caco-2
cells.
To investigate the effect of SGF treatment on the cytotox-
icity of dialyzed QDs, the dialyzed QDs were treated with
SGF and then dosed to Caco-2 cells. The MTT assay indi-
cated no influence of the QD doses tested on viability
after dialysis (data not shown). However, fluorescent
staining with calcein AM and EthD-1 indicated a signifi-
cant decrease in cell attachment and viability after treat-
ment, especially for the CdSe 4:1 and CdSe 10:1 QDs
(Figure 9C, 9D). The amount of attached live cells signifi-
cantly decreased upon incubation with 100 nmol/ml SGF
treated QDs for all three types of QDs, especially for the
CdSe 10:1 QDs. The attached dead cell data also suggest
the increase of cytotoxicity of QDs after they were treated
with SGF. Thus, in the case of dialyzed QDs, the SGF treat-
ment increases QDs toxicity, while it appears to decrease
the toxic effect of non-dialyzed QDs. This may be due to
the fact that after removing the excess amount of free Cd
2+
ions, the effect of SGF solubilizing Cd atoms from QDs is
more evident.
Conclusion
The dependence of CdSe QD toxicity on surface coating
was clearly demonstrated by the influence of in-house
synthesized QDs on cell viability in comparison to com-
mercially available coated QDs. Sensitivity to gastric fluid
treatment suggests that toxicity of CdSe QDs can depend
on the route of exposure. Specifically, the acidic gastric
fluid may damage QDs' protective coating and lead to
direct contact of the CdSe core with cells, resulting in cell
death. On the other hand, an increase in cell attachment
and viability was observed after treatment of QDs with
simulated gastric fluid in the case of in-house synthesized
CdSe QD preparations containing free Cd
2+
, possibly due
to the formation of a cadmium carbonate precipitate
removing free Cd
2+
from the QD preparation. This sug-
gests that the secretion of sodium carbonate to neutralize
gastric acid during the digestion process in the human GI
tract may help to reduce free Cd
2+
released by CdSe QDs
through formation of a cadmium carbonate precipitate.
The removal of the free Cd
2+
ion through dialysis greatly
decreased the toxic effect of in-house synthesized QDs,
indicating that the release of Cd
2+
is one of the main
mechanisms of CdSe QD cytotoxicity. In general, the
results have shown that CdSe-core QD toxicity can vary
depending on coating and treatment with acid, highlight-
ing the importance of considering exposure route in eval-
uating nanomaterial toxicity.
Journal of Nanobiotechnology 2008, 6:11 />Page 10 of 15
(page number not for citation purposes)
Toxicity effects of synthesized CdSe QDs before and after SGF treatment utilizing Live/Dead assayFigure 8
Toxicity effects of synthesized CdSe QDs before and after SGF treatment utilizing Live/Dead assay. Attached
live (A) and dead (B) Caco-2 cells after dosing with in-house synthesized CdSe QDs. Attached live (C) and dead (D) Caco-2
cells after dosing with SGF-treated in-house synthesized CdSe QDs (concentrations were influenced by dilution during SGF
treatment). Data are expressed as the mean ± SE from three separate experiments using cells of different cultures. Statistically
significant difference in attached cell number (either attached live cells or attached dead cells) between a certain QD dose and
all other doses within the same type of QD are indicated by an asterisk (*) (p < 0.05), Statistically significant differences in
attached cell number (either attached live cells or attached dead cells) between a certain type of QD and all other types of QD
within the same dose are indicated by a pound symbol (#) (p < 0.05). The over bar indicates there is no statistically significant
difference between connected groups.
Journal of Nanobiotechnology 2008, 6:11 />Page 11 of 15
(page number not for citation purposes)
Effects of synthesized CdSe QDs after removal of free Cd
2+
on Caco-2 attachment and viabilityFigure 9
Effects of synthesized CdSe QDs after removal of free Cd
2+
on Caco-2 attachment and viability. The cell attach-
ment and viabilities were analyzed by Live/Dead fluorescent labeling. Attached live (A) and dead (B) Caco-2 cells after dosing
with synthesized CdSe QDs. Attached live (C) and dead (D) Caco-2 cells after dosing with SGF-treated synthesized CdSe QDs
(concentrations were influenced by dilution during SGF treatment). Data are expressed as the mean ± SE from three separate
experiments using cells of different cultures. Statistically significant differences in attached cell number (either attached live cells
or attached dead cells) between a certain QD dose and other doses within the same type of QD are indicated by an asterisk
(*) (p < 0.05). Statistically significant differences in attached cell number (either attached live cells or attached dead cells)
between a certain type of QD and all other types of QD within the same dose are indicated by a pound symbol (#) (p < 0.05).
Journal of Nanobiotechnology 2008, 6:11 />Page 12 of 15
(page number not for citation purposes)
Methods
Cell Culture
A human colon carcinoma cell line, Caco-2, was obtained
from the American Type Culture Collection (ATCC, Man-
assas, VA) and cultivated in Eagle's minimum essential
medium (ATCC) supplemented with 20% fetal bovine
serum (FBS, ATCC) and 1% antibiotic antimycotic solu-
tion (containing 10,000 units/ml penicillin G, 10 mg/ml
streptomycin sulfate and 25 μg/ml amphotericin B,
Sigma-Aldrich, St. Louis, MO). Confluent monolayers
were subcultured by incubating with 0.05% trypsin and
0.2% EDTA in Ca
2+
- and Mg
2+
-free phosphate buffered
saline (PBS, Sigma-Aldrich). Cultures were incubated at
37°C in a humidified atmosphere of 95% air, 5% CO
2
.
For all experiments, cells were seeded at high density
(10
6
cells/ml, 0.2 ml/well) onto test surfaces contained
within 96-well plates and cultured for 5 days. Medium
was aspired and replaced after 2 days of seeding and every
2 days in culture. Nanomaterials of different composi-
tions and coatings suspended in cell culture medium were
added at different concentrations to cells as described
below and incubated for 24 hr. The cytotoxic effects of the
nanomaterials on Caco-2 cells were then measured by
MTT and Live/Dead assay.
Exposure of cells to Cd
2+
ions
0.01 M cadmium perchlorate (CdCl
2
O
8
) was diluted to
working concentrations (ranging from 2 to 200 nmol/ml)
in cell culture medium (Eagle's minimum essential
medium supplemented with 20% FBS and 1% antibiotic
antimycotic solution, pH 7.4). Medium was removed
from Caco-2 cells cultured in 96 well plates, and cells were
incubated with 150 μl/well of the Cd
2+
preparations for 24
hours.
Preparation of quantum dots
Two types of CdSe QDs were used. The first type was Evi-
Tag™ T1 490 nm Lake Placid Blue CdSe/ZnS QDs (the
concentration of CdSe core particles is 15 nmol particles/
ml and the molecular weight of CdSe core particle is 2.7
kD) suspended in DI water, which was purchased from
Evident Technologies, Troy, New York. EviTag™ T1 QDs
consist of a CdSe metalloid core and a ZnS shell. In addi-
tion, a layer of polyethylene glycol (PEG) with carboxyl
terminal groups renders the QD biocompatible and water
soluble.
The second type of CdSe QDs was synthesized by micro-
wave heating of an aqueous solution of 0.01 M cadmium
perchlorate (CdCl
2
O
8
, Sigma-Aldrich) as a source of cad-
mium ions with 0.01 M N, N-dimethyl selenourea
(C
3
H
8
N
2
Se, Sigma-Aldrich) as a source of selenium ions,
in the presence of 0.1% (w/v) sodium citrate
(Na
3
C
6
H
5
O
7
, Sigma-Aldrich) as stabilizer [39,40]. First,
0.025 g of sodium citrate was dissolved in 45 mL of deion-
ized water. After the pH was adjusted to 9.2, 2 mL of cad-
mium perchlorate and 2 mL N, N-dimethyl selenourea
were added, and the pH was readjusted to 9.2. The mix-
ture of precursors was heated in a conventional micro-
wave oven at 1000 W continuously for 60 s and then
stored in the dark at room temperature for 2–3 days.
Smaller sizes of CdSe QDs were obtained by increasing
the ratio of cadium to selenium ions. Addition of 2 ml
0.01, 0.04 or 0.1 M cadmium perchlorate resulted in aver-
age particle sizes of 2.5 (CdSe 1:1), 1.5 (CdSe 4:1), and 1.4
nm (CdSe 10:1), respectively. The diameters of the parti-
cles were evaluated on the basis of the UV-vis spectra by
using the correlation between absorption onset and parti-
cle diameter, and by transmission electron microscopy
(TEM) imaging [41]. The in-house synthesized CdSe QDs
only consisted of a CdSe metalloid core and were stabi-
lized in water by a layer of surrounding sodium citrate
molecules. The total concentration of CdSe pairs in each
preparation (400 nmol/ml) was determined based on the
assumption that all of the Se
2-
in the C
3
H
8
N
2
Se reacted to
form CdSe pairs. The relationship between the size and
the number of CdSe pairs in an individual CdSe nanopar-
ticle was calculated based on the assumption that a CdSe
QD 2 nm in diameter consists of approximately 75 CdSe
pairs, and the number of CdSe pairs is proportional to
particle volume (assumed spherical) [24,42,43]. Thus, the
concentration of in-house synthesized CdSe core QDs was
estimated. CdSe 1:1 QDs have 146 CdSe pairs per particle,
and the initial concentration of CdSe core particles is cal-
culated to be 2.74 nmol particles/ml, since there are a
total of 400 nmol CdSe pairs/ml. CdSe 4:1 QDs have 32
CdSe pairs per particle, and the initial concentration of
CdSe core particles was 12 nmol particles/ml. CdSe 10:1
QDs have 26 CdSe pairs per particle, and the initial con-
centration of CdSe core particles was 15.38 nmol parti-
cles/ml. For the Evitag™ T1 QDs, the molecular weight of
the cores (supplied by the manufacturer) and the molecu-
lar weight of CdSe can be used to determine that these
QDs have 14 CdSe pairs per particle. Therefore, as the ini-
tial concentration of CdSe core particles was 15 nmol par-
ticles/ml, the total concentration of CdSe pairs was
estimated to be 210 nmol/ml. The dose concentrations of
Evitag™ T1 QDs as well as in-house synthesized CdSe QDs
are expressed as mole concentration of total CdSe pairs in
this paper. Thus, for all of the in-house synthesized QDs,
the initial CdSe pair concentration is 400 nmol/ml, and
for the Evitag™ T1 QDs, the initial CdSe pair concentra-
tion is 210 nmol/ml.
Dialysis of CdSe quantum dots
The synthesized CdSe QDs contained unreacted Cd
2+
, sta-
bilizers, and possibly Se
2-
. To remove excess amount of
Cd
2+
and Se
2-
ions, the QD solutions were placed in cellu-
lose dialysis tubes (Spectrum Laboratories, Rancho
Dominguez, CA). The molecular weight cut-off for the
Journal of Nanobiotechnology 2008, 6:11 />Page 13 of 15
(page number not for citation purposes)
dialysis membrane with pore size less than 1 nm was 1
kDa, which allowed Cd
2+
or Se
2-
to pass through while
retaining the CdSe QDs inside. The tubes were suspended
in 1 L of 0.1% (w/v) sodium citrate solution, pH 9.4, and
the solution was constantly stirred to maintain well-
mixed conditions and facilitate mass transfer through the
membrane. The sodium citrate solution was exchanged
every 6 hours, and after dialysis for 18 hours, the dialyzed
CdSe QD solutions were collected and diluted to dose
concentrations in cell culture medium.
Preparation of simulated gastric fluid (SGF)
The simulated gastric fluid was prepared by dissolving 2.0
g of sodium chloride (NaCl, Sigma-Aldrich) in 7.0 mL
hydrochloric acid (HCl, Sigma-Aldrich) and sufficient
water to make 1 L. The final pH of simulated gastric fluid
is about 1.2 [44].
Treatment of quantum dots with gastric pH
In the human body, ingested food is transported through
the esophagus into the stomach, where partially digested
food triggers the release of HCl. After exposure to low pH
for about 0.5 to 4 hours in the stomach, food is passed to
the duodenum and gastric acid becomes neutralized by
sodium bicarbonate secreted by the pancreas [6,45]. To
mimic the pH changes that occur during the digestion
process, Evitag™ or in-house synthesized QDs with their
original concentrations (210 or 400 nmol CdSe pair/ml)
were mixed with SGF at a 1 to 0.5 volume ratio of QD
solution to SGF. The addition of SGF brought the pH to
around 1.5 in the QD preparations. The solutions were
then incubated at 37°C for 3 hours and neutralized by
adding 5% (wt%) sodium hydrogen carbonate (NaHCO
3
,
Sigma-Aldrich) and phosphate buffered saline (PBS, pH
7.4, Sigma-Aldrich), which brought the solution pH to
around 7.5. Neutralized QD solutions were adjusted to
experimental concentrations by adding various amounts
of cell culture medium, and were immediately dosed to
cells.
Optical characterization of quantum dots
UV-vis absorption spectra were acquired on a BIO-TEK
®
PowerWave™ universal microplate spectrophotometer.
QD solutions were placed in 1 cm quartz cuvettes, and
their absorption was measured.
Exposure of cells to quantum dots
Commercially available Evitag™ T1 QDs were diluted to
working concentrations (ranging from 105 to 0.84 nmol
CdSe pair/ml) of QDs in cell culture medium (Eagle's
minimum essential medium supplemented with 20% FBS
and 1% antibiotic antimycotic solution, pH 7.4). In-
house synthesized QDs were diluted to working concen-
trations ranging from 200 nmol CdSe pair/ml to 25 nmol
CdSe pair/ml in cell culture medium (pH 7.4). Medium
was removed from Caco-2 cells cultured in 96 well plates,
and cells were incubated with 150 μl/well of the QD prep-
arations for 24 hours. QD-free cell culture medium was
used as a control. Cell viability and attachment were
assessed as described below.
To test the effect of dialysis of the QDs, in-house synthe-
sized QDs dialyzed as described above were diluted to the
same working concentrations as the untreated QDs (pH
7.4). Cells in culture were exposed to the dialyzed QDs for
24 hours in a similar fashion to those treated with undia-
lyzed QDs. Cell viability and attachment were assessed as
described below, and cell culture medium was used as a
control.
To test the effect of acid treatment on toxicity of QDs in
Caco-2 cell cultures, treated QDs were diluted to working
concentrations in cell culture medium (pH 7.4) and incu-
bated with Caco-2 cells cultured in a 96-well plate for 24
hours in a similar manner to that used to test untreated
QDs. Cell culture medium was again used as a control. To
be sure that any effect of gastric pH treatment on cytotox-
icity of EviTag™ T1 QDs was related to changes in the QDs
rather than the change in chemical composition of the
fluid exposed to cells, the toxic effects of SGF and
NaHCO
3
alone were analyzed. Solutions of SGF (neutral-
ized by NaHCO
3
and PBS) in cell culture medium at con-
centrations of SGF encompassing the range of
concentrations experienced when QDs were dosed were
incubated with Caco-2 cells for 24 hr. Cell viability and
attachment were assessed as described below with cell cul-
ture medium as a control.
Cell viability (MTT assay)
The MTT assay is used to measure mitochondrial activity,
which is directly correlated to cell viability, for both
attached and poorly attached cells. Metabolically active
cells are able to reduce the MTT tetrazolium salt to colored
formazan crystals, while dead cells do not. For each well
of a 96-well plate, after the cells were incubated with QD-
containing cell culture medium for 24 hr, the medium
was gently removed and replaced with 0.09 ml of phenol
red-free Eagle's minimum essential medium. Cells were
purposefully not rinsed to enable testing of viability of
loosely bound as well as firmly attached cells. 0.01 ml of
5 mg/ml MTT (3-[4,5-dimethylthiazol-2-yl]-2,5-diphenyl
tetrazolium bromide) solution (Sigma-Aldrich) was then
added to each well. The cell cultures were incubated at
37°C for 3 hours. The formazan crystals generated during
the incubation period were dissolved by adding 0.1 ml of
MTT solubilization solution (10% Triton X-100 plus 0.1
N HCl in anhydrous isopropanol, Sigma-Aldrich) and
gently mixing the solution by trituration. After the crystals
were fully dissolved, the absorbances of the solutions at
570 nm (OD
570
) were measured using a spectrophotome-
Journal of Nanobiotechnology 2008, 6:11 />Page 14 of 15
(page number not for citation purposes)
ter. Cell culture medium was again used as a control. The
MTT results are presented below as values relative to con-
trol values, expressed as percentages.
Cell attachment (Live/Dead assay)
The numbers of attached live, dead and total Caco-2 cells
were quantified by using calcein AM and ethidium
homodimer-1 (EthD-1) to stain the cells. Calcein AM is
able to penetrate viable cell membranes, producing an
intense uniform green fluorescence in viable cells. EthD-1
is only capable of entering damaged membranes and
undergoes 40-fold enhancement of fluorescence upon
binding to nucleic acids, thereby producing a bright red
fluorescence in dead cells [46]. Cell culture plates were
filled with Dulbecco's phosphate buffered saline (D-PBS)
and then inverted for 10 minutes, enabling unattached
cells to be removed by precipitation. Cell layers were then
washed gently with D-PBS five times at room temperature.
During the precipitation and wash steps, poorly attached
and detached Caco-2 cells were removed. To perform the
assay, 100 μL of combined Live/Dead assay reagents (con-
taining approximately 1 μM calcein AM and 2 μM EthD-
1, Invitrogen, Carlsbad, CA) were added to each well of
the 96-well plate. The cells were incubated at room tem-
perature for 30 minutes and observed under a fluores-
cence microscope (Olympus IX51). Images of
fluorescently stained Caco-2 cells were acquired using an
Olympus digital camera (DP70). For each well, 5 fluores-
cent images of live cells and 5 fluorescent images of dead
cells were taken. Cells were counted on each image using
ImageJ software />. The data rep-
resents the average number of live or dead cells over at
least 15 images for each treatment. Cells incubated in cul-
ture medium were again used as a control. The total
attached cells were determined by adding up the number
of live and dead cells for each image and calculating total
cells per well.
Statistical analysis
A two-sample t-test assuming unequal variance was used
as a statistical test. Results are expressed as means ± stand-
ard error (SE) of three separate experiments using cells
from different cultures, and were considered significant at
p < 0.05.
Abbreviations
QD: Quantum dot; PEG: Polyethylene glycol; GI tract:
Gastrointestinal tract; ROS: Reactive oxygen species; SGF:
Simulated gastric fluid.
Competing interests
The authors declare that they have no competing interests.
Authors' contributions
LW performed the majority of the experiments and wrote
the manuscript with RLC. DKN synthesized the in-house
CdSe quantum dots and contributed to the design of the
experiments. RLC and MRD designed the overall project
and helped with interpretation of data. SS contributed to
the interpretation of data and drafting of the manuscript.
Acknowledgements
This work was supported under the Nanoscale Science and Engineering
Centers Program of the National Science Foundation (Award # NSF-
0425826).
References
1. Colvin VL: Sustainability for nanotechnology: making smaller
safer and changing the way industry thinks in the process. Sci-
entist 2004, 18:26-27.
2. Hardman R: A toxicologic review of quantum dots: toxicity
depends on physicochemical and environmental factors.
Environ Health Perspect 2006, 114:165-172.
3. Borm PJ, Kreyling W: Toxicological hazards of inhaled nanopar-
ticles – potential implications for drug delivery. J Nanosci Nan-
otechnol 2004, 4:521-531.
4. Whitesides GM: Nanoscience, nanotechnology, and chemistry.
Small 2005, 1:172-179.
5. Kreyling W, Semmler-Behnke M, Möller W: Health implications of
nanoparticles. J Nanopart Res 2006, 8:543-562.
6. Martini F: Fundamentals of anatomy & physiology 6th edition. San Fran-
cisco: Benjamin Cummings; 2004.
7. Gibson PR, Anderson RP, Mariadason JM, Wilson AJ: Protective
role of the epithelium of the small intestine and colon.
Inflamm Bowel Dis 1996, 2:279-302.
8. Fleckenstein JM, Kopecko DJ: Breaching the mucosal barrier by
stealth: an emerging pathogenic mechanism for enteroad-
herent bacterial pathogens. J Clin Invest 2001, 107:27-30.
9. Sansonetti PJ, Tran Van Nhieu G, Egile C: Rupture of the intestinal
epithelial barrier and mucosal invasion by Shigella flexneri.
Clin Infect Dis 1999, 28:466-475.
10. Cho SJ, Maysinger D, Jain M, Roder B, Hackbarth S, Winnik FM:
Long-term exposure to CdTe quantum dots causes func-
tional impairments in live cells. Langmuir 2007, 23:1974-1980.
11. Kirchner C, Liedl T, Kudera S, Pellegrino T, Munoz Javier A, Gaub HE,
Stolzle S, Fertig N, Parak WJ: Cytotoxicity of colloidal CdSe and
CdSe/ZnS nanoparticles. Nano Lett 2005, 5:331-338.
12. Derfus AM, Chan WCW, Bhatia SN: Probing the cytotoxicity of
semiconductor quantum dots. Nano Lett 2004, 4:11-18.
13. Kirchner C, Javier AM, Susha AS, Rogach AL, Kreft O, Sukhorukov
GB, Parak WJ: Cytotoxicity of nanoparticle-loaded polymer
capsules. Talanta 2005,
67(3):486-491.
14. Jani P, Halbert GW, Langridge J, Florence AT: Nanoparticle uptake
by the rat gastrointestinal mucosa: quantitation and particle
size dependency. J Pharm Pharmacol 1990, 42:821-826.
15. Florence AT, Hillery AM, Hussain N, Jani PU: Factors affecting the
oral uptake and translocation of polystyrene nanoparticles:
histological and analytical evidence. J Drug Target 1995, 3:65-70.
16. Gelperina S, Kisich K, Iseman MD, Heifets L: The potential advan-
tages of nanoparticle drug delivery systems in chemotherapy
of tuberculosis. Am J Respir Crit Care Med 2005, 172:1487-1490.
17. Parak WJ, Boudreau R, Le Gros M, Gerion D, Zanchet D, Micheel
CM, Williams SC, Alivisatos AP, Larabell C: Cell motility and met-
astatic potential studies based on quantum dot imaging of
phagokinetic tracks. Adv Mater 2002, 14:882-885.
18. Hanaki K-i, Momo A, Oku T, Komoto A, Maenosono S, Yamaguchi Y,
Yamamoto K: Semiconductor quantum dot/albumin complex
is a long-life and highly photostable endosome marker. Bio-
chem Biophys Res Commun 2003, 302:496-501.
19. Gopee NV, Roberts DW, Webb P, Cozart CR, Siitonen PH, Warbrit-
ton AR, Yu WW, Colvin VL, Walker NJ, Howard PC: Migration of
intradermally injected quantum dots to sentinel organs in
mice. Toxicol Sci 2007, 98:249-257.
20. Hainfeld JF, Slatkin DN, Focella TM, Smilowitz HM: Gold nanopar-
ticles: a new X-ray contrast agent. Brit J Radiol 2006, 79:248-253.
Publish with BioMed Central and every
scientist can read your work free of charge
"BioMed Central will be the most significant development for
disseminating the results of biomedical research in our lifetime."
Sir Paul Nurse, Cancer Research UK
Your research papers will be:
available free of charge to the entire biomedical community
peer reviewed and published immediately upon acceptance
cited in PubMed and archived on PubMed Central
yours — you keep the copyright
Submit your manuscript here:
/>BioMedcentral
Journal of Nanobiotechnology 2008, 6:11 />Page 15 of 15
(page number not for citation purposes)
21. Rikans LE, Yamano T: Mechanisms of cadmium-mediated acute
hepatotoxicity. J Biochem Mol Toxicol 2000, 14(2):110-117.
22. Gatti AM: Biocompatibility of micro- and nano-particles in the
colon. Part II. Biomaterials 2004, 25:385-392.
23. Limaye DA, Shaikh ZA: Cytotoxicity of cadmium and character-
istics of its transport in cardiomyocytes. Toxicol Appl Pharmacol
1999, 154:59-66.
24. Yu M, Fernando G, Li R, Papadimitrakopoulos F, Shi N, Ramprasad R:
Discrete size series of CdSe quantum dots: a combined com-
putational and experimental investigation. J Comput Aid Mater
Des 2007, 14:167-174.
25. Guo W, Li JJ, Wang YA, Peng X: Luminescent CdSe/CdS core/
shell nanocrystals in dendron boxes: superior chemical, pho-
tochemical and thermal Stability. J Am Chem Soc 2003,
125:3901-3909.
26. Hoshino A, Hanaki K, Suzuki K, Yamamoto K: Applications of T-
lymphoma labeled with fluorescent quantum dots to cell
tracing markers in mouse body. Biochem Biophys Res Commun
2004, 314:46-53.
27. Aldana J, Lavelle N, Wang Y, Peng X: Size-dependent dissociation
pH of thiolate ligands from cadmium chalcogenide nanocrys-
tals. J Am Chem Soc 2005, 127:2496-2504.
28. Tsay JM, Michalet X: New light on quantum dot cytotoxicity.
Chem Biol 2005, 12:1159-1161.
29. Wyllie AH, Kerr JF, Currie AR: Cell death: the significance of
apoptosis. Int Rev Cytol 1980, 68:251-306.
30. Lopez E, Figueroa S, Oset-Gasque MJ, Gonzalez MP: Apoptosis and
necrosis: two distinct events induced by cadmium in cortical
neurons in culture. Br J Pharmacol 2003, 138:901-911.
31. Wolfgang P, Rosanne B: Cell motility and metastatiy potential
studies based on quantum dot imaging of phagokinetic
tracks. Adv Mater 2002, 14:882-885.
32. Ryman-Rasmussen JP, Riviere JE, Monteiro-Riviere NA:
Surface
coatings determine cytotoxicity and irritation potential of
quantum dot nanoparticles in epidermal keratinocytes. J
Invest Dermatol 2007, 127:143-153.
33. Rosen K, Shi W, Calabretta B, Filmus J: Cell detachment triggers
p38 mitogen-activated protein kinase-dependent overex-
pression of Fas ligand. A novel mechanism of Anoikis of
intestinal epithelial cells. J Biol Chem 2002, 277:46123-46130.
34. Dabbousi BO, Rodriguez-Viejo J, Mikulec FV, Heine JR, Mattoussi H,
Ober R, Jensen KF, Bawendi MG: (CdSe)ZnS core-shell quantum
dots: synthesis and characterization of a size series of highly
luminescent nanocrystallites. J Phys Chem B 1997,
101:9463-9475.
35. Lovric J, Cho SJ, Winnik FM, Maysinger D: Unmodified cadmium
telluride quantum dots induce reactive oxygen species for-
mation leading to multiple organelle damage and cell death.
Chem Biol 2005, 12:1227-1234.
36. Choi AO, Cho SJ, Desbarats J, Lovric J, Maysinger D: Quantum dot-
induced cell death involves Fas upregulation and lipid perox-
idation in human neuroblastoma cells. J Nanobiotechnology
2007, 5:1-13.
37. National Research Council: Toxicologic assessment of the army's zinc
cadmium sulfide dispersion tests Washington, DC: National Academies
Press; 1997.
38. Gao X, Chan WC, Nie S: Quantum-dot nanocrystals for ultra-
sensitive biological labeling and multicolor optical encoding.
J Biomed Opt 2002, 7:532-537.
39. Ni T, Nagesha DK, Robles J, Materer NF, Mussig S, Kotov NA: CdS
nanoparticles modified to chalcogen sites: new supramo-
lecular complexes, butterfly bridging, and related optical
effects. J Am Chem Soc 2002, 124:3980-3992.
40. Nagesha DK: Synthesis and characterization of CdSe and In
2
S
3
nanoparticles and their surface modification using
Ru(bipy)
2
Cl
2
complex. Oklahoma State University, Department of
Physics; 2002.
41. Vossmeyer T, Katsikas L, Giersig M, Popovic IG, Diesner K,
Chemseddine A, Eychmueller A, Weller H: CdS nanoclusters –
Synthesis, characterization, size-dependent scillator
strength, temperature shift of the excitonic-transition
energy, and reversible absorbency shift. J Phys Chem 1994,
98:7665-7673.
42. Rabani E: Structure and electrostatic properties of passivated
CdSe nanocrystals. J Chem Phys 2001, 115:1493-1497.
43. Islam MA, Xia Y, Steigerwald ML, Yin M, Liu Z, O'Brien S, Levicky R,
Herman IP: Addition, suppression, and inhibition in the elec-
trophoretic deposition of nanocrystal mixture films for CdSe
nanocrystals with Fe
2
O
3
and Au nanocrystals. Nano Lett 2003,
3:1603-1606.
44. United States Pharmacopeial Convention: The United States
pharmacopeia. Rockville, Md.: United States Pharmacopeial Con-
vention, Inc; 1979.
45. Seidler U, Rossmann H, Jacob P, Bachmann O, Christiani S, Lamprecht
G, Gregor M: Expression and function of Na
+
HCO
3
-
cotrans-
porters in the gastrointestinal tract. Ann N Y Acad Sci 2000,
915:1-14.
46. Poole CA, Brookes NH, Clover GM: Keratocyte networks visual-
ised in the living cornea using vital dyes. J Cell Sci 1993,
106:685-691.