báo cáo khoa học: "Backstep scanning ion conductance microscopy as a tool for long term investigation of single living cells" pptx
Bạn đang xem bản rút gọn của tài liệu. Xem và tải ngay bản đầy đủ của tài liệu tại đây (2.78 MB, 9 trang )
BioMed Central
Page 1 of 9
(page number not for citation purposes)
Journal of Nanobiotechnology
Open Access
Short Communication
Backstep scanning ion conductance microscopy as a tool for long
term investigation of single living cells
Patrick Happel*
1,2
and Irmgard D Dietzel
1
Address:
1
Department of Molecular Neurobiochemistry, Ruhr-University Bochum, D-44870 Bochum, Germany and
2
Central Unit for Ion Beams
and Radionuclides (RUBION), Ruhr-University Bochum, D-44870 Bochum, Germany
Email: Patrick Happel* - ; Irmgard D Dietzel -
* Corresponding author
Abstract
Scanning ion conductance microscopy (SICM) is a suitable tool for imaging surfaces of living cells in
a contact-free manner. We have shown previously that SICM in backstep mode allows one to trace
the outlines of entire cell somata and to detect changes in cellular shape and volume. Here we
report that SICM can be employed to quantitatively observe cellular structures such as cell
processes of living cells as well as cell somata of motile cells in the range of hours.
Findings
In order to obtain quantitative information about the
dynamics of topographic changes as occur during cell
migration, long term recordings of living cells are
required. While the trajectories of cells can be followed
with light microscopy, more complex topographic details
of changes in shape can be obtained using scanning probe
techniques. For example, atomic force microscopy (AFM)
[1] has succesfully been used to observe patches of the cell
membrane of living monkey kidney cells for hours as well
as to reveal changes and detailed information about the
structure of the growth cone of living hippocampal neu-
rons [2-4]. Such applications require repeated scanning
over the range of hours. Using this technique, however,
the small physical force exerted leads to a visualization of
the cytoskeleton rather than the membrane contours
when imaging the cell somata [3]. Furthermore, repeated
scanning of the membrane may lead to damage or con-
tamination of the probe due to the adhesive forces
between tip and glycoproteins [5].
SICM is essentially a contact-free scanning technique
which uses electrical resistance changes to detect the dis-
tance between the scanning tip and an insulator [6]. The
first successful scans of living cell surfaces with this
method have been reported on cultured melanocytes and
human colon cancer cells using a constant distance oper-
ating mode [7]. The observation of microvillar dynamics
over the range of ten minutes [8] as well as recordings of
cell somata within a confluent cell layer over 24 h [9] have
been demonstrated using SICM. In order to obtain stable
recordings from steep and overhanging membranes of
non-confluent, single cultured neural cells we have intro-
duced the pulse-mode SICM with floating backstep oper-
ation mode to image the topography of single cell bodies
of neural cells and thus to monitor single cell shape and
volume [10-12]. Recent investigations confirmed the
necessity to operate SICM in backstep-type modes if
images from entire cells with steep slopes are required and
showed that the technique can be extended to a lateral res-
olution of 50 nm [13]. However, the actual resolution of
SICM images is still a matter of debate [14]. Backstep
SICM has also been applied recently to investigate and
guide growth cones of leech neurons [15]. To our knowl-
edge the application of SICM to obtain long term record-
ings of moving entire living cell somata in the range of
Published: 27 October 2009
Journal of Nanobiotechnology 2009, 7:7 doi:10.1186/1477-3155-7-7
Received: 19 August 2009
Accepted: 27 October 2009
This article is available from: />© 2009 Happel and Dietzel; licensee BioMed Central Ltd.
This is an Open Access article distributed under the terms of the Creative Commons Attribution License ( />),
which permits unrestricted use, distribution, and reproduction in any medium, provided the original work is properly cited.
Journal of Nanobiotechnology 2009, 7:7 />Page 2 of 9
(page number not for citation purposes)
hours has not yet been shown. Here we show examples of
the application of backstep SICM to investigate changes in
the shape of a terminal part of a nerve cell process and of
two contact-forming cells as well as of recordings of the
trajectories of a moving oligodendrocyte precursor cell
(OPC) for several hours.
Preparation and cell culture
Neural cells were obtained and cultured as described in
[16] (protocol for mixed cultures) with the exception of
using a cell density of 50 × 10
3
-100 × 10
3
cells per cm
2
.
Oligodendrocyte precursor cells were obtained and cul-
tured as previously described in [17] but instead of chang-
ing the medium to proliferation/differentiation medium
cells were continuously kept in a mixture of DMEM/
Ham's F12 (1:1) supplemented with 10% fetal calf serum.
SICM measurements
SICM measurements were performed using the pulse-
mode SICM previously described [10] operating in float-
ing backstep mode [11]. Briefly summarized, current
pulses of predefined height were applied and the required
voltage measured. The pulse height measured far away
from the sample surface was used to define the basal
resistance. Then, the probe was approached towards an
insulating surface until the resistance exceeded a prede-
fined threshold. A resistance increase of 3% with respect
to the basal resistance was used in the present experiments
to stop the approach. The x, y, z-coordinates of this point
were stored for later reconstruction of the sample surface
topography from successively measured points of equal
resistance changes. To reduce scanning time the distance
that the probe was dragged back was adjusted correspond-
ing to the differences in height detected in a preceeding
low resolution prescan. Scanning probes, filled with bath
saline (containing in mM: NaCl 110, KCl 5.4, CaCl
2
1.8,
MgCl
2
0.8, Glucose 10, HEPES 10), had an inner diameter
of about 1 μm and an access resistance of about 4 MΩ. The
scans were performed in 3.5 cm plastic petri dishes coated
with poly-L-Lysin in Leibovitz-15 medium. Data were
processed using Matlab and ImageJ software.
Long term observation of the terminal part of a nerve cell
process
The terminal part of a nerve cell process of a rat hippoc-
ampal neuron was imaged eleven times in 520 minutes
[see Additional File 1]. Images are shown unfiltered but
interpolated by cubic splines in Figure 1. Images were
obtained with a lateral step size of 500 nm and a vertical
step size of 100 nm, acquisition time was about 20 min-
utes per frame. In the course of the scanning period the
neurite moved towards y = 0 μm merging with the struc-
ture marked by the yellow arrows in Fig. 1A. The lamel-
lipodium is visible as the delta-formed structure at the end
of the neurite (right hand side of the images). Various
membrane changes are visible due to appearing and dis-
appearing filopodia (marked by the red arrows in Fig. 1)
the height of which appeared from 150 nm to 300 nm
(see [14] for the restrictions of height detection via SICM
of small objects). Figure 2 shows the topographic changes
over time in more detail. Fig. 2Ba depicts the height pro-
file along the orange line drawn in Fig. 2A (marked with
a) from the frames A (solid line, 0 min), J (dashed line,
469 min) and K (dotted line, 520 min) from Fig. 1. Since
overall height increased in scan K the height profiles of
frames A and J are easier to compare. The position of the
neurite shifted towards negative y-direction whereas its
width nearly remained constant (about 6 μm). The proc-
ess located left of the neurite in A (marked by the white
arrow in Fig. 2A) gradually merged with the neurite, com-
pletely disappeared in frame F (Fig. 1) and thus is unde-
tectable in the height profiles of scans J and K.
The height profile detected along the orange line marked
as b in Fig. 2A is depicted in Fig. 2Bb. Profiles correspond-
ing to increasing scanning time are displayed in the suc-
cessive traces from bottom to top. In contrast to the
profiles depicted in Fig. 2Ba the neurite only shifted
slightly towards negative y-direction at this position. On
the other hand it widened (from about 6 μm to about 9
μm) and flattened a bit, which could have been due to a
slight retraction of the lamellipodium. This becomes visi-
ble in the difference image shown in Fig. 2C which has
been created from the subtraction of frame A from frame
J (Fig. 1). Here green areas denote areas without any
changes in height, red areas correspond to areas of increas-
ing height and blue areas represent areas of decreasing
height. Whereas the position of the neurite had clearly
shifted towards the negative y-direction (large parallel
dark blue and dark red areas) the position of the lamel-
lipodium changed only slightly. The slight retraction is
visible in the inset in which contrast has been increased
(indicated by the small color scale bar shown in the upper
left of Fig. 2C) and by the light red and orange area indi-
cated by the white arrow. This indicates that the observed
movement occurred not due to drifts in the image frame
that would either result in a similar shift of the lamellipo-
dium or, if the image frame drift was circular, result in an
angular instead of a parallel dislocation of the neurite.
Long term observation of two neural cells establishing a
new cell-cell contact
Figure 3 shows three dimensional plots of the data inter-
polated by cubic splines of six successive scans of a cul-
tured neural cell obtained within 202 min. Lateral step
size was 500 nm, vertical step size was 100 nm, acquisi-
tion time was about 30 min per frame. A movie composed
of the top views of the data is available [see Additional File
2]. The red arrow in Fig. 3A marks the most prominent
process of the observed cell, the blue and green arrows
Journal of Nanobiotechnology 2009, 7:7 />Page 3 of 9
(page number not for citation purposes)
mark two processes most likely originating from a cell
outside the scan area. The yellow arrow marks a fan
formed structure at the terminal part of the process
marked by the green arrow. The structure becomes more
apparent in the magnification with increased contrast
(inset). The orange arrow marks a small cell extension
speculatively in contact with the previously mentioned
fan-formed structure. During the 43 min interval between
the first two scans (Fig. 3B) the position of the extension
putatively forming the connection between the observed
cell and the cell located outside the scan area in the first
image (marked by the orange arrow) has either moved
towards the upper process (blue arrow) as indicated by
the upper orange arrow in Fig. 3B or shifted downwards
(lower orange arrow). The fan-formed structure (yellow
arrow) and the lower cell extension marked by the lower
orange arrow established a new contact as visible in the
magnification with higher contrast (inset). The processes
marked by the blue and green arrow seem to converge in
a branch that becomes visible in the upper right of the
image. Also note the change in shape of the prominent
cell process (red arrow).
Further 41 min later (Fig. 3C) the cell shape had changed
considerably. The major process of the observed cell
(marked by the red arrow) underwent a severe reduction
in size whereas the protrusion forming the putative cell-
cell contact had grown towards its target (orange arrow).
The former fan-shaped sturcture is no longer visible. The
detailed structure of the most likely overlapping mem-
branes remained unresolved. However, a novel mem-
brane protrusion originated from this structure (white
arrow) and a novel process developed (cyan arrow). One
might also interpret this process as the old major process
marked by the red arrow in the previous images. At the
same time the putative target cell had moved closer
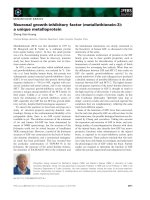
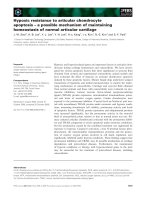
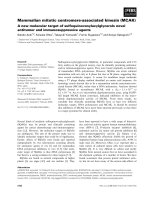
Long term observation of the terminal part of a nerve cell processFigure 1
Long term observation of the terminal part of a nerve cell process. Eleven successive scans of the terminal part of a
nerve cell process performed within 520 minutes. Axes scales represent micrometers as denoted in (K). Yellow arrows in (A)
indicate a structure that gradually merges with the neurite. The lamellipodium is clearly visible on the right hand side of each
image as well as various filopodia sticking out of the neurite (marked by the red arrows). Scanning step sizes were 500 nm and
100 nm in lateral and vertical direction, respectively.
Journal of Nanobiotechnology 2009, 7:7 />Page 4 of 9
(page number not for citation purposes)
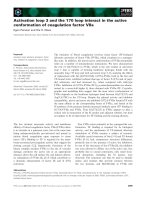
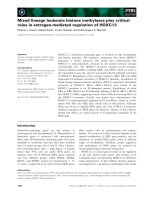
Analysis of the topographical changes of the neurite shown in Fig. 1Figure 2
Analysis of the topographical changes of the neurite shown in Fig. 1. (A) Top view of the first scan of the terminal
part of the nerve cell process (see Fig. 1 A). Orange lines indicate the positions of the height profiles shown in (B). (C) Differ-
ence image between frame A and J from Fig. 1. Lateral scale bars in (A) and (C) represent 3 μm. The color bar on the right
indicates calibration of the z-axis in the large image, small color scale corresponds to the inset. Red and blue areas denote in-
and decreases of height with time, respectively. Inset shows magnified lamellipodium with increased contrast.
Journal of Nanobiotechnology 2009, 7:7 />Page 5 of 9
(page number not for citation purposes)
towards the cell in the scanning frame such that the root
of the two branches (blue and green arrows) now was
located in the scan area. In the fourth scan obtained (Fig.
3D) the position of the cell body had changed (white dou-
ble headed arrow) and the root of the branch formed by
the two processes (marked green and blue) had further
shifted into the scan area. Note the novel cell protrusion
marked by the white arrow and that the upper process of
the branch (marked blue) had become less prominent.
At t = 161 min and 202 min the formerly large process
(marked blue in the previous images) entirely vanished
and a leading single process had established (green
arrow). White arrows indicate unambigiously new mem-
brane extensions indicating that the present scanning con-
ditions do not impede process outgrowth. The structures
resemble the filopodia of the neurite shown in Fig. 1 and
thus could indicate that the ingrowing cell might have
been a neuron.
This observation clearly demonstrates that SICM in the
present configuration is able to observe spontaneously
developing cell rearrangements. Because of the complex
rearrangement that occured, the observed changes in the
shape of cultured neural cells are most likely not induced
by contacts between scanning probe and cell membrane.
Both cells move in opposite directions and many mem-
brane protrusions occur in a non-systematic manner. This
supports the interpretation that the observed displace-
ment of the neurite shown in Fig. 1 is not artificial due to
probe-cell interactions as observed in SICM measure-
ments using slightly different configurations [15].
Observation of a migrating oligodendrocyte precursor cell
Six successive images from a rat oligodendrocyte precur-
sor cell were obtained within 75 minutes using a lateral
step size of 1 μm and a vertical step size of 100 nm [see
Additional File 3]. Acquisition time was about 10 minutes
per frame. The basal plane was noise filtered using a
threshold filter setting every z-value below 1 μm to zero.
Data is shown interpolated by cubic splines in Fig. 4.
The entire cell body moved towards the x- and y-direction
(right hand side of the images) during the time of obser-
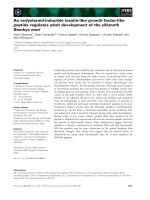
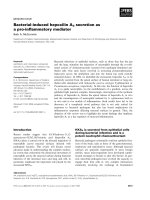
Repeated observation of a cell from a mixed neural-glial cultureFigure 3
Repeated observation of a cell from a mixed neural-glial culture. Six scans of a cultured neural cell performed within
202 min. (A)-(F) Three dimensional plots of the data. Scan dimensions are indicated in (D), height indicated by the color gradi-
ent at the top of frame (A), main scanning direction is indicated by the arrow at the upper left corner in (E). Insets in (A) and
(B) display a magnification of the area marked by the dashes with increased contrast, white scale bar indicates 3.5 μm. Arrows
mark different cell parts that changed during the time of observation. Red: Old main process of the observed cell, orange: new
leading process, blue and green: upper and lower process of the 2
nd
cell, respectively, yellow: terminal fan-formed structure of
the process marked green, cyan: novel process, white: newly emerging membrane protrusions. White double-headed arrow in
(D) marks a change in position of the cell body. Lateral step size was 500 nm, vertical step size was 100 nm, frame acquisition
time was about 30 min.
Journal of Nanobiotechnology 2009, 7:7 />Page 6 of 9
(page number not for citation purposes)
vation. Clearly visible are the deformations of the cell
shape, particularly of the upper part of the cell body
occuring during migration. Whereas the cell height in
scans A (8.3 μm), B (8.2 μm), D (8.2 μm) and F (8.2 μm)
remained nearly constant it was considerably flatter in
scan C (8.0 μm) and higher in scan E (8.5 μm).
Fig. 5 analyzes the locomotion of the OPC in more detail.
The trajectories of the origin of the rear process (blue
arrow), the cell maximum (green arrow) and and the ori-
gin of the front process (red arrow) are superimposed on
the top view of the data of the first scan in Fig. 5A. The
frontal point was defined as the point of steepest slope in
the direction of movement and the rear end as the point
of steepest slope in the direction of retraction. The inset
compares the trajectories (magnified three times; rear-
ranged for clarity). Whereas between scans A and B as well
as between scans C and F (Fig. 4) the cell moves into its
heading direction it undergoes a change in shape leading
to a lateral movement of the cell front (indicated by the
red trajectory of the origin of the frontal process) between
scans B and C (indicated by the black arrow-head in the
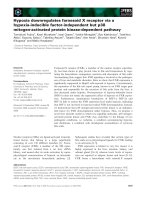
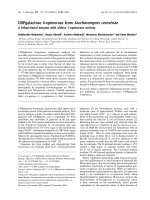
Repeated observation of an oligodendrocyte precursor cellFigure 4
Repeated observation of an oligodendrocyte precursor cell. Six scans of an oligodendrocyte precursor cell recorded
within 75 min. (A)-(F) Three-dimensional plots of the data. Scan dimensions are indicated in (D), main scanning direction is indi-
cated by the arrow in (A). Note movement of the cell body into x- and y-direction (right hand side of the images). Step sizes
were 1 μm in lateral and 100 nm in vertical direction.
Migration analysis of the OPC depicted in Fig 4Figure 5
Migration analysis of the OPC depicted in Fig 4. (A) Trajectories of the origin of the frontal process (red), the maximum
cell height (green) and the origin of the rear process (blue) superimposed on the top-view of the data of the first scan (Fig. 4
A); inset shows the magnified trajectories (rearranged for clarity). (B) Difference image between first and last scan. Lateral scale
bars in (A) and (B) represent 3 μm. (C) Plots of the velocities of each of the three points of observation as defined in (A).
Journal of Nanobiotechnology 2009, 7:7 />Page 7 of 9
(page number not for citation purposes)
inset). In contrast, the rear process only shows minor lat-
eral movements as indicated by the trajectory of the corre-
sponding point of observation (blue trajectory).
Fig. 5B shows the difference composed of the subtraction
of the data of scan A from scan E visualizing the overall
topographical changes in position during the time of
observation. Again, red areas denote areas of increasing
height and thus novel cell locations whereas blue areas
represent areas of decreasing height corresponding to pre-
vious cell locations. Overall locomotion distances
amount to 4.3 μm, 5.0 μm and 4.4 μm for frontal, maxi-
mal and rear observation point, respectively, yielding
velocities of 3.4 μm/h, 4.0 μm/h and 3.5 μm/h for the
respective parts of the cell.
The single average velocities of the points of observation
are plotted in Fig. 5C (colors correspond to the trajectories
shown in Fig. 5A). Average velocities were calculated from
the locomotion distance and the time interval between
two successive scans. Between frames A and B all three
points of observation moved relatively fast with a velocity
of about 9 μm/h (front), 12 μm/h (maximum) and 6 μm/
h (rear). Hence, the point of maximal cell height nearly
moved twice as fast as the rear part. Between scans B and
C movement was slower. Nevertheless, the frontal point
of observation moved approximately three times faster
than the top of the cell and the rear part (about 6 μm/h
compared with about 2 μm/h). Subsequently, the frontal
and rear section nearly maintained their position while
the cell maximum moved rapidly (respective velocities
from back to front: 3 μm/h, 10 μm/h, 2 μm/h), followed
by a distinct movement of the rear part of the cell while
the highest point remained stationary. Between the last
two scans all three cell parts moved rapidly yet the move-
ments of the outer parts dominated. Most interestingly,
the front end of this particular cell exhibited the largest,
more exploratory movements whereas the other parts fol-
lowed with smaller lateral displacements.
The determined velocities match the velocities previously
determined in a detailed study of OPC migration [18] that
yielded a mean migration velocity of about 10 μm/h ± 7
μm/h for OPCs on poly-L-Lysin.
During cellular activity local concentration changes at the
cell surfaces may occur which can amount to approxi-
mately 10% under conditions such as enhanced neuronal
activity [19]. This would affect height detection with the
SICM by 10% since the resistance depends linearly on the
conductance. At the surface of isolated cells in culture the
equilibration of local concentration changes is expected to
be speeded by membrane movements caused by water
fluxes through aquaporins as well as the large diffusion
space of the bath solution.
The speed with which local concentration changes are
equilibrated was estimated as follows: The conductance of
the bath medium is mainly carried by NaCl at the concen-
tration c
0
. The diffusion coefficient of NaCl in water at
room temperature is assumed as D ≈ 10
-9
m
2
/s [20,21] and
further assumed to be independent from the NaCl con-
centration. The distance between probe and sample that
caused the observed resistance to increase to the stop cri-
terion was approximated from approach curves and esti-
mated to be about 400 nm. Thus potential electrolyte
changes exceeding 400 nm could disturb height detection
notably. As maximal possible concentration change that
could distort our measurements we assume a cube with an
edge length of l = 1 μm depleted of NaCl and located at
the border of the sample surface. We define the coordinate
x = 0 as the location of the interface between the cube, that
itself is located at x > 0, and the bath, located at x < 0, in
one dimension. Diffusion into the cube is described by
Fick's second law, (∂c/∂t)
x
= D∂
2
c/∂x
2
(equation 1), and
the average concentration inside the cube at time t is
given by (equation 2) where c(x, t) is
the concentration at location x inside the cube at time t.
Fick's second law is solved assuming the following bound-
ary conditions: At t = 0 s the concentration inside the cube
is c = 0 mM, outside the cube it is c = c
0
and for t > 0 s, the
concentration outside the cube is still c = c
0
for locations
far away from the cube (x → - ∞). To solve the differential
equation (eq. 1) we further assume c = 0 mM for x → ∞.
Inserting the solution of eq. 1 obtained by using these
boundary conditions into eq. 2 yields
. Simplifying this by approximating
(note that s
1/2
denotes the square
root of a second) results in . This
yields (t = 0.001 s) = c
0
, hence, the putative concentra-
tion difference would be compensated in roughly 10 ms.
This estimation neglects the fact that ion influxes into the
cube from five directions occur (assuming the sixth direc-
tion is the probe surface) and particularly the turbulences
caused by the motion of the scanning tip that most likely
further enhance the speed of concentration equilibration.
Since the frame aqcuisition time was about 10 minutes for
scans consisting of 900 pixels and about 20 minutes for
scans consisting of 3600 pixels, on the average a pixel was
detected every 500 ms to 600 ms. Since this is 50 fold to
c
ct l cxt x
l
() ( , )=
−
∫
1
0
d
ct Dt c l() / /=×
π
0
Dl//
/
π
×≈110
12
s
ct c t()
/
=× ×
0
12
10 s
c
Journal of Nanobiotechnology 2009, 7:7 />Page 8 of 9
(page number not for citation purposes)
60 fold the time we estimated for the equilibration of the
maximal possible concentration difference we assumed
that influences in height detection due to ionic fluxes
across the cell membrane were negligible. Nevertheless,
they might affect SICM measurements operating in faster
scanning modes.
Our records demonstrate that SICM in floating backstep
operation is a suitable tool for long term recordings of sin-
gle living cells in culture. Our present observations of a
neurite and the rearrangements of neural processes show
that the SICM can be stably operated to allow investiga-
tions on vital cell structures for more than 8 hours.
Whereas SICM not yet achieves the lateral resolution of
AFM measurements a lateral step size of 500 nm is already
sufficient to grossly locate structures like lamellipodia.
Further refinements of operation mode, software and
scanning tips allow more detailed and high-speed scans of
selected structures [13]. However, smaller probe tips
required for higher resolution imaging detect the surface
at a smaller distance between probe and sample [22] and
thus might cause distortions of the cell movements [15].
Most remarkably, the ability to image entire cell somata
repeatedly and to determine velocities of subcellular parts
of a cell provides new options for the investigation of
changes in cellular shape during migration, potentially
providing a tool to investigate the subcellular distribution
of activity of ion- and water channels involved in cell
migration [23,24] combined with the corresponding sub-
cellular cell surface changes.
Our results confirm that OPCs migrate in a saltatory man-
ner [18] and indicate that the displacement of the nucleus,
that presumably corresponds to the maximal z-value [3],
and the movement of the cell soma boundaries occur in a
distinct but concerted manner. Further investigation of
migrating cells with backstep SICM may unravel the local
dynamics during cell migration and thus help to complete
our understanding of the mechanisms driving cell migra-
tion.
Competing interests
The authors declare that they have no competing interests.
Authors' contributions
Both authors designed the project and prepared the man-
uscript. PH carried out most of the SICM measurements
and data analysis.
Additional material
Acknowledgements
Part of the work was supported by a fellowship to PH from the Allgemeines
Graduiertenkolleg der Ruhr-Universität Bochum. We thank Romy Marx
and Vanessa Niederkinkhaus for help with the cell culture, Maren D. Lange
for performing some SICM measurements, Stefan A. Mann for helpful dis-
cussions, Rolf Heumann, Jan Meijer and the RUBION-team for continuous
support.
References
1. Binnig G, Quate CF, Gerber C: Atomic Force Microscope. Phys
Rev Lett 1986, 56:930-933.
2. Ohnesorge FM, Horber JK, Haberle W, Czerny CP, Smith DP, Binnig
G: AFM review study on pox viruses and living cells. Biophys J
1997, 73(4):2183-94.
3. Yunxu S, Danying L, Yanfang R, Dong H, Wanyun M: Three-dimen-
sional structural changes in living hippocampal neurons
imaged using magnetic AC mode atomic force microscopy.
J Electron Microsc (Tokyo) 2006, 55(3):165-72.
4. Xiong Y, Lee AC, Suter DM, Lee GU: Topography and nanome-
chanics of live neuronal growth cones analyzed by atomic
force microscopy. Biophys J 2009, 96(12):5060-72.
5. Colton RJ, Baselt DR, Dufrene YF, Green JB, Lee GU: Scanning
probe microscopy. Curr Opin Chem Biol 1997, 1(3):370-7.
6. Hansma P, Drake B, Marti O, Gould S, Prater C: The scanning ion-
conductance microscope. Science 1989, 243(4891):641-3.
7. Korchev Y, Bashford C, Milovanovic M, Vodyanoy I, Lab M: Scanning
ion conductance microscopy of living cells. Biophys J 1997,
73(2):653-8.
8. Gorelik J, Shevchuk AI, Frolenkov GI, Diakonov IA, Lab MJ, Kros CJ,
Richardson GP, Vodyanoy I, Edwards CRW, Klenerman D, Korchev
YE: Dynamic assembly of surface structures in living cells.
Proc Natl Acad Sci USA 2003, 100(10):5819-22.
9. Gorelik J, Zhang Y, Shevchuk AI, Frolenkov GI, Sánchez D, Lab MJ,
Vodyanoy I, Edwards CRW, Klenerman D, Korchev YE: The use of
scanning ion conductance microscopy to image A6 cells. Mol
Cell Endocrinol 2004, 217(1-2):101-8.
10. Mann SA, Hoffmann G, Hengstenberg A, Schuhmann W, Dietzel ID:
Pulse-mode scanning ion conductance microscopy-a method
to investigate cultured hippocampal cells. J Neurosci Methods
2002, 116(2):113-7.
Additional file 1
Long term observation of the terminal part of a nerve cell process. A
movie composed of top views of the data presented in Figure 1.
Click here for file
[ />3155-7-7-S1.MPG]
Additional file 2
Long term observation of two neural cells. A movie composed of top
views of the data presented in Figure 3.
Click here for file
[ />3155-7-7-S2.MPG]
Additional file 3
Observation of a migrating oligendrocyte precursor cell. A movie com-
posed of the data presented in Figure 4.
Click here for file
[ />3155-7-7-S3.MPG]
Publish with BioMed Central and every
scientist can read your work free of charge
"BioMed Central will be the most significant development for
disseminating the results of biomedical research in our lifetime."
Sir Paul Nurse, Cancer Research UK
Your research papers will be:
available free of charge to the entire biomedical community
peer reviewed and published immediately upon acceptance
cited in PubMed and archived on PubMed Central
yours — you keep the copyright
Submit your manuscript here:
/>BioMedcentral
Journal of Nanobiotechnology 2009, 7:7 />Page 9 of 9
(page number not for citation purposes)
11. Happel P, Hoffmann G, Mann S, Dietzel ID: Monitoring cell move-
ments and volume changes with pulse-mode scanning ion
conductance microscopy. J Microsc 2003, 212(Pt 2):144-51.
12. Happel P, Wehner F, Dietzel ID: Scanning ion conductance microscopy-
a tool to investigate electrolyte-nonconductor interfaces 2007, 2:968-975
[ />]. FOR-
MATEX, Modern Research and Educational Topics in Microscopy
13. Novak P, Li C, Shevchuk AI, Stepanyan R, Caldwell M, Hughes S,
Smart TG, Gorelik J, Ostanin VP, Lab MJ, Moss GW, Frolenkov GI,
Klenerman D, Korchev YE: Nanoscale live-cell imaging using
hopping probe ion conductance microscopy. Nat Methods
2009, 6(4):279-81.
14. Rheinlaender J, Schaeffer TE: Image formation, resolution, and
height measurement in scanning ion conductance micros-
copy. J Appl Phys 2009, 105(9):.
15. Pellegrino M, Orsini P, De Gregorio F: Use of scanning ion con-
ductance microscopy to guide and redirect neuronal growth
cones. Neurosci Res 2009, 64(3):290-6.
16. Niederkinkhaus V, Marx R, Hoffmann G, Dietzel ID: Thyroid hor-
mone (T3)-induced up-regulation of voltage-activated
sodium current in cultured postnatal hippocampal neurons
requires secretion of soluble factors from glial cells. Mol Endo-
crinol 2009, 23(9):1494-504.
17. Mann SA, Versmold B, Marx R, Stahlhofen S, Dietzel ID, Heumann R,
Berger R: Corticosteroids reverse cytokine-induced block of
survival and differentiation of oligodendrocyte progenitor
cells from rats. J Neuroinflammation 2008, 5:39.
18. Schmidt C, Ohlemeyer C, Labrakakis C, Walter T, Kettenmann H,
Schnitzer J: Analysis of motile oligodendrocyte precursor cells
in vitro and in brain slices. Glia 1997, 20(4):284-98.
19. Dietzel I, Heinemann U, Hofmeier G, Lux H: Stimulus-induced
changes in extracellular Na
+
and Cl-concentration in relation
to changes in the size of the extracellular space. Exp Brain Res
1982, 46:73-84.
20. Harned H, Hildreth C: The Differential Diffusion Coefficients of
Lithium and Sodium Chorides in Dilute Aqueous Solution at
25-Degrees. Journal of the American Chemical Society 1951,
73(2):650-652.
21. Rard J, Miller D: Mutual Diffusion-Coefficients of NaCl-H2O
and CaCl2-H2O at 25-Degrees-C from Rayleigh Interferom-
etry. Journal of Solution Chemistry 1979, 8(10):701-716.
22. Nitz H, Kamp J, Fuchs H: A Combined Scanning Ion-Conduct-
ance and Shear-Force Microscope. Probe microsc 1998,
1:187-200.
23. Schwab A, Nechyporuk-Zloy V, Fabian A, Stock C: Cells move
when ions and water flow. Pflugers Arch 2007, 453(4):421-32.
24. Papadopoulos MC, Saadoun S, Verkman AS: Aquaporins and cell
migration. Pflugers Arch 2008, 456(4):693-700.