báo cáo khoa học: "A signal amplification assay for HSV type 1 viral DNA detection using nanoparticles and direct acoustic profiling" ppsx
Bạn đang xem bản rút gọn của tài liệu. Xem và tải ngay bản đầy đủ của tài liệu tại đây (819.98 KB, 12 trang )
RESEARC H Open Access
A signal amplification assay for HSV type 1 viral
DNA detection using nanoparticles and direct
acoustic profiling
Yildiz Uludağ
1
, Richard Hammond
2
, Matthew A Cooper
2,3*
Abstract
Background: Nucleic acid based recognition of viral sequences can be used toget her with label-free biosensors to
provide rapid, accurate confirmation of viral infection. To enhance detection sensitivity, gold nanoparticles can be
employed with mass-sensitive acoustic biosensors (such as a quartz crystal microbalance) by either hybridising
nanoparticle-oligonucleotide conjugates to complimentary surface-immobilised ssDNA probes on the sensor, or by
using biotin-tagged target oligonucleotides bound to avidin-modified nanoparticles on the sensor. We have
evaluated and refined these signal amplification assays for the detection from specific DNA sequences of Herpes
Simplex Virus (HSV) type 1 and defined detection limits with a 16.5 MHz fundamental frequency thickness shear
mode acoustic biosensor.
Results: In the study the performance of semi-homogeneous and homogeneous assay formats (suited to rapid,
single step tests) were evaluated utilising different diameter gold nanoparticles at varying DNA concentrations.
Mathematical models were built to understand the effects of mass transport in the flow cell, the binding kinetics
of targets to nanoparticles in solution, the packing geometries of targets on the nanoparticle, the packing of
nanoparticles on the sensor surface and the effect of surface shear stiffness on the response of the acoustic sensor.
This lead to the selection of optimised 15 nm nanoparticles that could be used with a 6 minute total assay time to
achieve a limit of detection sensitivity of 5.2 × 10
-12
M. Larger diameter nanoparticles gave poorer limits of
detection than smaller particles. The limit of detection was three orders of magnitude lower than that observed
using a hybridisa tion assay without nanoparticle signal amplification.
Conclusions: An analytical model was developed to determine optimal nanoparticle diameter, concentration and
probe density, which allowed efficient and rapid optimisation of assay parameters. Numerical analysis and
subsequent associated experimental data suggests that the response of the mass sensitive biosensor system used
in conjunction with captured particles was affected by i) the coupled mass of the particle, ii) the proximal contact
area between the particle and the sensor surface and iii) the available capture area on the particle and binding
dynamics to this capture area. The latter two effects had more impact on the detection limit of the system than
any potential enhancement due to added mass from a larger nanoparticle.
Background
The detection of pathogen-specific nucleic acid
sequences provides a precise and accurate method for
clinical and environmental screening. Real-time, label-
free biosensors have the potential to provide rapid and
precise detection of nucleic acids, provided that sample
preparation (including nucleic acid extracti on) is
accomplished without user intervention, and the requi-
site sensitivity and specificity for detection is achieved.
As a label-free method, quartz crystal microbalance
(QCM) technology provides a rapid and effective
method for the detection of both protein analytes (anti-
gen immunoassays) and nucleic acid testing (NAT). The
frequency change of a QCM biosensor can be d escribed
in terms of the total mass of the bound molecules, asso-
ciated shear modulus imparted by the bound analyte
layer and the non-binding bulk viscosity and density
* Correspondence:
2
Cambridge Medical Innovations, 181 Cambridge Science Park, Cambridge,
CB4 0GJ, UK
Uludağ et al. Journal of Nanobiotechnology 2010, 8:3
/>© 2010 Uludağ et al; licensee BioMed Central Ltd. This is an Open Acce ss article distributed under the terms of the Creative Commons
Attribution License ( which permi ts unrestricted use, distribution, and reproduction in
any medium, provided the original work is properly cited.
changes of the liquid adjacent to the sensor surface [1].
Inclusion of additional mass in the form of nanoparticles
conjugated to a specific sequence recognition element
enables the detection of significantly lower concentra-
tions of DNA or RNA fragments.
There are two principle ways in which nanoparticles
are used for NAT enhancement. In the first method,
nanoparticles are conjugated to target oligonucleotides
that hybridise to the probe on the sensor surface [2-4]. In
the second method, biotin tagged target oligonucleotides
bind to avidin-modified nanoparticles [4-7]. The latter
scheme is relatively simple to implement since avidin
modified nanoparticles can be used for different DNA
sequence detection assays, whereas the former method
requires specific oligonucleotide modified nanoparticles
for individual assays. Additionally the assay can be per-
formed either as homogeneous or heterogeneous assay
formats [4,8-12]. For example Mao et al. used streptavi-
din modified ferric oxide nanoparticles (ca. 145 nm dia-
meter) for the detection of Escherichia coli O157:H7 [5].
By employing a heterogeneous assay format with a 10
minute hybridisation perio d fo llowed by a 10 minute sig-
nal en hancement with nanoparticles under flow, they
achieved a detection limit of 10
-12
MforsyntheticDNA
sequences. Pang et al. employed DNA probe-modified 13
nm gold nanoparticles to detect specific sequences from
the b-thalassemia gene [13]. By means of a heterogeneous
assay and one hour hybridisation at 55°C in a static cell
followed by a further hour incubation with nanoparticles,
they achieved a detection limit of 2.6 × 10
-9
M. Liu et al.
modified a QCM sensor surface with gold nanoparticles
to increase the available surface capture area, then
enhanced the hybridisation signal with gold nanoparticles
derivatised with thiolated complimentary DNA [14]. In
this case, the hybridisation assay was performed for two
hours at 40°C in a static cell with a resultant a detection
limit of 10
-16
M. Whilst these assay formats can deliver
impressive limits of detection, they suffer from long incu-
bation times and/or complex amplification procedures
requiring multiple steps that are no t suited to a rapid,
point of care test format.
In the current study, we describe the detection of spe-
cific, conserved DNA sequences of herpes simplex virus
(HSV) type 1. HSV causes recurrent mucosal infections
of the eye, mouth and genital tract. HSV type 1 estab-
lishes a lifelong latent infection within the host which
can subsequently reactivate to cause recurrent infections
and occasionally lif e threatening HSV encephalitis. The
probe and complementary target sequence used for the
HSV recognition assays was from VP16 gene region of
HSV viral sequence, which enc odes for an essential
structural protein and also functions as a major virion
trans-activator of virus gene expression [15]. HSV regu-
latory protein VP16 plays key roles to stimulate viral
gene expression during the earliest stages of infection,
thus it is relevant to diagnose clinical HSV infection by
detectingthegenesencodingVP16asthisisanimpor-
tant replication and virulence determinant.
The objective of this study was to investigate the opti-
mal methodology for signal enhancement w ith gold
nanoparticles to enable both sensitive and rapid HSV
viral sequence detection. In our previous study [16] we
observed that a semi-homogeneous assay format (in
which probe and complimentary target are pre-mixed in
solution) led to a lower assay detection limit than a het-
erogeneous, two-step flow-based assay. Completely
homogeneous assays are advantageous in that they allow
single step, rapid tests that require minimal amounts o f
sample and are easier to embody in a device suitable for
point-of-care diagnostic testing. In this study the results
of semi-homogeneous and completely homogeneous
assays were compared for both NeutrAvidin (NA) and
NA-modified gold nanoparticle signal enhancement
methods. An analytical model for the optimal nanoparti-
cle diameter, concentration and probe density was
developed to allow selection of a sub-set of subsequent
experimental conditions for evaluation.
Materials and methods
Resonant acoustic profiling (RAP) experiments were
conducted using an automated four-channel RAP ◆ id 4
instrument (RAP ◆ id 4; TTP Labtech, Royston, UK).
The instrument applies the principles of QCM sensing,
in that a high frequency (16.5 MHz) oscillating voltage
is applied to a piezoelectric quartz crystal to induce the
crystal to resonate, and its resonance frequency is then
monitored in real time. RAP ◆ id 4 integrates acoustic
detection with a continuous flow micro fluidic delivery
system, a thermal control unit, and automated sample
handling. Four individual flow cells enable up to four
measurements to be performed simultaneously. The
volume of each flow cell used in this study was 900 nl.
Thetimerequiredtoexchangethecompletevolumeof
the flow cell could be set as low as 2.2 seconds at a flow
rate of 25 μl/min and as high as 14 milliseconds at a
flow rate of 4000 μl/min. In order to minimise sample
consumption, 25 μl/min was employed for the pathfin-
der assay development. Baseline drift observed during
the study was 0.25 ± 0.15 Hz (n = 12) after docking and
priming the sensor chips. The operating temperature
was 25 ± 0.5°C throughout the assays.
Preparation of NeutrAvidin modified gold nanoparticles
NeutrAvidin modified gold nanoparticles were synthe-
sized by derivatizing 1 ml of aqueous gold nanoparticles
(BBInternational, Cardiff, UK) with 6 μlofa1mg/ml
solution of NA. The mixture was incubated for an hour
on a shaker at room temperature. Then 100 μlof10
Uludağ et al. Journal of Nanobiotechnology 2010, 8:3
/>Page 2 of 12
mg/ml BSA was added and allowed to stand on a shaker
for further 20 minutes, followed by centrifugation to
remove excess reagents. The supernatant was removed;
then 33 μl10mg/mlBSA,100μlTrisbuffer(20mM
Tris-HCl,150mMNaCl,1mMEDTA,pH7)and1μl
of 5% sodium azide were added. The modified gold
nanoparticleswerestoredat4°Candwarmedtoroom
temperature before use.
Sensor Surface Preparation
AKT ◆ iv Covalent sensor chips (TTP Labtech, Royston,
UK) were employed for the assays. Sensor surfaces were
prepared by immobilising NeutrAvidin (NA; Perbio
Science UK Ltd, Cramlington, UK) on sensors using
conventional amine coupling chemistry. The running
buffer used for immobilisation was degassed Dulbecco’s
modified phosphate buffered saline (PBS, pH 7.4; Sigma-
Aldrich, Poole, UK). The flow rate of the buffer for the
assay was 25 μl/min. Sensor surfaces were first activated
with a 1:1 mixture of 400 mM EDC and 100 mM NHS
(LINK ◆ it Coupling Solution kit; TTP Labtech, Roy-
ston, UK), prepared in 0.22 μm-filtered deionised water,
and mixed immediately prior to use (final concentra-
tions; 200 mM EDC and 50 mM NHS). EDC-NHS was
injected simultaneously across all four sensor surfaces
for 3 minutes. NA (50 μg/mL in PBS buffer) was then
injected simultaneously across sensor surfaces for 3
minutes. Non-reacted NHS esters were capped with 1
M ethanolamine, pH 8.5 (LINK ◆ it Coupling Solution
kit; TTP Labtech, Royston, UK). Frequency changes
relating to protein coupling were recorded 2 minutes
after the protein injection was completed. After NA
immobilisation, the running buffer was changed to Tris
buffer comprising 20 mM Tris-HCl, 150 mM NaCl, 1
mM EDTA, pH 7. Biotinylated complementary surface
probe and scrambled surface probe (biotinylated probes;
TIBMolbiol,Berlin,Germany;Table1)weredilutedin
Tris buffer to 10 μg/ml and injected separately over dif-
ferent flow cells for 3 minutes to create act ive and con-
trol surfaces. The frequency changes of the biotinylated
probes captured were recorded 4 minutes after the end
of the injection.
Hybridisation Signal Enhancement Assay
Running buffer used for the assay was Tris buffer com-
prising 20 mM Tris-HCl, 150 mM NaCl, 1 mM EDTA,
0.05% Tween 20, pH 7. Initially 10 mM Biotin (Sigma-
Aldrich, Poole, UK) in Tris buffer was injected for 1
minute to block the remaining active sites of the NA
layer then semi-homogeneous and homogeneous assays
were performed for VP16 target detection.
Semi-homogeneous assay
The VP16 target sequence and VP16 detection probe
were hybridised in a tube at 55°C for 3 minutes at
required concentrations; VP16 detection p robe concen-
tration being at least twofo ld higher concentration than
the VP16 t arget sequence concentration. The r esultant
hybridised material was then injected over the sensor
surface to be captured by VP16 surface probe. Subse-
quently, to increase the signal NA or NA modified
gold nanoparticle solutions were injected for 3 minutes
(Figure 1 - A). The frequency change due to the binding
was recorded 180 seconds after the injection started.
Homogeneous assay
TheVP16targetsequenceandVP16detectionprobe
were hybridised at 55°C for 3 minute s at required con-
centrations; VP16 detection probe concentration being at
least twofold higher than the VP16 target sequence con-
centration. Depending on the assay evaluated either NA
or NA modified gold nanoparticles was then added to the
hybridised VP16 target and detection probe solution.
Subsequently this mixture was injected across the sensor
surface coated with surface probe as described above
(Figure 1 - B). The frequency change was recorded 180
seconds after the beginning of the injection.
Results and Discussion
HSV-VP16 hybridisation and signal enhancement assay
50 μg/ml NA was immobilised to AKT ◆ iv Covalent
sensors, then 10 μg/ml biotinylated probe was captured
on all sensor sur faces. Biotinylated DNA capture on the
NA layer resulted in 235 ± 10 Hz response (n = 8, data
not shown), followed by capping of the remaining NA
biotin binding sites with 10 mM biotin. As a control
surface VP16 scrambled sequences were captured on
the NA layer and this was followed by the injection of
NA modified gold nanoparticle solution. The level
of non-specific binding observed following exposure to
of 7 × 10
11
particles/ml 15 nm NA modified gold nano-
particles, 3 × 10
10
particles/ml 40 nm or 60 nm NA
modified gold nanoparticles was 1 ± 1 Hz (n = 7, data
not shown).
Table 1 Nomenclatures and sequences of HSV type 1 and control oligonucleotides.
Name DNA Sequence
VP16 Surface probe 5’-Biotin- CTC GTT GGC GCG CTG AAG CAG GTT TTT G-3’-3’
VP16 Scrambled surface probe 5’-Biotin-ACC TGG GCA TGT ATG GTG TCG TCG CGT T-3’-3’
VP16 Target sequence 5’-AAA ACT TCC GTA CCC CT CA A AA A CC T GC T TC A-3’
VP16 Detection probe 5’-GGG TAC GGA AGT TTT TCA CTC GAC - Biotin-3’
Uludağ et al. Journal of Nanobiotechnology 2010, 8:3
/>Page 3 of 12
Homogeneous and semi-homogeneous assay with NA
In our previous work [16] we have found that DNA
hybridisation efficiency could be higher when hybridisa-
tion was performed at annealing temperature in free
solution rather than via in situ hybridization to a probe
on the biosensor surface. The conditions of hybridisa-
tion are a key assay component that defines the strin-
gency of hybridisation [17]. Two of the most important
components of hybridisation conditions are salt concen-
tration and temperature; high stringency is favoured by
low salt concentrations and high temperatures, which
together promote the hybridisation of perfectly matched
single stranded nucleotides to form double s tranded
sequences. It is more practical and appropriate to vary
the annealing temperature of a homogenous solution
before injection than vary the temperature of the flow-
ing solution and biosens or; in addition the hybridisation
process in the bulk, 3D, solution will be more rapid
than that which would occur at the planar, 2D sensor
surface. Before embarking on a comparative study of
reagent ratios, assay fo rmats and particle properties, cal-
culations were performed to assess the expected effect
of various assay components on signal evolution.
Firstly the maximum possible number of NA mole-
cules on the flow cell surface was estimated by model-
ling the NA molecules as spheres packed onto the flat
flow cell surface area with an assumed packing density
of 0.907 (the circle packing density limit) [18]. The
number of NA molecules can be described by:
number NA molecules
a
F
r
NA
==
×
×
−
()
=×0 907
2
0 907 12 5
310
6
2
40 10.
.
111
(1)
Where a
F
is the flow cell area (12.5 mm
2
)andr
NA
is
the radius of the NA molecule (3 nm). The immobilisa-
tion of the surface NA was carried out at 3.3 × 10
-7
M
concentration using 75 μl of solution (1.49 × 10
13
mole-
cules); to achieve the saturation of the surface calculated
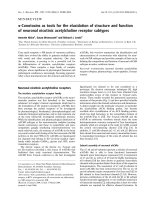
Figure 1 Schematic of the assay formats for semi- homogeneous (A) and homogeneous (B) hybridisation signal enhancement assay.
Uludağ et al. Journal of Nanobiotechnology 2010, 8:3
/>Page 4 of 12
in equation (1) above 2.7% of the material in solution
has to reach the flow cell s urface. This value is the
required mass transport efficiency of the flow cell (that
is the ratio of the mass of material reaching the surface
to the mass of material entering the flow cell) to achieve
sensor surface saturation.
To estimate the actual mass trans port efficiency of the
flow cell a time-stepping mathematical model of the
flow cell was built. The model is a two-dimensional
representation of a cross-sect ion through the flow cell
above the sensor surface; the inputs include the flow
velocity of the liquid matrix, the binding kinetics of the
NA molecules to the surfac e (us ing a Langmuir adsorp-
tion model) and the diffusion properties of particles
through the flow cell to the surface driven by the con-
centration gradient created by particles binding at the
surface. This simulation suggests the flow cell mass
transport efficiency is approximately 1% for the condi-
tions used fo r NA immobilisation in this work. Assum-
ing an efficiency of 1% for the flow cell, the actual
number of NA attached to the flow cell surface during
immobilisation is approximately 1.5 × 10
11
molecules.
Thesystemismasstransport limited and the sensor
surface does not reach saturation of NA molecules.
Finally the active part of the sensor has a surface area of
3.14 mm
2
, one-quarter of the flow cell surface; hence
the number of NA molecules on the active sensor can
be estimated as 3.7 × 10
10
.
This calculated 1% mass transport efficiency noted
above is used for all subsequent analysis. The mass
transport efficiency is affected by four key parameters:
the surface availability (number of binding sites on the
surface), diffusion characteristics of the transported spe-
cies within the liquid, the binding kinetics of the species
to the surface and the initial concentr ation of species in
the liquid passed through the flow cell. Measurements
of transport efficiency of the flow cell geometry used in
these experiments have been made [unpublished data]
using antigen binding to antibodies on the sensor sur-
face (i.e. a similar size species to the NA used in these
experiments but a lower affinity binding mechanism at
the surface). This data indicates the flow cell efficiency
to be between 0.1% and 1% with the higher efficiencies
observed at lower analyte input concentrations. Given
the well-known difficulties of measuring the transport
efficiency of a flow cell accurately and the number of
variables that affect the efficiency a nominal 1% mass
transport efficiency has been used throughout to sim-
plify the analysis.
The number of probes binding to the surface NA
can be estimated assuming an average of two probes
bind per NA (out of the four available sites only two,
on average, are accessible [19,20]. Assuming this 2:1
ratio the number of probes required to saturate the
flow cell NA surface is 3 × 10
11
.When75μl of probe
is injected at a concentration of 1.1 × 10
-6
Mthis
implies a total of 5 × 10
13
potential hybridizatio ns. To
achieve surface saturation, only 0.6% of these probes
need to reach the flow cell surface, a figure within the
efficiency estimate for the flow cell geometry used.
Hence the number of probes on the sensor surface can
be estimated to be 7.4 × 10
10
, which is twice the num-
ber of NA molecules.
In the semi-homogenous assay, 75 μlofVP16target
was injected at 5.2 × 10
-10
M. Assuming 1% mass trans-
port efficiency this suggests that 5.8 × 10
7
targets will
reach the sensor surface t o bind. This is over a thou-
sand-fold less than the number of probes present on the
surface; thus the target is expe cted to be relat ively spar-
sely distributed across the sensor surface with an aver-
age predicted spacing of approximately 260 nm. When
75 μlofNAat8.3×10
-8
M(5μg/ml) is injected, this
reagent is in excess again. Given the targets are, on
average, spatially very distant compared to the size of
the NA molecules we would expect only one NA to
bind per target. Thus the number of NA on the surface
at the completion of the semi-homogeneous assay can
be estimated to be 5.8 × 10
7
. In contrast, for the homo-
geneous assay the target and NA are pre-mixed before
injection into the flow cell. At the same final molar con-
centrations as the semi-homogenous assay (5.2 × 10
-10
M and 8.3 × 10
-8
M respectively) the NA is in excess.
Assuming immediate, homogeneity between the two
volumes, the number of targets binding per NA mole-
cule will follow the Poiss on probability d istribution
(equation 2):
px
x
x
e()
!
=
−
(2)
where p(x) is the probability of x targets binding per
NA molecule and μ is the mean number of targets per
molecule, i.e. the ratio of molarities. In this case μ is
very low (0.006) so most NA have no targets, a small
proportion have one target and almost none have two
or more targets. Hence with this assumption we would
expect evolved signals on the sensor to be the result of
single target-NA interactions, the same as the semi-
homogenous format.
We recall that using the previously reported [16]
semi-homogeneous assay with NA enhancement of sig-
nal, the detection limit obtained for the VP16 probe was
5.2 × 10
-11
M. When the semi-homogeneous and homo-
geneous assay formats were compared experimentally
for detection of 5.2 × 10
-10
M VP16 target (10 times the
detection limit), the homogeneous assay resulted in a
signalof10±4Hz(n=2)andthesemi-homogeneous
assay resulted in a signal of 25 ± 3 Hz (n = 4). The
Uludağ et al. Journal of Nanobiotechnology 2010, 8:3
/>Page 5 of 12
measured homogeneous assay response was half the
response for the semi-homogeneous format suggesting
only half the quantity of NA binds to the surface in the
homogenous format - that is, for the same concentra-
tion of target two targets are binding per NA molecule
and thus 2.9 × 10
7
NA molecules are bound to the sur-
face. This is not as predicted using the Poisson distribu-
tion model assuming complete homogeneity in the first
mixing of target and NA for the homogeneous assay
format.
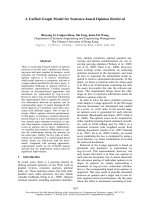
Looking again at the mixing of the homogeneous solu-
tion, by implementing a simple Langmuir adsorption
model of target to the NA molecule the rate of complex
creation can be estimated. For the high k
a
value
(on rate) for the biotin-neutravidin system (7.06 × 10
7
M
-1
.s
-1
) [21] the model suggests the NA molecules
introduced into the target solution become bound with
all the available target in approximately 0.2 of a second
(Figure 2). This speed of binding is much faster than the
NA injection time into the target solution suggesting the
homogeneous format allows more targets to bind per
NA molecule than the semi-homogenous format
because of the favourable binding kinetics in the three-
dimensional space of the bulk solution, leading to a
lower signal from the sensor.
In conclusion, onc e packing density, stoichiometry
and varying reaction kinetics imparted by the dimen-
sionality of hybridisation are taken into account, we
would not expect to improve the sensitivity of the
DNA hybridisation assay using NA amplification alone
in the absence of nanoparticles. The key issues are the
low mass of the NA molecules and their s mall radius;
when multiple targets bind to the NA only one
of them can be brought into proximity with the sur-
face to make a bond. This suggests the assay perfor-
mance may be increased by using more massive, larger
diameter amplification particles such as gold
nanoparticles.
Homogeneous and semi-homogeneous assay with
nanoparticle enhancement
Again, before embarking o n a comparative study of
reagent ratios, assay fo rmats and particle properties, cal-
culations were performed to assess the expected effect
of nanoparticle size on signal evolution. Three diameters
of particles were chosen for analysis: 60, 40 and 15 nm
with a respective mass ratio of 64: 19: 1.
For the semi-homogeneous assay, assuming the same
performance of the surface NA binding and probe
binding as for the previous calculation, 75 μl of target at
1.4 × 10
-9
M with a 1% mass transport efficiency
gives an estimated 1.6 × 10
8
targets on the sensor s ur-
face, on average 160 nm apart. The number of NA
molecules on the surface of the gold nanoparticle can
be estimated in the same way as the sensor surface by
modelling them as packed spheres. For a 60 nm particle,
~360 NA molecules are required to pack the surface
completely; the conjugation conditions with excess NA
ensure the particles are fully packed (Table 2). These
fully-packed particles are then injected into the
flow cell, 75 μlat3.0×10
10
particles per ml. At 1%
mass transport efficiencythisindicates5.6×10
6
gold
particles reach the sensor surface. These approximate
calculations of average target and particle surface
Figure 2 Estimated binding kinetics of target (5.2 × 10
-10
M concentration) to NA molecule using a Langmuir binding model K
a
=10
15
M
-1
. Curves show instantaneous (blue) and cumulative (red) quantities of target bound.
Uludağ et al. Journal of Nanobiotechnology 2010, 8:3
/>Page 6 of 12
densities indicate the surf ace is very sparsely populated
with material. There is, on average, one target every 160
nm along the surface and one gold particle for every 28
targets. Under these sparse conditions it is reasonable to
assume only one target will bind to each gold particle; it
is geometrically difficult for multiple bonds to form
between the surface and the nanoparticles.
Finally, we consider the signal evolution of the bound
nanoparticles through the piezoelectric QCM biosensor.
The most widely u sed formula for predicting frequency
shift in an acoustic sensor under load is the Sauerbrey
equation (equation 3) [22]
Δf
f
s
=
−2
0
2
05
()
.
(3)
where r
s
is the surface mass density (mass per unit
surface area). Applying this formula simplistically to this
semi-homogenous assay format with a 16.5 MHz nom-
inal fundamental frequency f
0
indicates a frequency shift
of -233 Hz from 5.6 × 10
6
60 nm gold particles. How-
ever this formula assumes a mechanically rigid, homoge-
nous layer on the sensor surface; the r eality of a sparse
distribution of large particles attached to the surface by
single NA chains does not approximate well to this
model. In particular the surface is not rigid, hence we
would not expect the response to match this prediction.
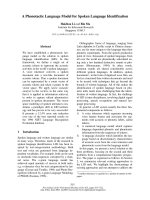
As the Sauerbrey model is not a good approximation
to the actual surface, it is instructive to look more clo-
sely at the effect of surface stiffness on the sensor
response. To do this a m ulti-layer acoustic wave mathe-
matical model of the sensors was built [23]. Figure 3
shows the predicted sensor response as a function of
Table 2 Number of NA molecules available for an
individual gold nanoparticle.
Number of NA
molecules used
to modify gold
nanoparticles
Gold
nanoparticle
diameter
(nm)
Number
of gold
nanoparticles
in 1 ml
solution
used for
modification*
NA capacity of
each nanoparticle
when excess NA
molecules used
6.02 × 10
13
15 1.4 × 10
12
23
6.02 × 10
13
40 8.9 × 10
10
161
6.02 × 10
13
60 2.6 × 10
10
363
*Determined from the suppliers BBInternational (Cardiff, UK).
Figure 3 Predicted change in sensor frequency (expressed as parts per million of the fundamental sensor frequency per particle
bound) as a function of capture layer shear stiffness for 60, 40 and 15 nm gold particles for the 16.5 MHz sensor used in the
experimental work. Note the rapid loss of sensitivity as the stiffness drops below 1 × 10
6
Pa.
Uludağ et al. Journal of Nanobiotechnology 2010, 8:3
/>Page 7 of 12
shear stiffness of the bound layer and the gold particle
size. At high stiffness (1 × 10
7
Pa and greater) the sen-
sor shows a consistent negative frequency response - the
Sauerbrey limit. As the surface becomes less stiff the
response reduces significantly, actually passing through
zero to become positive. This result indicates that the
surface stiffness is a key characteristic of the sensor
response, not just the mass attached to the surface.
Increasing the number of bonds between the gold parti-
cles and the sensor surface will increase the stiffness
and give a greater response per particle attached. A
non-rigid layer as described above for the semi-homoge-
nous assay format is expected to have significantly
reduced response from the Sauerbrey limit.
In the case of the homogeneous assay we assume that
immediate injection of the particles gives rise to a com-
pletely homogeneous solution the distribution of target
per particle; this should follow the Poisson distribution
with a mean of 32 (where the mean is the ratio of mola-
rities at the same target concentration as before, 1.4 ×
10
-9
M) and a standard deviation of 17. For a 60 nm
particle there are ~730 target bind sites per particle
assuming 2 targets can bind per NA as before. Hence
the gold particles would, on average, be 4% full; the tar-
gets are far apart on the particles. However, from the
previous results with NA alone, we know the assump-
tion of a Poisson distribution is not a good one: in rea-
lity the relatively slow injection rate of particles into the
target solution gives an inhomogeneous solution. Some
particles are completely filled and others have no target
at all. Using the same Langmuir binding kinetic model
as for the NA enhanced assay estimates 10% of the 60
nm gold particles will be full of target and the other
90% have no target. When these filled particles pass
across the probe-covered sensor surface multiple target
and probe pairs are made proximal due to the relativ ely
large radius of curvature of the particle: multiple bonds
are made between each particle and the surface as the
probes hybridise with the target. We know that surface
stiffness is important for obtaining sensor sensitivity.
These multiple bonds increase the stiffness significantly
and thus are expected to give a greater negative fre-
quency change signal. As the concentration of target
reduces, the number of targets bound per particle
reduces. At a target concentration of 5.2 × 10
-11
Mthe
Langmuir binding kinetic model predicts only 8 targets
per gold particle. The system is now not capable of
making multiple particle-sensor surface bonds as the
targets are widely spaced on the particles again.
In summary, the sensor response is dependent both
on the mass of the particle and the stiffness of the con-
nection between the particle and the sensor. Due the
binding kinetics in 3D space a homogenous assay format
creates particles with multiple targets allowing high
avidity bonding between the particle and the surface. A
semi-homogenous format only allows single bonds to
take place between particle and surface. Thus for given
concentrations of particles and analyte a homogenous
format is expected to give significantly better response
than a semi-homogenous format.
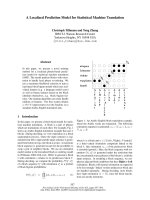
Using the 60 nm particles, semi-homogeneous and
homogeneous formats were assay experimentally using
1.4 × 10
-9
M (6.32 × 10
10
molecules in 75 μl) VP16 tar-
get and 3.0 × 10
10
particles/ml (2.3 × 10
9
particles in 75
μl) 60 nm NA modified gold nanoparticles. While 61 Hz
of response was obtained with the homogeneous assay,
no response was observed with the semi-homogeneous
ass ay (Figure 4). This result confirmed the homogenous
format was preferred with 60 nm gold particle enhance-
ment as it allowed high avidity bonding to the surface
giving strong acoustic coupling (bond stiffness). Lower
concentrations of target were tested to probe the lower
limit of detection. VP16 target at 5.2 × 10
-10
M led to a
35 Hz response, but no response was observed at 5 .2 ×
10
-11
M. This was consistent with the expected response
based on volume binding kinetics analysis of the nano-
particles described above.
This analysis and experimental data suggests the
response of a mass sensitive biosensor system used in
conjunction with captured particles is affected by i) the
coupled mass of the particle, ii) the proximal contact
area between the particle and the sensor surface and iii)
the available capture area on the particle and binding
dynamics to this capture area. These latter two effects
appear to have more impact on the detection limit of
the system than any potential enhancement due to
added mass from the larger particle. Experimentally,
reducing the diameter of the nanoparticle from 60 nm
to 40 nm did not result in any significant change in
assa y detection limit (data not shown), so the study was
extended to use 15 nm diameter NA modified gold
nanoparticles.
In theory, smaller particles should have two advan-
tages: (i) for a given number of targets more particles
are able to b e bound during the homogeneous binding
step so more mass can reach the sensor and (ii) for a
given density of targets on the particle the targets are
closer together and promote high-avidity coupling to
the sensor surface though this is tempered by the smal-
ler radius removing the targets from proximity to the
surface. In the case of the 15 nm particle there are
expected to be approximately 23 NA molecules per par-
ticle, equating to 46 biotin binding sites (Table 2). If 2.4
×10
10
molecules of target are injected (5.2 × 10
-10
M)
the Langmuir binding kinetic model suggests approxi-
mately 8% of the particles will be bound with 10 targets
per particle. When this mixture is injected at a concen-
tration of 3 × 10
10
particles/ml to the flow cell,
Uludağ et al. Journal of Nanobiotechnology 2010, 8:3
/>Page 8 of 12
assuming 1% mass transport efficiency as before,
approximately 1.3 × 10
7
gold particles are able to bind
tightly to the sensor surface with multiple bonds
through the 10 targets. At the lower concentration of
target (5.2 × 10
-11
M) the binding kinetics model sug-
gests one target per particle on 8% of the particles.
However, the same number of particles bind to the sen-
sor but are less well coupled acoustically through a sin-
gle bond - the reduced stiffness is expected to give a
lower response.
When assayed experimentally, the 15 nm nanoparticle
assayhavea89±3Hzsignalat5.2×10
-10
Mtarget
concentration and 12 ± 1 Hz signal at 5.2 × 10
-11
M tar-
get concentration using 5.25 × 10
10
gold nanoparticles
(Figure 5). When the experiment was performed using
lower concentrations of the target, it was possible to
detect down to 5.2 × 10
-12
M of VP16 target, i.e. at a
concentration 10 times lower than the signal enhance-
ment assay with NA and with a signal response 1000
times higher than the direct assay without any signal
enhancement (Figure 6).
To assess the quality of the homogeneous assay with
NA modified 15 nm gold nanoparticles, Z-factor analysis
was employed. The Z-factor provides an easy and useful
measure for assay quality and has been a widely
accepted standard. Z-factor reflects both the assay signal
dynamic range and the data variation associated with
the signal measurements; where a Z-factor between 0.5
and 1.0 is an excellent assay; between 0 and 0.5 is mar-
ginal, and less than 0 means that the signal from the
positive and negative controls overlap, indicating the
invalidity of the assay results (equation 3; average (μ)
andstandarddeviation(s) of both active and control
DNA hybridisation results).
Zfactor
ac
ac
=−
×+
()
−
1
3
(4)
Z-factor values were calculated for the hybridisation of
5.2 × 10
-11
Mand5.2×10
-10
M target sequences as
0.62 and 0.84, respectively, indicating good to excellent
assay performance.
Summary
In this study homogeneous and semi-homogenous
ass ays were compared using both NA and NA modified
gold nanoparticles, and the effect of particle size on
amplification efficiency was investigated by use of 15
nm, 40 nm and 60 nm gold nanoparticles. The highest
sensitivity was achieved with the homogeneous assay
using 15 nm gold nanoparticles. To obtain good
response from an acoustic sensor the target particles
need to be strongly acoustically coupled. This is
achieved by creating multiple bonds between particles
Figure 4 Semi-homogeneous and homogeneous assays using 60 nm NA modified gold nanoparticles.
Uludağ et al. Journal of Nanobiotechnology 2010, 8:3
/>Page 9 of 12
arriving at the surface and the surface itself. For binding
reactions with a high association constant making a
homogenous solution of target and particle allows the
assembly of a small number of densely-packed particles
as the targets bind to the particles fast er than the parti-
cles are added to the solution. For large particles this
assembly process places much of the target on the
‘wrong side’ of the particle; the target cannot interact
with a two-dimensional surface. With smaller particles
the target is more advantageously distributed between
particles allowing more material to bind strongly to the
sensor surface. The interactio n between target-particle
binding kinetics and binding avidity to the s ensor sur-
face becomes increasingly critical as the quantity of tar-
get is reduced.
As can be seen from the examples given in the intro-
duction section, the c onditions of the hybridisation
assay show great variation between applications. The
length of the target DNA sequence (hence molecular
weight of the ligand), hybridisation temperature, hybridi-
sation time, assay format (static or flow, homogeneous
or heterogeneous), the frequency of the quartz crystal
and size of nanoparticles used are some of these varia-
tions and all of these contribute to the sensitivity of the
Figure 5 Homogeneous assay with NA modified 15 nm gold nanoparticles for the detection of 5 × 10
-11
Mtarget.Traces1&3are
responses on active channels; traces 2 & 4 are responses on control channels.
Figure 6 Concentration vs frequency change plot for VP16 target hybridization to VP16 surface probe. White: Heterogeneous assay with
signal enhancement using NA. Light grey: Semi-homogeneous assay with signal enhancement with NA. Dark grey: Homogeneous assay and
with 15 nm NA modified Au nanoparticles. Error bars represent standard deviations for n = 4.
Uludağ et al. Journal of Nanobiotechnology 2010, 8:3
/>Page 10 of 12
QCM assays. Addition of mass in the form of nanoparti-
cles improves the detection limit of the DNA hybridi sa-
tion assays to the region of 10
-12
M. To lower detection
limit, a further amplification can be applied by means of
catalytic deposition of gold on to gold nanoparticles or
catalytic precipitation by means of alkaline phosphatase
[24,25]. Although it is possible to reach detection limit
up to 10
-16
M [25] using catalytic precipitation methods,
these reactions increase the assay time, inherently cause
higher variability of results and would be more difficult
to apply in a miniaturised, point-of-care device. Other
methods applied include use of gold nanoparticles to
enhance the immobilisation of the probe and then
amplification with a second set of gold nanoparticles
[10,26]. Studies are ongoin g to lower the detection limit
of the DNA hybridisation assay using such simplified
procedures.
Conclusion
In this paper we demonstrated a sensitive and rapid
assay for the detection of HSV 1 viral sequences. With
use of 15 nm gold nanoparticles and a 6 minutes assay
time, three orders of magnitude lower sensitivity was
obtained than the assay without nanoparticles amplifica-
tion. There are several reports cited herein that describe
empirical results using different sized nanoparticles for
near identical or similar assays, and for which detection
sensitivities are observed to vary by several orders of
magnitude. However, to the best of our knowledge, this
work is the first exampl e of a detailed theoretical analy-
sis towards a better understanding of the m echanisms
that lead to such differences and the somewhat counter-
intuitive observation that a small diameter particle leads
to greater sensitivity in a mass-based biosensor assay.
Acknowledgements
Matthew Cooper and Yýldýz Uludağ would like to express their gratitude to
the National Institute of Allergy And Infectious Diseases for partial financial
support, NIH Grant Number AI-061243-02.
RAP, RAP ◆ id,AKT◆ iv, LINK ◆ it are registered trademarks of TTP Labtech,
part of TTP Group PLC (UK).
Author details
1
Cranfield Health, Cranfield University, Cranfield, Bedfordshire, MK43 0AL, UK.
2
Cambridge Medical Innovations, 181 Cambridge Science Park, Cambridge,
CB4 0GJ, UK.
3
Institute for Molecular Bioscience, University of Queensland,
306 Carmody Rd., St Lucia, Qld 4072, Australia.
Authors’ contributions
YU carried out the experimental study, contributed to the analysis of the
results and drafted the manuscript. RH participated in the analysis of the
results and drafting of the manuscript. MAC conceived of the study, and
participated in its design and coordination and helped to draft the
manuscript. All authors contributed in the preparation of the manuscript.
Competing interests
The authors declare that they have no competing interests.
Received: 5 November 2009
Accepted: 14 February 2010 Published: 14 February 2010
References
1. Cooper MA, Singleton VT: A survey of the 2001 to 2005 quartz crystal
microbalance biosensor literature: applications of acoustic physics to the
analysis of biomolecular interactions. Journal of Molecular Recognition
2007, 20:154-184.
2. Hutter E, Pileni MP: Detection of DNA hybridization by gold nanoparticle
enhanced transmission surface plasmon resonance spectroscopy. Journal
of Physical Chemistry B 2003, 107:6497-6499.
3. Chen S-H, Wu VCH, Chuang Y-C, Lin C-S: Using oligonucleotide-
functionalized Au nanoparticles to rapidly detect foodborne pathogens
on a piezoelectric biosensor. Journal of Microbiological Methods 2008,
73:7-17.
4. Wang L, Wei Q, Wu C, Ji J, Wang P: A QCM biosensor based on gold
nanoparticles amplification for real-time bacteria DNA detection.
Proceedings of the 2007 International Conference on Information Acquisition,
ICIA 2007, 46-51.
5. Mao X, Yang L, Su XL, Li Y: A nanoparticle amplification based quartz
crystal microbalance DNA sensor for detection of Escherichia coli O157:
H7. Biosensors and Bioelectronics 2006, 21:1178-1185.
6. Okumura A, Sato Y, Kyo M, Kawaguchi H: Point mutation detection with
the sandwich method employing hydrogel nanospheres by the surface
plasmon resonance imaging technique. Analytical Biochemistry 2005,
339:328-337.
7. Tombelli S, Marrazza G, Mascini M: Recent advances on DNA biosensors.
International Journal of Environmental Analytical Chemistry 2001, 80:87-99.
8. Ma ZF, Li JR, Jiang L, Yang MS, Sui SF: High sensitive DNA detection
amplified by enlarging Au-nanoparticles in situ. Chemistry Letters 2002,
328-329.
9. Mo Z, Wang H, Liang Y, Liu F, Xue Y: Highly reproducible hybridization
assay of zeptomole DNA based on adsorption of nanoparticle-
bioconjugate. Analyst 2005, 130:1589-1594.
10. Liu T, Tang J, Han M, Jiang L: Surface modification of nanogold particles
in DNA detection with quartz crystal microbalance. Chinese Science
Bulletin 2003, 48:873-875.
11. Ma Z, Li J, Jiang L, Yang M, Sui SF: High sensitive DNA detection
amplified by enlarging Au-nanoparticles in situ. Chemistry Letters 2002,
328-329.
12. Wang LJ, Wei QS, Wu CS, Hu ZY, Ji J, Wang P: The Escherichia coli O157:
H7 DNA detection on a gold nanoparticle-enhanced piezoelectric
biosensor. Chinese Science Bulletin 2008, 53:1175-1184.
13. Pang LL, Li JS, Jiang JH, Le Y, Shen GL, Yu RQ: A novel detection method
for DNA point mutation using QCM based on Fe3O4/Au core/shell
nanoparticle and DNA ligase reaction. Sensors and Actuators, B: Chemical
2007, 127:311-316.
14. Liu T, Tang Ja, Jiang L: The enhancement effect of gold nanoparticles as
a surface modifier on DNA sensor sensitivity. Biochemical and Biophysical
Research Communications 2004, 313:3-7.
15. Wu TJ, Monokian G, Mark DF, Wobbe CR: Transcriptional activation by
herpes-simplex virus type-1 VP16 in-vitro and its inhibition by
oligopeptides. Molecular and Cellular Biology 1994, 14:3484-3493.
16. Uludag Y, Li X, Coleman H, Efstathiou S, Cooper MA: Direct acoustic
profiling of DNA hybridisation using HSV type 1 viral sequences. Analyst
2008, 133:52-57.
17. Walker JM, Rapley R: Molecular biology and biotechnology Royal Society of
Chemistry, 4 2000.
18. Schwartz JJ, Quakea SR: High density single molecule surface patterning
with colloidal epitaxy. Applied Physics Letters 2007, 91.
19. Snejdarkova M, Svobodova L, Polohova V, Hianik T: The study of surface
properties of an IgE-sensitive aptasensor using an acoustic method.
Analytical and Bioanalytical Chemistry 2008, 390:1087-1091.
20. Smith CL, Milea JS, Nguyen GH: Immobilization of nucleic acids using
biotin-strept(avidin) systems. Immobilisation of DNA on Chips Ii Berlin:
Springer-Verlag Berlin 2005, 261:63-90, Topics in Current Chemistry.
21. Green NM: Avidin.1. Use of 14C biotin for kinetic studies and for assay.
Biochemical Journal 1963, 89:585-591.
22. Sauerbrey G: Verwendung von Schwingquarzen zur Wagung dunner
Schichten und zur Microwagang. ZPhys1959, 155:206-212.
Uludağ et al. Journal of Nanobiotechnology 2010, 8:3
/>Page 11 of 12
23. Johannsmann D: Studies of viscoelasticity with the QCM Heidelberg:
Springer 2007.
24. Pavlov V, Willner I, Dishon A, Kotler M: Amplified detection of telomerase
activity using electrochemical and quartz crystal microbalance
measurements. Biosensors & Bioelectronics 2004, 20:1011-1021.
25. Willner I, Patolsky F, Weimann Y, Willner B: Amplified detection of single-
base mismatches in DNA using micro gravimetric quartz-crystal-
microbalance transduction. Talanta 2002, 56:847-856.
26. Nie LB, Yang Y, Li S, He NY: Enhanced DNA detection based on the
amplification of gold nanoparticles using quartz crystal microbalance.
Nanotechnology 2007, 5.
doi:10.1186/1477-3155-8-3
Cite this article as: Uludağ et al.: A signal amplification assay for HSV
type 1 viral DNA detection using nanoparticles and direct acoustic
profiling. Journal of Nanobiotechnology 2010 8:3.
Submit your next manuscript to BioMed Central
and take full advantage of:
• Convenient online submission
• Thorough peer review
• No space constraints or color figure charges
• Immediate publication on acceptance
• Inclusion in PubMed, CAS, Scopus and Google Scholar
• Research which is freely available for redistribution
Submit your manuscript at
www.biomedcentral.com/submit
Uludağ et al. Journal of Nanobiotechnology 2010, 8:3
/>Page 12 of 12