báo cáo khoa học: "Design and characterization of protein-quercetin bioactive nanoparticles" doc
Bạn đang xem bản rút gọn của tài liệu. Xem và tải ngay bản đầy đủ của tài liệu tại đây (1.89 MB, 14 trang )
RESEARCH Open Access
Design and characterization of protein-quercetin
bioactive nanoparticles
Ru Fang
1
, Hao Jing
1*
, Zhi Chai
1
, Guanghua Zhao
1
, Serge Stoll
2
, Fazheng Ren
1
, Fei Liu
1
and Xiaojing Leng
1*
Abstract
Background: The synthesis of bioactive nanoparticles with precise molecular level control is a major challenge in
bionanotechnology. Understanding the nature of the interactions between the active components and transport
biomaterials is thus essential for the rational formulation of bio-nanocarriers. The current study presents a single
molecule of bovine serum albumin (BSA), lysozyme (Lys), or myoglobin (Mb) used to load hydrophobic drugs such
as quercetin (Q) and other flavonoids.
Results: Induced by dimethyl sulfoxide (DMSO), BSA, Lys, and Mb formed spherical nanocarriers with sizes less
than 70 nm. After loading Q, the size was further reduced by 30%. The adsorption of Q on protein is mainly
hydrophobic, and is related to the synergy of Trp residues with the molecular environment of the proteins. Seven
Q mole cules could be entrapped by one Lys molecule, 9 by one Mb, and 11 by one BSA. The controlled releasing
measurements indicate that these bioactive nanoparticles have long-term antioxidant protection effects on the
activity of Q in both acidic and neutral conditions. The antioxidant activity evaluation indicates that the activity of
Q is not hindered by the formation of protein nanoparticles. Other flavonoids, such as kaempferol and rutin, were
also investigated.
Conclusions: BSA exhibits the most remarkable abilities of loading, controlled release, and antioxidant protection
of active drugs, indicating that such type of bionanoparticles is very promising in the field of bionanotechnology.
Background
Over the last several decades, the development of nano-
particles as drug delivery systems has gained consider-
able interest. Nanotoxicology research has indicated that
[1] not only pharmacological properties but also the bio-
degradability, biocompatibility, an d nontoxicity should
be considered in such new systems. Therefore, synthetic
macromolecules, such as the amphiphilic hyperbranched
multiarm copolymers (HPHEEP-star-PPEPs) [2], poly(2-
eth yl-2 -oxazoline)-b-poly(D,L-lactide) [3], and polye thy-
lene glycol [4], are often investigated; replacing these
synthetic materials with natural proteins, which are
more likely to be accepted by people, has become the
focus of many research studies [5-9]. However, the
microstructure of natural substances is generally
complex and difficult to control; progress largely
depends on knowledge of the physiochemical properties
of the materials.
The potential therapeutic usef ulness of albumin, such
as bovine serum albumin (BSA), is high; it possesses the
ability to transport fatty acids and many other endogen-
ous or exogenous compounds throughout the body
[10,11]. Using a coacervation process, i.e., desolvation
with ethanol and then solidific ation with glutaraldehyde,
BSA can form nanoparticles [7]. Hydrophilic drugs, such
as phosphodiester oligonucleotide, 5-fluorouracil, and
sodium ferulate, among oth ers, can be incorporated into
the m atrix or adsorbed on the surface of nanoparticles
[7-9]. However, the molecular sizes obtained from such
a process are often larger than 70 nm; such particles
cannot be used to entrap hydrophobic drugs, thereby
restricting the development of bio-nanocarriers.
The present study proposes a novel method for
designing a small bioa ctive nanoparticle using BSA as a
carrier to deliver hydrophobic drugs. Quercetin (Q), a
polyphenol widely distributed in vegetables and plants,
* Correspondence: ;
1
CAU and ACC Joint Laboratory of Space Food, College of Food Science and
Nutritional Engineering, China Agricultural University, Key Laboratory of
Functional Dairy Science of Beijing and the Ministry of Education, Beijing
Higher Institution Engineering Research Center of Animal Product, No.17
Qinghua East Road, Haidian, Beijing 100083, China
Full list of author information is available at the end of the article
Fang et al. Journal of Nanobiotechnology 2011, 9:19
/>© 2011 Fan g et al; licensee BioMed Central Ltd. This is an Open Access article distributed under the terms of the Creative Commons
Attribution License ( which permits unr estricted use, distribution, and reproduction in
any medium, provided the original work is properly cited.
is used here as a model of hydrophobic drugs. Q exhi-
bits anti-oxidative, free radical scavenging, anticance r,
and antiviral activities [12]. However, the poor solubility
and low stability of Q in aqueous alkaline medium [13]
restrict the application of this type of drug in oral use.
Dimethyl sulfoxide (DMSO), one of the most versatile
organic solvents in biological science that can accept
hydrogen-bond and interact with the hydrophobic resi-
duesofproteins[14],isusedheretodissolveQ,and
synthesize a novel nanocarrier with interesting drug
delivery capabilities. Some studies have reported that
BSA interacts with Q through trypt ophan (Trp) [15,16].
BSA is a monomeric globular protein formed from 583
amino acid residues, containing two Trps, one of which
is located in the i nner hydrophob ic pocket, correspond-
ing to the so-called site II. Site II is a specific site for
hydrophobic drugs due to its hydrophobicity [11,17]. To
confirm the feasibility of the Trp transport functionality,
lysozyme (Lys) and myoglo bin (Mb) wer e also used in
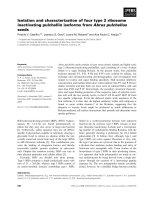
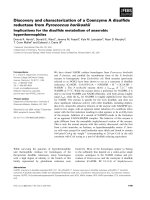
this work for comparison with BSA. Figure 1 exhibits
the molecular structures of Lys, Mb, and BSA. Lys is a
small monomeric globular protein formed from 129
amino acid residues, and contains six Trps. This protein
is known to bind various small ligands, such as metal
ion s, non-metal ions, dyes, and numerous pharmaceuti -
cals [18-20]. Mb is a small heme protein for oxygen sto-
rage and transport. I t contains a single polypeptide
chain of 153 amino acid residues and two Trps. The
polypeptide chain provides a nonpolar pocket to accom-
modate and stabilize the porphyrin ring [21-23].
In the prese nt study, the Q binding and releasing
capacity of Lys and Mb are compared with those of
BSA. The salting out method was combined with UV-
Vis spectrometry to determine the binding capacity of
the proteins. The release of Q from nanocarriers was
detected in acidic and neutral conditions. The antioxi-
dant properties of the bound Q in proteins were evalu-
ated by 2,2-diphenyl-1-picrylhydrazyl (DPPH) and 2,2’-
azino-bis(3-ethylbenzoth iazoline-6-sulfonic acid) (ABTS)
radicals. Raman, fluorescence, and UV-Vis spectroscopy
were combined to study the secondary and tertiary
structures of the protein aggregates.
Results and Disc ussion
Size and Zeta Potential Measurements
Scanning transmission electron microscopy (STEM) and
dynamic light scattering (DLS) were combined to ana-
lyze the size and conformational features of the BSA,
Lys,andMbsystems,asshowninFigures2,3,4,&5.
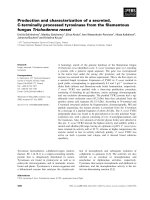
STEM micrographs show that the native BSA, Lys, and
Mb molecules (without DMSO) were cross-linked, and
formed loose aggregates (Figures 2A, A’, and A’’). When
the added a mount of DMSO was over 10% (v/v),
DMSO-inducing protein (BSA, Lys, or Mb) na noparti-
cles (D-BSA, D-Lys, or D-Mb) formed, showing compact
and spherical aggregates (Figures 2B, B’,and2B’’). After
adding 1.5 × 10
-4
mol/L Q solution prepared with 10%
DMSO, spherical and compact Q loaded protein (BSA,
Lys, or Mb) nanoparticles (D-BSA-Q, D-Lys-Q, or
D-Mb-Q) also occurred (Figures 2C, C’,and2C’’), but
their size decreased compared with the system without
Q, particularly the D-BSA-Q aggregates, which markedly
decreased in size.
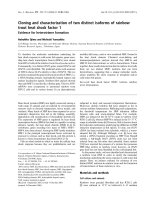
The autocorrelation function curve (ACF) of light
scattering, G(τ)(τ is delay time), was used to determine
the hydrodynamic particle sizes of the system [24,25].
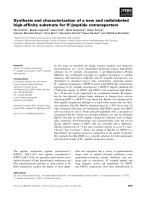
ThesizeofD-BSA(Figures3Aand3A’)andD-Lys
(Figures 4A and 4A’) was less than 50 nm when the con-
centrationofDMSOwaslessthan40%;thisincreased
markedly with increasing DMSO concentrations. The
sizeofD-Mbwasmaintainedatabout70nmwhenthe
DMSO concentration was less than 20%; serious precipi-
tation is produced with concentrations of DMSO over
40% (Figures 5A and 5A’). Therefore, the concentra tion
of DMSO was maintained at 10%, but the concentration
of Q was changed. The sizes of D-BSA-Q (Figures 3B
and 3B’), D-Lys-Q (Figures 4B and 4B’), and D-Mb-Q
(Figures 5B and 5B’) became smaller than those of
D-BSA, D-Lys, and D-Mb, respectively. Moreover, the
sizes of both D-Lys-Q and D-Mb-Q were generally larger
than D-BSA-Q. These observations were in accordance
with the STEM analysis.
Figure 1 Schematic drawing of the Lys, Mb, and BSA
molecules. Trp residues are marked in red.
Fang et al. Journal of Nanobiotechnology 2011, 9:19
/>Page 2 of 14
100 nm
100 nm
100 nm
100 nm
100 nm
100 nm
A’’
B’’
C’’
A’
B’
C’
100 nm
100 nm
100 nm
A
B
C
Figure 2 STEM images of BSA, Lys, and Mb system. The concentration of BSA, Lys, or Mb was 1.5 × 10
-5
mol/L. (A) Native BSA, no DMSO
and Q were added; (B) 10% DMSO and BSA; (C) 10% DMSO, 1.5 × 10
-4
mol/L Q and BSA; (A’) Native Lys, no DMSO and Q were added; (B’) 10%
DMSO and Lys; (C’) 10% DMSO, 1.5 × 10
-4
mol/L Q and Lys; (A’’) Native Mb, no DMSO and Q were added; (B’’) 10% DMSO and Mb; (C’’) 10%
DMSO, 1.5 × 10
-4
mol/L Q and Mb.
1E-7 1E-6 1E-5 1E-4 1E-3 0.01 0.1 1 10 100
0.0
0.2
0.4
0.6
0.8
1
.
0
DMSO: 70%
DMSO: 60%
DMSO: 50%
DMSO: 40%
DMSO: 30%
DMSO: 20%
DMSO: 10%
DMSO: 0%
G ( )
(s)
A
0 10203040506070
0
20
40
60
80
100
120
140
Size (nm)
DMSO (%)
A'
1E-7 1E-6 1E-5 1E-4 1E-3 0.01 0.1 1 10 100
0.0
0.2
0.4
0.6
0.8
1.0
Q/D-BSA= 0
Q/D-BSA= 2
Q/D-BSA= 4
Q/D-BSA= 6
Q/D-BSA= 8
Q/D-BSA= 10
G ( )
(s)
B
0246810
0
2
4
6
8
10
12
14
Size (nm)
Q/ D-BSA
B'
Figure 3 DLS measurements of the BSA system.The
concentration of BSA was 1.5 × 10
-5
mol/L. (A) ACF of BSA vs. the
concentration of DMSO; (A’) Size distribution histogram of BSA vs.
the concentration of DMSO; (B) ACF of BSA vs. the concentration of
Q; (B’) Size distribution histogram of BSA vs. the concentration of Q.
The concentration of DMSO was maintained at 10% in B and B’.
1E-7 1E-6 1E-5 1E-4 1E-3 0.01 0.1 1 10 100
-0.1
0.0
0.1
0.2
0.3
0.4
0.5
0.6
0
.7
DMSO: 70%
DMSO: 60%
DMSO: 50%
DMSO: 40%
DMSO: 30%
DMSO: 20%
DMSO: 10%
DMSO: 0%
G ( )
(s)
A
0 10203040506070
0
50
100
150
200
2
5
0
A'
Size (nm)
DMSO (%)
1E-7 1E-6 1E-5 1E-4 1E-3 0.01 0.1 1
0.0
0.1
0.2
0.3
0.4
0.5
B
Q/D-Lys= 0
Q/D-Lys= 2
Q/D-Lys= 4
Q/D-Lys= 6
Q/D-Lys= 8
Q/D-Lys= 10
G ( )
(s)
0246810
0
10
20
30
40
50
60
B'
Size (nm)
Q/ D-Lys
Figure 4 DLS measurements of the Lys system.The
concentration of Lys was 1.5 × 10
-5
mol/L. (A) ACF of Lys vs. the
concentration of DMSO; (A’) Size distribution histogram of Lys vs.
the concentration of DMSO; (B) ACF of Lys vs. the concentration of
Q; (B’) Size distribution histogram of Lys vs. the concentration of Q.
The concentration of DMSO was maintained at 10% in B and B’.
Fang et al. Journal of Nanobiotechnology 2011, 9:19
/>Page 3 of 14
Figure 6 shows the variat ion of the zeta po tential of
the BSA, Lys, and Mb systems versus the concentration
of DMSO (A, A’,andA’’ )andQ(B, B’,andB’’). With
increasing DMSO concentration, the zeta potential
values of D-BSA, D-Lys, and D-Mb tended to decline to
zero (A, A’ and A’’). The loss of surface charges indi-
cates that the protein aggregations were caused by the
gradually enhanced hydrophobic forces compared with
electrostatic ones. Upon addition of Q, the zeta potential
values of D-BSA-Q, D-Lys-Q, and D-Mb-Q became
-12.5, 2.5, and -5 mV (B, B’,andB’’), respectively. Size
analysis showed that D-BSA-Q, D-Lys-Q, and D-Mb-Q
were smaller than D-BSA, D-Lys, and D-Mb, respec-
tively, indicating that protein aggregation was hindered
by electrostatic repulsion in these systems compared with
the system without Q. The corresponding potential varia-
tions could be related to the features of the amino acid
residues of the polypeptide backbone and protein struc-
tural transformation causedbyQ.Toattainabetter
understanding of the changes in the secondary and tertiary
structures of the protein molecules during aggregation,
Raman, fluorescence, and UV-Vis spectroscopy were per-
formed. The molecular mass of nativ e BSA, Lys, and Mb
molecules (M
BSA
,M
Lys
,andM
Mb
), D-BSA-Q, D-Lys-Q,
and D-Mb-Q prepared with 1.5 × 10
-4
mol/L Q and 10%
DMSO (M
D-BSA-Q
,M
D-Lys-Q
,andM
D-Mb-Q
), were deter-
mined using the DLS method. The ratio of M
D-BSA-Q
/
M
BSA
obtained was found to vary between 1.1 and 2.2,
indicating that one BSA nanocarrier consisted of not more
than 2 BSA molecules. However, the obtained ratios of
M
D-Lys-Q
/M
Lys
and M
D-Mb-Q
/M
Mb
were 4.8 and 5.1,
respectively, indicating that one Lys nanocarrier consisted
of more than 4 Lys molecules, and one Mb nanocarrier
consisted of more than 5 Mb molecules.
Laser Raman spectroscopy
Raman spectroscopy was employed to investigate
changes in the secondary and tertiary structures of the
protein molecules during aggregation. Figure 7 com-
pares the Raman spectra of native BSA and D-BSA in
the 1800-400 cm
-1
region. Consistent with the literature
[26,27], the secondary structure of native BSA was lar-
gely a-helical in form; this was su pported by an amide I
signal at 1654 cm
-1
. The decrease in band intensity with
DMSO concentration presented in Table 1 indicates the
loss of the a-helix during aggregation. Meanwhile, the
broadening of this band and the increase of the band
intensity at 1665 cm
-1
implies the increase of the ran-
dom-coil content in the protein structure [26].The coin-
cident trends were observed in Lys (Figu re 8) and Mb
(Figure 9) systems. Over 30% of the secondary structure
of native Lys presented in random coil co nformation, as
supported by an amide I signal at 1665 cm
-1
and an
amide III signal at 1245 cm
-1
. The change in intensity of
1E-7 1E-6 1E-5 1E-4 1E-3 0.01 0.1 1 10
0.0
0.2
0.4
0.6
0.8
1
.
0
DMSO: 30%
DMSO: 20%
DMSO: 10%
DMSO: 0%
G ( )
(s)
A
0102030
0
30
60
90
120
150
180
A'
Size (nm)
DMSO (%)
1E-7 1E-6 1E-5 1E-4 1E-3 0.01 0.1 1 10 100
0.0
0.2
0.4
0.6
0.8
1.0
B
Q/D-Mb= 0
Q/D-Mb= 2
Q/D-Mb= 4
Q/D-Mb= 6
Q/D-Mb= 8
Q/D-Mb= 10
G ( )
(s)
0246810
0
20
40
60
80
B'
Size (nm)
Q/D-Mb
Figure 5 DLS measurements of the Mb system.The
concentration of Mb was 1.5 × 10
-5
mol/L. (A) ACF of Mb vs. the
concentration of DMSO; (A’) Size distribution histogram of Mb vs.
the concentration of DMSO; (B) ACF of Mb vs. the concentration of
Q; (B’) Size distribution histogram of Mb vs. the concentration of Q.
The concentration of DMSO was maintained at 10% in B and B’.
0 10203040506070
-15
-10
-5
0
5
Zeta potential (mV)
DMSO (%)
A'
0246810
-10
-5
0
5
10
Zeta potential (mV)
Q/D-Lys
B'
0 10203040506070
-15
-10
-5
0
5
Zeta potential (mV)
DMSO (%)
A''
0246810
-10
-5
0
5
10
Zeta potential (mV)
Q/D-Mb
B''
0 10203040506070
-20
-15
-10
-5
0
Zeta potential (mV)
DMSO (%)
A
0246810
-20
-15
-10
-5
0
Zeta potential (mV)
Q/D-BSA
B
Figure 6 Zet a potential measurements of BSA, Lys, and Mb
systems. The concentration of BSA, Lys, or Mb was 1.5 × 10
-5
mol/L. (A) Zeta potential of BSA vs. the concentration of DMSO; (B)
Zeta potential of BSA vs. the concentration of Q. (A’) Zeta potential
of Lys vs. the concentration of DMSO; (B’) Zeta potential of Lys vs.
the concentration of Q. (A’’) Zeta potential of Mb vs. the
concentration of DMSO; (B’’) Zeta potential of Mb vs. the
concentration of Q. The concentration of DMSO was kept constant
at 10% in B, B’, and B’’. Solid lines were used to illustrate the trends
of the experimental data (in symbols) in both A, A’,A’’,B, B’, and B’’.
Fang et al. Journal of Nanobiotechnology 2011, 9:19
/>Page 4 of 14
these bands, presented in Table 2, shows the increase of
random-coil in protein microstructures with DMSO.
The secondary structure of the native Mb was largely a-
helical in form, as supported by an amide I signal at
1659 cm
-1
. Similar to the cas e of D-BSA, the disappear-
ance of this band with DMSO concentration, presented
in Table 3, indicates the decrease of a-helix during
aggregation.Theincreaseinintensityofthebandat
1669 cm
-1
implies an increase in random-coil content in
the protein structure during aggregation. The loss of the
a-helix is attributed to the competition between the S =
O group of DMSO and the C = O groups of protein for
the amide’s hydrogen molecules, resulting in the partial
unfolding of the polypeptide chain, exposure of the
internal hydrophobic groups, and promotion of protein
aggregation by hydrophobic effects and H-bonding
[14,28]. This belief is supported by the zeta potential
measurements in the previous section.
The Raman spectra of D-BSA-Q and D-Lys-Q are
shown in Figures 10 and 11, respectively; here, the
concentration of DMSO was kept constant at 10%. The
band at 1611 cm
-1
(Figures 10 and 11), which is sensi-
tive to the bound ligands, is a marker of the orientati on
of the indole ring of Trp with respect to the Ca atom of
the peptide backbone [29]. The increase in band intensi-
ties shown in Tables 4 and 5 indicates that the added Q
led to the reorientation of the indole ring through the
adj ustment in the torsional angle of the side chain. The
bands near 1319 and 600 cm
-1
were ascribed to aliphatic
CH
2
twisting deformations and the pyrro le ring skeletal
of Trp [30], respectively. The significant increase in
their intensities with increasing Q proved the interac-
tions between Trp and Q (Figures 10 and 11, Tables 4
and 5). The bands near 1339 [31,32] and 758 [33] cm
-1
have been found to be indicators of t he hydrophobicity
of the Trp environment, and a decrease in these band
1800
1600
1400
1200
1000
800
600
400
(b)
(c)
(d)
(e)
(a)
1665
1654
1002
wavenumber / cm
-1
Figure 7 Raman spectrum of BSA system vs. the concentration
of DMSO. The concentration of BSA was 1.5 × 10
-5
mol/L. (a)
Native BSA; (b) BSA and 10% DMSO; (c) BSA and 30% DMSO; (d)
BSA and 50% DMSO; (e) BSA and 70% DMSO.
Table 1 Intensities
a
of Raman Band of BSA system
1665 cm
-1
1654 cm
-1
BSA N. D. 0.54
BSA + DMSO (10%) 0.31 0.34
BSA + DMSO (30%) 0.36 0.23
BSA + DMSO (50%) 0.39 0.22
BSA + DMSO (70%) 0.41 N. D.
a
Integrated intensity (peak intensity) relative to that of the phenylalanine
band at 1002 cm
-1
. N. D. = not detected. The concentration of BSA was 1.5 ×
10
-5
mol/L.
1800
1600
1400
1200
1000
800
600
400
(a)
(b)
(c)
(d)
(e)
1665
1245
1008
wavenumber / cm
-1
Figure 8 Raman spectrum of Lys system vs. the concentration
of DMSO. The concentration of Lys was 1.5 × 10
-5
mol/L. (a) Native
Lys; (b) Lys and 10% DMSO; (c) Lys and 30% DMSO; (d) Lys and 50%
DMSO; (e) Lys and 70% DMSO.
1800
1600
1400
1200
1000
800
600
400
1002
(a)
(b)
(c)
(d)
(e)
1669
1659
wavenumber / cm
-1
Figure 9 Raman spectrum of Mb system vs. the concentration
of DMSO. The concentration of Mb was 1.5 × 10
-5
mol/L. (a) Native
Mb; (b) Mb and 10% DMSO; (c) Mb and 30% DMSO; (d) Mb and
50% DMSO; (e) Mb and 70% DMSO.
Fang et al. Journal of Nanobiotechnology 2011, 9:19
/>Page 5 of 14
intensities (Figures 10 and 11, Tables 4 and 5) indicates
that the molecular environment of Trp is more h ydro-
phobic due to the interactions between the indole ring
and Q.
The intensity of the band near 1420 cm
-1
,whichwas
observed in the Raman spectra of D-BSA-Q (Table 4),
increased with Q, indicating exposure of the ionized car-
boxyl group (COO
-
) of aspartic (Asp) and glutamic acid
(Glu) residues [29,34,35], the PK
a
values of which are
3.9 an d 4.3, respectively. These resulted in the negative
charges of the particles. The intensity of the band at
1500 cm
-1
increased with Q (Table 5), indicating expo-
sure of the ionized amino group (NH
3
+
)oflysine(Lys)
and arginine (Arg) residues, the PK
a
values of which are
10.5 and 12.5, respectively [36]. These resulted in the
positive charges of the particles. The negative or positive
charges weakened the tendency of the particles to
undergo aggregation. This conclusion is in agreement
with the zeta potential measurements in the previous
section.
Mb consists of eight helical regions and a non-cova-
lent bound heme prosthetic group, which is buried in a
relatively hydrophobic pocket interior of the protein.
With laser excitation, the Raman bands of the porphyrin
skeleton, appearing between 1650 and 1100 cm
-1
,
become very intense and disturb the signals of the other
bands (Figure 12). This phenomenon brings difficulty in
theanalysisinthisregion[21,37].Inaddition,the
approach of two Trp residues to the heme results in a
partial energy transfer of the chromophoric group in
Trp [37], and causes the Raman bands arising from Trp,
such as those at 1611, 1319, and 600 cm
-1
, to become
very weak (Figure 12).
Fluorescence Spectroscopy
Figure 13 compares the fluorescence spectra of the
D-BSA (A), D-Lys (A’ ), D-Mb (A’’), D-BSA-Q (B),
D-Lys-Q (B’), and D-Mb-Q (B’’) versus the concentra-
tion of DMSO or Q. At an excitation wavelength of 280
nm, native BSA and Lys showed maximum intrinsic
fluorescence at 340 nm, while Mb showed a maximum
at 328 nm; these are believed to be caused by Trp resi-
dues. Of the two Trp residues in BSA, one is located
near the surface of the protein molecule; in the case of
Lys [38] and Mb [37], three and one T rp residues are
respectively located near the surfaces of the molecules.
Thefluorescenceoftyrosine(Tyr)residues(304nm)
was extremely weak and could be neglected. A slight
Table 2 Intensities
a
of Raman Band of Lys system
1665 cm
-1
1245 cm
-1
Lys 0.41 0.31
Lys + DMSO (10%) 0.27 0.17
Lys + DMSO (30%) 0.60 0.47
Lys + DMSO (50%) 0.55 0.42
Lys + DMSO (70%) 0.56 0.48
a
Integrated intensity (peak intensity) relative to that of the phenylalanine
band at 1008 cm
-1
. The concentration of Lys was 1.5 × 10
-5
mol/L.
Table 3 Intensities
a
of Raman Band of Mb system
1669 cm
-1
1659 cm
-1
Mb N.D. 0.08
Mb + DMSO (10%) 0.18 N.D.
Mb + DMSO (30%) 0.22 N.D.
Mb + DMSO (50%) 0.14 N.D.
Mb + DMSO (70%) 0.22 N.D.
a
Integrated intensity (peak intensity) relative to that of the phenylalanine
band at 1002 cm
-1
. N. D. = not detected. The concentration of Mb was 1.5 ×
10
-5
mol/L.
1800
1600
1400
1200
1000
800
600
400
(a)
(b)
(c)
(d)
1002
1611
1420
1319
1339
600
wavenumber / cm
-1
Figure 10 Raman spectrum of BSA system vs. the concentration
of Q. The concentrations of BSA and DMSO were maintained at 1.5 ×
10
-5
mol/L and 10%, respectively. (a) 0 mol/L Q; (b) 3.0 × 10
-5
mol/L
Q; (c) 9.0 × 10
-5
mol/L Q; (d) 1.5 × 10
-4
mol/L Q.
1800
1600
1400
1200
1000
800
600
400
1611
(a)
(b)
(c)
(d)
1319
600
758
1008
wavenumber / cm
-1
1500
Figure 11 Raman spectrum of Lys system vs. the concentration
of Q. The concentrations of Lys and DMSO were maintained at
1.5 × 10
-5
mol/L and 10%, respectively. (a) 0 mol/L Q; (b) 3.0 ×
10
-5
mol/L Q; (c) 9.0 × 10
-5
mol/L Q; (d) 1.5 × 10
-4
mol/L Q.
Fang et al. Journal of Nanobiotechnology 2011, 9:19
/>Page 6 of 14
increase in the intensity of fluorescence, as well as a
blue shift, was o bserved when the concentration of
DMSO in the BSA and Lys system s was less than 70%
(Figures 13A and A’); th is indicates that the microenvir-
onment of Trp residues was more hydrophobic. In the
case of Mb, a slight increase in fluorescence intensity
also occurred, but a red shift, rather than a blue one,
was observed (Figure 13A’’). This suggests that the Trp
residues in Mb were more hydrophilic. These phenom-
ena may have resulted from structural changes in the
proteins. When the concentration of DMSO was
increased to 70%, a sharp increase in the fluoresc ence
intensity in the Lys and Mb systems (Figures 13A’ and
A’’) was observed, indicating that the surface Trp resi-
dues were buried into the protein aggregates [39-41].
With the addition of Q, fluorescence quenching was
observed in D-BSA, D-Lys, and D-Mb; simultaneous slight
blue shifts also occurred (Figures 13B, 13B’,and13B’’).
Quenching processes usually involve two modes, dynamic
and static. Dynamic quenching occurs when the excited
fluorophore experiences contact with an atom or molecule
that can facilitate non-radiative transitions to the ground
state, while static quenching implies either the existence of
a spherical region of effective quenching, or the formation
of a ground-state non-fluorescent complex. In many cases,
the fluorophore can be quenched both by collision and by
complex formation with the same que ncher [42,43]. The
binding of Q with BSA, Lys, or Mb was static, as Q was
less than 1.5 × 10
-5
mol/L. The mode was determined by
comparing the fitting results of the dynamic, static, and
the combination modes to the D-BSA-Q, D-Lys-Q, and
D-Mb-Q systems (See Additional File 1: Fitting results of
the different modes on the experimental data). In this
case, the binding constant (K
a
) is equivalent to the
quenching constant, which was determined by fitting Eq.
1 to the experimental data.
F
0
F
=1+K
a
[Q
]
(1)
Where F
0
and F represent the fluorescence intensities
without and with the ligands, respectively; K
a
is defined
Table 4 Intensities
a
of Raman Band in BSA
1613 cm
-
1
1420 cm
-
1
1339 cm
-
1
1319 cm
-
1
600 cm
-
1
D-BSA 0.20 1.01 0.51 0.59 0.12
D-BSA + Q2 0.49 1.13 0.46 0.73 0.54
D-BSA + Q6 0.42 1.40 N. D. 0.69 0.49
D-BSA +
Q10
1.15 1.32 N. D. 0.78 1.72
a
Integrated intensity (peak intensity) relative to that of the phenylalanine
band at 1002 cm
-1
. N. D. = not detected. The concentration of BSA was 1.5 ×
10
-5
mol/L, and DMSO was kept at 10%. Q2, Q6, and Q10 indicate
concentrations of Q at 3.0 × 10
-5
, 9.0 × 10
-5
, and 15.0 × 10
-5
mol/L,
respectively.
Table 5 Intensities
a
of Raman Band in Lys
1611 cm
-1
1500 cm
-1
1319 cm
-1
758 cm
-1
600 cm
-1
D-Lys 0.13 0.09 0.12 0.77 0.01
D-Lys+ Q2 1.00 0.10 0.82 0.74 0.74
D-Lys+ Q6 1.51 0.18 1.25 0.27 1.09
D-Lys+ Q10 1.83 0.47 1.56 0.22 1.40
a
Integrated intensity (peak intensity) relative to that of the phenylalanine
band at 1008 cm
-1
. The concentration of Lys was 1.5 × 10
-5
mol/L, and DMSO
was kept at 10%. Q2, Q6, and Q10 indicate concentrations of Q at 3.0 × 10
-5
,
9.0 × 10
-5
, and 15.0 × 10
-5
mol/L, respectively.
1800
1600
1400
1200
1000
800
600
400
1002
(a)
(b)
(c)
(d)
wavenumber / cm
-1
Figure 12 Raman spectrum of Mb system vs. the concentration
of Q. The concentrations of Mb and DMSO were maintained at 1.5
×10
-5
mol/L and 10%, respectively. (a) 0 mol/L Q; (b) 3.0 × 10
-5
mol/L Q; (c) 9.0 × 10
-5
mol/L Q; (d) 1.5 × 10
-4
mol/L Q.
300 330 360 390 420 450
0
200
400
600
800
1000
DMSO: 70%
DMSO: 50%
DMSO: 30%
DMSO: 10%
DMSO: 0%
Fluorescence Intensity
A'
300 330 360 390 420 450
0
100
200
300
400
500
Q/D-Lys: 0
Q/D-Lys: 1
Q/D-Lys: 2
Q/D-Lys: 3
Q/D-Lys: 4
Q/D-Lys: 5
Q/D-Lys: 6
Q/D-Lys: 7
Q/D-Lys: 8
Q/D-Lys: 9
Q/D-Lys: 10
B'
300 330 360 390 420 450
0
200
400
600
800
1000
Fluorescence Intensity
wavelength (nm)
DMSO: 70%
DMSO: 50%
DMSO: 30%
DMSO: 10%
DMSO: 0%
A''
300 330 360 390 420 450
0
100
200
300
400
500
600
wavelength (nm)
Q/D-Mb: 0
Q/D-Mb: 1
Q/D-Mb: 2
Q/D-Mb: 3
Q/D-Mb: 4
Q/D-Mb: 5
Q/D-Mb: 6
Q/D-Mb: 7
Q/D-Mb: 8
Q/D-Mb: 9
Q/D-Mb: 10
B''
300 330 360 390 420 450 480
0
200
400
600
800
Fluorescence intensity
DMSO: 70%
DMSO: 50%
DMSO: 30%
DMSO: 10%
DMSO: 0%
A
300 330 360 390 420 450 480
0
200
400
600
800
Q/D-BSA: 0
Q/D-BSA: 1
Q/D-BSA: 2
Q/D-BSA: 3
Q/D-BSA: 4
Q/D-BSA: 5
Q/D-BSA: 6
Q/D-BSA: 7
Q/D-BSA: 8
Q/D-BSA: 9
Q/D-BSA: 10
B
Figure 13 Fluorescence emission spectra of BSA, Ly s, and
Mbsystem. The concentration of (A and B) BSA, (A ’ and B’) Lys, or
(A’’ and B’’) Mb was 1.5 × 10
-5
mol/L. (A), (A’), and (A’’) Effects of
DMSO at 27°C. (B), (B’), and (B’’) Effects of Q at 27°C. DMSO was
maintained at 10%.
Fang et al. Journal of Nanobiotechnology 2011, 9:19
/>Page 7 of 14
as the binding constant ; and [Q] is the concentration of
Q. When the concentration of Q is very low, the bind-
ing co nstant K
a
, which is equivalent to the equilibrium
constant K, was calculated at certain e xperimental tem-
peratures (27 and 37°C). The variation o f the binding
enthalpy ΔH,whichwasassumedtonotchangewith
the temperature, was calculated usingthe classical Van’t
Hoff equation (Eq. 2):
ln
K
2
K
1
= −
H
R
1
T
2
−
1
T
1
(2)
Where T is the temperature and R the ideal gas con-
stant. The binding free energy ΔG was calculated using
Eq. 3:
G
= −RT ln
K
(3)
G
= H − T
S
(4)
The variation of the binding entropy ΔS was calcu-
lated with Eq. 4, and the results are summarized in
Table 6 [44-46].
The negative ΔG indicates that the binding of Q and
Trp was en ergetically favourable. The positive ΔS and
ΔH indicates that the binding reactions increased the
ent ropy of the molecular environment of Trp, and were
endothermic. This kind of reaction is typically hydro-
phobic [47]. Six Trp residues are contained in one Lys
polypeptide backbone, but only two are contained in
BSA or Mb. Although the precise binding location of
each Q molecule is yet unknown , the lower entropy
values of the BSA and Mb systems indicate that the dis-
tribution of Q around Trp residues was more conver-
gent. The higher entropy in the Lys system indicates
that the distribution of Q was more scattered, caused
perhaps by too many Trp residues. This understanding
is illustrated in Figure 14.
UV-Vis Spectroscopy
Figure 15 compares the UV-Vis absorption spectra of Q,
D-BSA-Q (A), D-BSA-Q ( B), and D-Mb-Q ( C). The
pure Q showed its characteristic band at 367 nm, which
is associated with the cinnamoyl group [16]. Normally,
the formation of H-bonds between the chromophoric
group of Q and auxochromic group can result in an
obvious red shift [48-50]; this was found when Q was
mixed with BSA (A). No shift of this band was found
when Q was mixed with Lys (B)orMb(C), indicating
no H-bonds formed between Q and the two proteins.
Thus, the quantity of Q bound to Lys and Mb was
probably less than that bound to BSA.
Binding and Release Capacity of Proteins
Figure 16 compares the Q binding capacities of BSA,
Lys, and Mb molecules by means of salting-out. The
quantities of the bound Q increased with increasing
ratio of Q and protein (Q/D-Pro), reaching saturated
values (7 for Lys, 9 for Mb, and 11 for BSA) at Q/D-Pro
ratios exceeding 16. Thus, one Lys molecule could bind
7 Q molecules, one Mb molecule could bind 9, and one
BSA molecule could bind 11. The binding capacity of
BSA was confirmed to be the highest. Obviously, H-
bonds contributed to the enhanced binding capacity of
BSA. In addition, the higher molecular weight (MW) of
BSA increased the possibility of surface contact be tween
the protein and Q and favored the hydrophobic effects.
Figure 17 compares the quantity of oxidized Q in the
system, without or with proteins, in a cidic and neutral
conditions (A), and shows the enlarged part of the
curves at pH 7.4 during the first 24 h of reac tion (B). Q
was rapidly auto-oxidized by O
2
in water to form o-qui-
none/ quinone methide [13,51-53]. Since only the free Q
could be easily oxidized, the curves in Figure 17 are
equivalent to the curves of the release capacity of the
proteins. Q was relatively stable in acidic conditions,
and no oxidation was observed during the first 96 h of
the reaction. BSA, Lys, and Mb administration extended
the steady state to 120 h. In neutral conditions, Q
became very unstable. In Figure 17B, more than 90% of
the Q in the system without protein rapidly oxidized
during the first 24 h of the reaction. Evidently, the
kinetics of oxidation was greatly reduced by the BSA
nanocarrier, i.e., less than 10% of the Q was oxidized
during the first 24 h of reaction, and less than 70% of
the Q was oxidized at 216 h. This protection was not
provided by the Lys and Mb nanocarriers.
Antioxidant Activity of Quercetin
DPPH and ABTS radical cation decolourization tests are
spectrophotometric methods widely used to assess the
antioxidant activity of various substances. Previous stu-
dies confirmed that Q has a high DPPH and ABTS anti-
oxidant activity [54-56]. The present study compares the
antioxidant activity of Q and embedded Q in BSA, Lys,
and Mb nanocarriers. As shown in Figure 18A, the
DPPH percent radical scavenging activity (% RSC) o f Q
was 82%, while the DPPH % RSC of all embedded Q did
Table 6 Binding parameters between Q and the three
proteins
Pro. Temp.(°C) K
a
(L/mol) ΔG (kJ/mol) ΔH (kJ/mol) ΔS (J/mol·K)
BSA 27 7.34 × 10
4
-27.94 5.88 112.80
37 7.92 × 10
4
-29.07
Lys 27 2.93 × 10
4
-25.65 12.40 126.90
37 3.44 × 10
4
-26.92
Mb 27 3.72 × 10
4
-26.25 8.08 114.50
37 4.13 × 10
4
-27.39
Fang et al. Journal of Nanobiotechnology 2011, 9:19
/>Page 8 of 14
not change (P < 0.05) at all. Likewise, the ABTS % RSC
of Q was 67.06%, while the ABTS % R SC of embedded
Q in Lys and Mb nanocarriers did not change (P <
0.05); only the ABTS % RSC of embedded Q in the BSA
nanocarriers decreased (P < 0.05) in comparison with
free Q. This decrease , however, was so slight that it
could be ignored (Figure 18B). Thus, antioxidant activity
of Q was not interfered by protein nanoparticles.
Comparing the results acquired from the BSA, Lys,
and Mb systems, BSA exhibited the best functional fea-
tures, such as loading, controlled release, and particu-
larly antioxidant protection of active drugs. Other
commercially available flavonoids, such as ka empferol
and rutin, were also investigated in order to produce a
more general statement and conclusive study of such
bionanoparticles. Similar to Q, the thermodynamic, i.e.,
ΔG, values of kaempferol and r utin were n egative (both
about -30 kJ/mol), and their ΔH and ΔS were positive
(about 6 kJ/mol and 113 J/mol·K for kaempferol, 13 kJ/mol
and 130 J/mol·K for rutin, respectively), indicating that
these substances could be hydrophobically loaded by BSA
since the size of the bionanosystem is less than 30 nm.
One BSA could bind 12 kaempferl molecules and 5 rutin
molecules. The main features of the oxidation kinetics of
BSA
Lys
Mb
Trp residue
Quercetin
Helix region
Non helix region
Internal hydrophobic part
Outer hydrophilic part
BSA
Lys
Mb
Trp residue
Quercetin
Helix region
Non helix region
Internal hydrophobic part
Outer hydrophilic part
Figure 14 Schematic thermodynamics of binding Q on different proteins. Interpretation of the figure is provided in the text.
300 350 400 450 500
0.0
0.1
0.2
0.3
Abs
wavelength (nm)
A
300 350 400 450 500
0.0
0.1
0.2
0.3
0.4
Abs
wavelength (nm)
B
300 350 400 450 500
0.0
0.1
0.2
0.3
0.4
Abs
wavelength (nm)
C
Figure 15 UV-Vis spectra of free and bound Q to D-BSA, D-Lys, and D-Mb. The concentration of Q was 1.5 × 10
-5
mol/L. The concentration
of DMSO was maintained at 10%. The concentration of (A) BSA, (B) Lys, or (C) Mb was 1.5 × 10
-5
mol/L. The solid line represents free Q, and the
dashed line represents bound Q.
Fang et al. Journal of Nanobiotechnology 2011, 9:19
/>Page 9 of 14
kaempferol and rutin in the BSA system were very similar
to those of Q under the same conditions.
Conclusions
In this work, we demonstrated that pro teins, such as
BSA, Lys, and Mb be used to fabricate bioactive nano-
particles resulting from the secondary and tertiary
structure transformations promoted by DMSO to deliver
hydrophobic drugs such as Q. The adsorption of Q on
proteins was mainly hydro phobic, particularly occurring
in the region of Trp residues. BSA exhibited the highest
binding capacity of Q, indicating that H-bonding and
MWs also contribute to enhan cing binding capacity.
The formation of a hydrophobic core s urrounded by a
hyd rophilic outer layer was therefore promoted. Protein
nanocarriers can not only transport Q molecules, they
also provide a protective effect on the activity of Q in
both acidic and neutral conditions. The antioxidant
activity of Q was also preserved by entrapment by the
nanocarrier. Through the formation of complex a ggre-
gates composed of proteins, especially the BSA system,
DMSO, and Q, such bio-nanoparticles with improved
properties could be potentially efficient drug-carriers.
Confirmed by further studies on kaempferol and rutin,
this approach of protein nanoparticle preparation may
provide a general and conclusive way to deliver hydro-
phobic drugs.
Methods
Materials
BSA (Fraction V) (A-0332) was purchased from
AMRESCO(AmrescoInc.,OH,USA);itsMWwas67,
200 Da, and its purity was 98%. Myoglob in (Mb, M0630)
waspurchasedfromSigmaAldrich,Inc.(St.Louis,MO,
USA); its MW was 17, 800, and its purity was > 95%.
Lysozyme (Lys) was purchased from Sanland Chemical
Co. (LTD, LA, USA); its MW was 14, 400 Da. The iso-
electric point (pI) of Lys in this work was about 7.0 as
determined by zeta potential measurements. The stock
solutions of BSA, Lys, and Mb (1.5 × 10
-3
mol/L) were
prepared with Milli-Q water and stored in the refrigera-
tor at 4°C prio r to use. 1-Diphenyl-2-picrylhydrazyl
0 5 10 15 20
0
2
4
6
8
10
12
Q
b
(mol/ 1 mol Pro)
Q/D-Pro
Figure 16 The Q binding capacities of BSA, Lys, and Mb.Q
b
represents the quantity of Q bound to protein molecule. The
concentration of BSA, Lys, or Mb was all maintained at 1.5 × 10
-5
mol/L, and the concentration of DMSO was maintained at 10%.
Black square refers to BSA NP; black upper triangle refers to Lys NP;
black lower triangle refers to Mb NP.
0 5 10 15 20 25
0
20
40
60
80
100
% Oxidized
Time (h)
B
0 50 100 150 200
0
20
40
60
80
100
% Oxidized
A
Figure 17 Comparison of the quantity of the oxidized Q in the
system without or with protein. The concentrations of Q and
protein (BSA, Lys, and Mb) were 1.5 × 10
-4
and 1.5 × 10
-5
mol/L,
respectively. Q solution was prepared with 10% DMSO. (A)
Measurements during 216 hours. (B) Measurements during the first
24 hours at pH 7.4. Black square refers to Q without protein at pH
1.2; balck rhombus refers to Q with BSA at pH 1.2; black upper
triangle refers to Q with Lys at pH 1.2; black lower triangle refers to
Q with Mb at pH 1.2; white square refers to Q without protein at
pH 7.4; white rhombus refers to Q with BSA at pH 7.4; white upper
triangle refers to Q with Lys at pH 7.4; white lower triangle refers to
Q with Mb at pH 7.4.
Q D-BSA-QD-Lys-Q D-Mb-Q
0
20
40
60
80
100
a
a
a
a
DPPH RSC (%)
a
Q D-BSA-QD-Lys-Q D-Mb-Q
0
20
40
60
80
b
a
a
ABTS RSC (%)
AB
Figure 18 DPPH and ABTS scavenging activity of Q and
embedded Q. The concentrations of Q was 1.50 × 10
-5
mol/L. The
concentration of the proteins (BSA, Lys, and Mb) was 1.5 × 10
-6
mol/L. The (A) DPPH and (B) ABTS scavenging activities of the
proteins were also subtracted from the embedded Q. Markers of
different letters in the figure denote that the mean difference is
significant at P < 0.05.
Fang et al. Journal of Nanobiotechnology 2011, 9:19
/>Page 10 of 14
(DPPH, D9132-1G), 2,2’-azinobis (3-ethylbenzothiazo-
line-6-sulfonic acid) diammonium salt (ABTS, A-1888),
and dimethyl sulfoxide (DMSO) were all purchased from
SigmaAldrich,Inc.(St.Louis,MO,USA).Thepurityof
DMSO was 99.5%. Quercetin (3,3’,4’,5,7-pentahydroxyfla-
vone hydrate, Q-100081) was purchased from the
National Institute for the Control of Pharmaceutical and
Biological Products (Beijing, China); its puri ty was 97.3%,
as detected by high performance liquid chromatography.
The stock solution of Q (1.5 × 10
-3
mol/L) was prepared
with DMSO, and stored in the refrigerator at 4°C prior to
use. All other reagents used were of analytical grade or
purer.
Preparation of DMSO-inducing protein nanoparticle (D-
BSA, D-Lys, and D-Mb)
BSA, Lys, and Mb stock solutions (1.5 × 10
-3
mol/L) were
diluted to 1.5 × 1 0
-5
mol/L; various volumes of DMSO
were added. The total v olume of the solution was kept at
10 mL, and the concentrations of DMSO were 1%, 10%,
20%, 30%, 40%, 50%, 60%, and 70%. The solution was
mixed thoroughly for 5 min. Freeze-drying was used to
remove DMSO [57] and obtain the nanoparticles.
Preparation of Quercetin-loaded protein nanoparticle (D-
BSA-Q, D-Lys-Q, and D-Mb-Q)
BSA, Lys, and Mb stock solutions (1.5 × 10
-3
mol/L)
were diluted to 1.5 × 10
-5
mol/L, and various volumes
of Q were added. The total volume of the solution was
kept at 10 mL, and the concentration of DMSO was
kept at 10%; the concentration of Q was adjusted from
1.5 × 10
-5
to 1.5 × 10
-4
mol/L. The solution was mixed
thoroughly for 5 min. Freeze-drying was used to remove
DMSO [57] and obtain the nanoparticles.
Scanning Transmission Electron Microscopy (STEM)
Ten microliter samples were deposited onto a copper
TEM grid for 5 s, after which the excess solut ion s were
absorbed. Phosphotungstic acid was used to stain the
sample. The observations were performed with a HITA-
CHIS-5500 STEM (Hitachi High-Technolo gies America,
Inc. IL, USA) at 30 KV. Images (1280 × 960 pixels) were
acquired using a Gatan high-angle annular bright field
(HAABF) scintillating detector.
Dynamic Light Scattering (DLS) Measurements
Hydrodynamic sizes and zeta potentials were determined
by means of photon correlation spectroscopy using a
Delsa Nano Particle Analyzer (A53878, Beckman Coulter,
Inc., CA, USA). The size measurements were performed
at 25°C and at a 1 5° scattering angle. Size was recorded
for 400 μs for each measurement, and the accumulation
time was 3 times. In dynamic light scattering, when the
hydrodynamic size was measured, the fluctuations in the
time of scattered light from particles in Brownian motion
were measured. The zeta potential measurements were
performed at 25°C. The accumulation time was 70 times,
and equilibration time was 60 sec.
Raman Spectroscopy Measurements
The solution samples were prepared as in the section on
sample preparation. Raman spe ctral data were collected
with a HORIBA Jobin Yvon HR800 spectrometer (HOR-
IBA J obin Yvon S.A.S., Villeneuve Dáscq, France), wit h
785 nm excitation. Spectral differences were recorded in
the 400- 2000 cm
-1
wave-number range. To increase the
signal-to-noise ratio, at least 10 scans of each sample
were collected to obtain averaged spectral data. The
averaged spectral were baseline-corrected, and smoothed
using ORIGIN software (version 8.0). The relative inten-
sities were no rmalized to the pheny lalanine band at
1002 or 1008 cm
-1
.
Fluorescence Spectrometry Measurements
The f luorescence intensities were recorded with a Cary
Eclipse fluorophotometer (Varian, Inc., CA, USA). The
widths of the excitation and emission slits of BSA, Lys,
and Mb were set to 2.5/5.0, 5.0/5.0, and 10. 0/20.0 nm,
respectively. All the operations were carried out at 27
and 37°C. Fluorescence spectra were then measured in
the range of 200-500 nm at an excitation wavelength of
280 nm. Each spectrum was background-corrected by
subtracting the spectrum of the Milli-Q water and
DMSO blank.
UV-Vis Spectrometry Measurements
All the samples were scanned on a Varian Cary 50 UV -
visible spectrophotometer (Varian Medical Systems, Inc.,
CA, USA) at wavelength range of 300-500 nm. The
operations were carried out at room temperature, 25°C.
The scan rate was 600.00 nm/min. The data interval
was 1.00 nm, and the average time was 0.10 sec. All the
absorptions of the protein (BSA, Lys, and Mb) were
near 280 nm. In the case of Mb, another weak absorp-
tion appeared at 420 nm.
Determination of Quercetin Loading Capacity (Salting Out
Analysis)
The Q entrapped by nanocarriers was separated from
the free Q through the salting out method as described
below. A 5 mL sample was placed i n a be aker. Excess
ammonium sulphate was added to the beaker, and the
mixture was stirred for 10 min and then left to stand
for 20 min. A 2 mL solution was transferred to a centri-
fuge tube, and then centrifuged for 30 min at 15,000
rpm, at 4°C. The absorbance (Abs) of free Q in superna-
tantwasdetectedat367nmbyaVarianCary50UV-
Vis spectrophotometer (Varian Medical Systems, Inc.,
Fang et al. Journal of Nanobiotechnology 2011, 9:19
/>Page 11 of 14
CA, USA), and the concentration of free Q was calcu-
lated by the standard curve method. The entrapped Q
was calculated by determining all the Q in a sample and
then subtracting the free Q. All measurements were per-
formed in triplicate.
Quercetin Stability and Release Study In Vitro (UV-Vis
Spectrometry Analysis)
The pH conditions of the release buffer were controlled
using phosphate bu ffer (pH 7.4) or HCl (pH 1.2). The
experiment was carried out using an improved method
of Arnedo [8] as described belo w. A 90 mL sample was
separa ted into 30 tubes, placed in an incubato r at 37°C,
and then wagged at 100 rpm. The tubes were succes-
sively detected at predetermined intervals by mea ns of
UV-Vis spectrometry. All measurements were per-
formed in triplicate.
Antioxidant Activity Evaluation
DPPH Assay
The DPPH a ssay was used to evaluate the free radical
scavenging activity on the DPPH• of each sample. When
DPPH• reacted with an antioxidant compound, the
DPPH was reduced. The change in color was measured
at 517 nm. The DPPH free radical scavenging activity
was determine d by the method of Hao [58]. Stock solu-
tions of DPPH were prepar ed at 2.5 mmol/L, and then
diluted to 0.15 mmol/L. Each sample (15 μL) was mixed
with 0.05 mol/L (pH 7.4) of Tris-HCl buffer (60 μL) and
0.15 mmol/L DPPH working solution (150 μL) in a 96-
well plate. The mixture was shaken vigorously, and then
left to stand for 30 min in the dark. The absorbance
(A
Sample
) at 517 nm was recorded using a microplate
reader (Model 680, Bio-Rad Laboratories, Inc., CA,
USA). All the samples were analyzed in triplicate. The
absorbance of the control (A
Control
) was obtained by
replacing the sample with ethanol. The percent radical
scavenging activity (% RSC) was calculated using the
formula shown below:
%RSC =
A
Control
− A
Sample
/A
Control
× 100
%
(5)
ABTS Assay
The ABTS radical cation decolorization test is a spectro-
photometric method widely used for the assessment of
antioxidant activity of various substances. The experi-
ment was carried out by the method of Re [59]. In brief,
140 mmol/L ABTS stock solution was diluted in water
to a concentration of 14 mM. A mixture of 500 μL14
mM ABTS diluent and 500 μL 4.9 mM pot assium per-
sulfate (KPS) stock solution was placed in a 1.5 mL
tube, and then left to stand in the dark at room tem-
perature for at least 12 h before use. To study the
samples, the ABTS· solution was diluted with the sample
buffer to an absorbance of 0.70 ± 0.02 at 734 nm. After the
addition of 900 μL of diluted ABTS· solution to 100 μLof
sample, the absorbance (A
Sample
) reading was taken af ter
exactly 4 min. A sample buffer blank (A
Control
) was run in
each assay. All determinations were carried out in tripli-
cate. The percent radical scavenging activity (% RSC) was
calculated usi ng Eq. 5.
Additional material
Additional file 1: Fitting results of the different modes on the
experimental data. The concentration of BSA (A and B), Lys (A’ and B’),
or Mb (A’’ and B’’) were 1.5 × 10
-5
mol/L. (A), (A’), and (A’’) Comparison
of the fitting results of the dynamic, static and simultaneous modes at
27°C. The concentration of Q varied from 0 to 1.2 × 10
-5
mol/L. Black
square refers to experimental data; dot line refers to the dynamic mode;
dash line refers to the static mode; solid line refers to the simultaneous
mode. (B), (B’), and (B’’) Comparison of the fitting results at 27 and 37°C.
Black square refers to 27°C and black round refers to 37°C.
Acknowledgements
This research was supported by the National Scienceand Technology
Support Program (No. 2011BAD23B04). Prof. Yunjie Yan (Beijing National
Center for Electron Microscopy, Department of Materials Science and
Engineering, Tsinghua University), Prof. Wei Qi (Chemical Engineering
Research Center, School of Chemical Engingeering and Technology, Tianjin
University, Tianjin, China), Engr. Ke Zhu (Institute of Physics, Chinese
Academy of Sciences, Beijing, China), and Dr. Yanhong Liu (Technical
Institute of Physics and Chemistry, Chinese Academy of Sciences, Beijing,
China) are acknowledged for their technical advice.
Author details
1
CAU and ACC Joint Laboratory of Space Food, College of Food Science and
Nutritional Engineering, China Agricultural University, Key Laboratory of
Functional Dairy Science of Beijing and the Ministry of Education, Beijing
Higher Institution Engineering Research Center of Animal Product, No.17
Qinghua East Road, Haidian, Beijing 100083, China.
2
Groupe de Physico-
Chimie de L’Environnement, Institut Forel, Section des Sciences de la Terre
et de l’Environnement, Université de Genève, 10, route de Suisse, CH-1290
Versoix, Switzerland.
Authors’ contributions
XJL, HJ, and RF coordinated the experiments, and provided important advice
for each. RF performed the majority of the experiments and characterization.
ZC, SS, GHZ, FZR, and FL participated in the characterization. All authors
read, participated in writing, and approved of the final manuscript.
Competing interests
The authors declare that they have no competing interests.
Received: 27 January 2011 Accepted: 17 May 2011
Published: 17 May 2011
References
1. Lewinski N, Colvin V, Drezek R: Cytotoxicity of nanoparticles. Small 2008,
4:26-49.
2. Liu J, Huang W, Pang Y, Zhu X, Zhou Y, Yan D: The in vitro
biocompatibility of self-assembled hyperbranched copolyphosphate
nanocarriers. Biomaterials 2010, 31:5643-5651.
3. Shieh M, Peng C, Chiang W, Wang C, Hsu C, Wang S, Lai P: Reduced Skin
Photosensitivity with meta-Tetra (hydroxyphenyl) chlorin-Loaded
Micelles Based on a Poly (2-ethyl-2-oxazoline)-b-poly (d, l-lactide)
Diblock Copolymer in Vivo. Mol Pharm 2010, 7:1244-1253.
Fang et al. Journal of Nanobiotechnology 2011, 9:19
/>Page 12 of 14
4. Li Y, Xiao K, Luo J, Lee J, Pan S, Lam K: A novel size-tunable nanocarrier
system for targeted anticancer drug delivery. J Control Release 2010,
144:314-323.
5. MaHam A, Tang Z, Wu H, Wang J, Lin Y: Protein-based nanomedicine
platforms for drug delivery. Small 2009, 5:1706-1721.
6. Wang G, Uludag H: Recent developments in nanoparticle-based drug
delivery and targeting systems with emphasis on protein-based
nanoparticles. Expert Opin Drug Deliv 2008, 5:499-515.
7. Jahanshahi M, Najafpour G, Rahimnejad M: Applying the Taguchi method
for optimized fabrication of bovine serum albumin (BSA) nanoparticles
as drug delivery vehicles. Afr J Biotechnol 2008, 7:362-367.
8. Arnedo A, Espuelas S, Irache J: Albumin nanoparticles as carriers for a
phosphodiester oligonucleotide. Int J Pharm 2002, 244:59-72.
9. Maghsoudi A, Shojaosadati S, Vasheghani Farahani E: 5-Fluorouracil-Loaded
BSA Nanoparticles: Formulation Optimization and In Vitro Release Study.
AAPS Pharm Sci Tech 2008, 9:1092-1096.
10. Ascenzi P, Bocedi A, Notari S, Fanali G, Fesce R, Fasano M: Allosteric
modulation of drug binding to human serum albumin. Mini Rev Med
Chem 2006, 6:483-489.
11. Ascoli G, Domenici E, Bertucci C: Drug binding to human serum albumin:
Abridged review of results obtained with high-performance liquid
chromatography and circular dichroism. Chirality 2006, 18:667-679.
12. Di Carlo G, Mascolo N, Izzo A, Capasso F: Flavonoids: old and new aspects
of a class of natural therapeutic drugs. Life Sci 1999, 65:337-353.
13. van der Woude H, Gliszczyska-wigo A, Struijs K, Smeets A, Alink G, Rietjens I:
Biphasic modulation of cell proliferation by quercetin at concentrations
physiologically relevant in humans. Cancer lett 2003, 200:41-47.
14. Bhattacharjya S, Balaram P: Effects of organic solvents on protein
structures: observation of a structured helical core in hen egg-white
lysozyme in aqueous dimethylsulfoxide. Proteins 1997, 29:492-507.
15. Dufour C, Dangles O: Flavonoid-serum albumin complexation:
determination of binding constants and binding sites by fluorescence
spectroscopy. Biochim Biophys Acta 2005, 1721:164-173.
16. Ni Y, Zhang X, Kokot S: Spectrometric and voltammetric studies of the
interaction between quercetin and bovine serum albumin using
warfarin as site marker with the aid of chemometrics. Spectrochim Acta A
Mol Biomol Spectrosc 2009, 71:1865-1872.
17. Fasano M, Curry S, Terreno E, Galliano M, Fanali G, Narciso P, Notari S,
Ascenzi P: The extraordinary ligand binding properties of human serum
albumin. IUBMB life 2005, 57:787-796.
18. Jóhannesson H, Denisov V, Halle B: Dimethyl sulfoxide binding to globular
proteins: A nuclear magnetic relaxation dispersion study. Protein
Sci 1997,
6:1756-1763.
19.
Paramaguru G, Kathiravan A, Selvaraj S, Venuvanalingam P, Renganathan R:
Interaction of anthraquinone dyes with lysozyme: Evidences from
spectroscopic and docking studies. J Hazard Mater 2009, 175:985-991.
20. Li D, Cao X, Ji B: Spectrophotometric studies on the interaction between
myricetin and lysozyme in the absence and presence of Cu
2+
or Fe
3+
. J
Lumin 2010, 130:1893-1900.
21. Iafisco M, Palazzo B, Falini G, Di Foggia M, Bonora S, Nicolis S, Casella L,
Roveri N: Adsorption and conformational change of myoglobin on
biomimetic hydroxyapatite nanocrystals functionalized with alendronate.
Langmuir 2008, 24:4924-4930.
22. Feng M, Tachikawa H: Raman spectroscopic and electrochemical
characterization of myoglobin thin film: implication of the role of
histidine 64 for fast heterogeneous electron transfer. J Am Chem Soc
2001, 123:3013-3020.
23. Li Q, Mabrouk P: Spectroscopic and electrochemical studies of horse
myoglobin in dimethyl sulfoxide. J Biol Inorg Chem 2003, 8:83-94.
24. Matsuda Y, Kobayashi M, Annaka M, Ishihara K, Takahara A: Dimensions of
a free linear polymer and polymer immobilized on silica nanoparticles
of a zwitterionic polymer in aqueous solutions with various ionic
strengths. Langmuir 2008, 24:8772-8778.
25. Trirongjitmoah S, Sakurai T, Iinaga K, Chiba H, Shimizu K: Fraction
estimation of small, dense LDL using autocorrelation function of
dynamic light scattering. Opt Express 2010, 18:6315-6326.
26. Chen M, Lord R: Laser-excited Raman spectroscopy of biomolecules. VIII.
Conformational study of bovine serum albumin. J Am Chem Soc 1976,
98:990-992.
27. Liang M, Chen V, Chen H, Chen W: A simple and direct isolation of whey
components from raw milk by gel filtration chromatography and
structural characterization by Fourier transform Raman spectroscopy.
Talanta 2006, 69:1269-1277.
28. Ou W, Wang R, Zhou H: Conformational changes and inactivation of
rabbit muscle creatine kinase in dimethyl sulfoxide solutions. Biochem
Cell Biol 2002, 80:427-434.
29. Jurasekova Z, Marconi G, Sanchez-Cortes S, Torreggiani A: Spectroscopic
and molecular modeling studies on the binding of the flavonoid
luteolin and human serum albumin. Biopolymers 2009, 91:917-927.
30. Aliaga A, Osorio-Román I, Leyton P, Garrido C, Cárcamo J, Caniulef C,
Célis F, Díaz F: Surface-enhanced Raman scattering study of L-
tryptophan. J Raman Spectrosc 2009, 40:164-169.
31. Zhao W, Yang R: Experimental Study on Conformational Changes of
Lysozyme in Solution Induced by Pulsed Electric Field and Thermal
Stresses. J Phys Chem B 2009, 114:503-510.
32. Mi kovsky P, Jancura D, Sánchez-Cortés S, Kociová E, Chinsky L:
Antiretrovirally active drug hypericin binds the IIA subdomain of human
serum albumin: Resonance Raman and surface-enhanced Raman
spectroscopy study. J Am Chem Soc 1998, 120:6374-6379.
33. Miura T, Takeuchi H, Harada I: Raman spectroscopic characterization of
tryptophan side chains in lysozyme bound to inhibitors: role of the
hydrophobic box in the enzymic function. Biochemistry 1991,
30:6074-6080.
34. Miura T, Suzuki K, Takeuchi H:
Binding of iron (III) to the single tyrosine
residue
of
amyloid [beta]-peptide probed by Raman spectroscopy. J Mol
Struct 2001, 598:79-84.
35. Badii F, Howell N: Fish gelatin: structure, gelling properties and
interaction with egg albumen proteins. Food Hydrocolloid 2006,
20:630-640.
36. Lehninger A, Nelson D, Cox M: Lehninger principles of biochemistry. Wh
Freeman 2005.
37. Bellezza F, Cipiciani A, Latterini L, Posati T, Sassi P: Structure and Catalytic
Behavior of Myoglobin Adsorbed onto Nanosized Hydrotalcites.
Langmuir 2009, 25:10918-10924.
38. Morgan C, Miranker A, Dobson C: Characterization of Collapsed States in
the Early Stages of the Refolding of Hen Lysozyme. Biochemistry 1998,
37:8473-8480.
39. Itzhaki L, Evans P, Dobson C, Radford S: Tertiary interactions in the folding
pathway of hen lysozyme: kinetic studies using fluorescent probes.
Biochemistry 1994, 33:5212-5220.
40. Ibrahim H, Higashiguchi S, Juneja L, Kim M, Yamamotos T: A structural
phase of heat-denatured lysozyme with novel antimicrobial action.
J Agric Food Chem 1996, 44:1416-1423.
41. Liu H, Yin P, He S, Sun Z, Tao Y, Huang Y, Zhuang H, Zhang G, Wei S: ATP-
induced noncooperative thermal unfolding of hen lysozyme. Biochem
Biophys Res Commun 2010, 397:598-602.
42. Lakowicz J: Principles of Fluorescence Spectroscopy. New York: Springer
press; 2006.
43. Valeur B: Molecular Fluorescence: Principles and Applications. Weinheim:
Wiley-Vch press; 2001.
44. Bai Z, Lodge T: Thermodynamics and Mechanism of the Block
Copolymer Micelle Shuttle between Water and an Ionic Liquid. J Phys
Chem B 2009, 113:14151-14157.
45. Bansiwal A, Thakre D, Labhshetwar N, Meshram S, Rayalu S: Fluoride
removal using lanthanum incorporated chitosan beads. Colloids Surf B
Biointerfaces 2009, 74:216-224.
46. Subbaiah M, Vijaya Y, Kumar N, Reddy A, Krishnaiah A: Biosorption of
nickel from aqueous solutions by Acacia leucocephala bark: Kinetics and
equilibrium studies. Colloids Surf B Biointerfaces 2009, 74:260-265.
47. Ross P, Subramanian S: Thermodynamics of protein association reactions:
forces contributing to stability. Biochemistry 1981, 20:3096-3102.
48. Schenning A, Herrikhuyzen J, Jonkheijm P, Chen Z, Würthner F, Meijer E:
Photoinduced Electron Transfer in Hydrogen-Bonded Oligo (p-
phenylene vinylene)- Perylene Bisimide Chiral Assemblies. J Am Chem
Soc 2002, 124:10252-10253.
49. Bell T, Hext N: Supramolecular optical chemosensors for organic analytes.
Chem Soc Rev 2004, 33:589-598.
50.
Würthner
F, Chen Z, Hoeben F, Osswald P, You C, Jonkheijm P,
Herrikhuyzen J, Schenning A, van der Schoot P, Meijer E: Supramolecular
p- n-Heterojunctions by Co-Self-Organization of Oligo (p-phenylene
Vinylene) and Perylene Bisimide Dyes. J Am Chem Soc 2004,
126:10611-10618.
Fang et al. Journal of Nanobiotechnology 2011, 9:19
/>Page 13 of 14
51. Zheng Y, Haworth I, Zuo Z, Chow M, Chow A: Physicochemical and
structural characterization of Quercetin-β-Cyclodextrin Complexes. J
Pharm Sci 2005, 94:1079-1089.
52. Makris D, Rossiter J: Heat-induced, metal-catalyzed oxidative degradation
of quercetin and rutin (quercetin 3-O-rhamnosylglucoside) in aqueous
model systems. J Agric Food Chem 2000, 48:3830-3838.
53. Bermúdez-Soto M, Tomás-Barberán F, García-Conesa M: Stability of
polyphenols in chokeberry (Aronia melanocarpa) subjected to in vitro
gastric and pancreatic digestion. Food Chem 2007, 102:865-874.
54. Zhang J, Melton L, Adaim A, Skinner M: Cytoprotective effects of
polyphenolics on H
2
O
2
-induced cell death in SH-SY5Y cells in relation to
their antioxidant activities. Eur Food Res Technol A 2008, 228:123-131.
55. Ozgen M, Reese R, Tulio A Jr, Scheerens J, Miller A: Modified 2, 2-Azino-
bis-3-ethylbenzothiazoline-6-sulfonic Acid (ABTS) Method to Measure
Antioxidant Capacity of Selected Small Fruits and Comparison to Ferric
Reducing Antioxidant Power (FRAP) and 2, 2’-Diphenyl-1-picrylhydrazyl
(DPPH) Methods. J Agric Food Chem 2006, 54:1151-1157.
56. Kang W, Wang J: In vitro antioxidant properties and in vivo lowering
blood lipid of Forsythiasuspense leaves. Med Chem Res 2009, 19:617-628.
57. Pezeshki A, Vergote V, Van Dorpe S, Baert B, Burvenich C, Popkov A, De
Spiegeleer B: Adsorption of peptides at the sample drying step:
influence of solvent evaporation technique, vial material and solution
additive. J Pharm Biomed Anal 2009, 49:607-612.
58. Jing H, Kitts D: Antioxidant activity of sugar-lysine Maillard reaction
products in cell free and cell culture systems. Arch Biochem Biophys 2004,
429:154-163.
59. Re R, Pellegrini N, Proteggente A, Pannala A, Yang M, Rice-Evans C:
Antioxidant activity applying an improved ABTS radical cation
decolorization assay. Free Radic Biol Med 1999, 26:1231-1237.
doi:10.1186/1477-3155-9-19
Cite this article as: Fang et al.: Design and characterization of protein-
quercetin bioactive nanoparticles. Journal of Nanobiotechnology 2011
9:19.
Submit your next manuscript to BioMed Central
and take full advantage of:
• Convenient online submission
• Thorough peer review
• No space constraints or color figure charges
• Immediate publication on acceptance
• Inclusion in PubMed, CAS, Scopus and Google Scholar
• Research which is freely available for redistribution
Submit your manuscript at
www.biomedcentral.com/submit
Fang et al. Journal of Nanobiotechnology 2011, 9:19
/>Page 14 of 14