báo cáo khoa học: " On-chip constructive cell-Network study (I): Contribution of cardiac fibroblasts to cardiomyocyte beating synchronization and community effect" pdf
Bạn đang xem bản rút gọn của tài liệu. Xem và tải ngay bản đầy đủ của tài liệu tại đây (2.5 MB, 13 trang )
RESEARCH Open Access
On-chip constructive cell-Network study (I):
Contribution of cardiac fibroblasts to
cardiomyocyte beating synchronization and
community effect
Tomoyuki Kaneko, Fumimasa Nomura and Kenji Yasuda
*
Abstract
Backgrounds: To clarify the role of cardiac fibroblasts in beating synchronization, we have made simple lined-up
cardiomyocyte-fibroblast network model in an on-chip single-cell-based cultivation system.
Results: The synchronization phenomenon of two cardiomyocyte networks connected by fibroblasts showed (1)
propagation velocity of electrophysiological signals decreased a magnitude depending on the increasing number
of fibroblasts, not the lengths of fibroblasts; (2) fluctuation of interbeat intervals of the synchronized two
cardiomyocyte network connected by fibroblasts did not always decreased, and was opposite from homogeneous
cardiomyocyte networks; and (3) the synchronized cardiomyocytes connected by fibroblasts sometimes loses their
synchronized condition and recovered to synchronized condition, in which the length of asynchronized period was
shorter less than 30 beats and was independent to their cultivation time, whereas the length of synchronized
period increased according to cultivation time.
Conclusions: The results indicated that fibroblasts can connect cardiomyocytes electrically but do not significantly
enhance and contribute to beating interval stability and synchronization. This might also mean that an increase in
the number of fibroblasts in heart tissue reduces the cardiomyocyte ‘community effect’, which enhances
synchronization and stability of their beating rhythms.
Background
Cardiomyocytes make up more than half the v olume of
normalhearttissueandplayaroleinthepumpingof
bloo d. Most of the other, non-beating, cells in the heart
is the fibroblasts forming the cardiac skeleton and pro-
viding the mechanical scaffold for cardiomyocytes.
Fibroblasts are also more plentiful in diseased hearts
than healthy hearts, so one must consider the possibility
that electrical co upling between fibroblasts and cardio-
myocytes plays a role in arrhythmogenesis [1-3]. It has,
in fact, been shown in cell culture that the electrical
coupling of fibroblasts can propagate the contraction
among cardiomyocytes [4-7]. However, the conventional
in vitro experiments of cardiomyocyte-fibroblast
networks were examined by the randomly connec ted
cells in the cultivation dishes [8-10]. H ence it is difficult
to measure the time course change of particular cells
before/after connection formation. T o overcome this
problem, one of the ways is to use microstructures to
fix their positions, distances and interactions.
The principles of patterned growth of cultured cardio-
myocytes were pioneered in the early 70s, and in the
early 90s the introduction of photolithographic techni-
ques resulted in a method that could be used to define
the patterns of cardiomyocytes grown in primary culture
[11]. That method did not work well with fibroblasts,
however, because they tended to adhere and extend to
the photoresist, and hence the patterned structure could
not control the single-cell level control of their posi-
tions. Moreover, although the inter action of the hetero-
gen eous cell types was studied using this metho d, those
studies were done with clusters rather than isolated
* Correspondence:
Department of Biomedical Information, Division of Biosystems, Institute of
Biomaterials and Bioengineering, Tokyo Medical and Dental University,
Tokyo, 2-3-10 Kanda-Surugadai, Chiyoda, Tokyo 101-0062, Japan
Kaneko et al. Journal of Nanobiotechnology 2011, 9:21
/>© 2011 Kaneko et al; licensee BioMed Central Ltd. This is an Open Access article distributed under the terms of the Cre ative Commons
Attribution License ( nses/by/2.0), which permits unrestricted use, distribution, and reproduction in
any medium, provided the original work is properly cited.
single cells [5,12]. Hence, the measurement of electrical
coupling between fibroblasts and cardiomyocytes was
not considered as the single fibroblast’s electrical cou-
pling function. To overcome these problems, we devel-
oped an agarose microchamber system by using the
photothermal etching method [13,14]. This system ha s
been used to control the network patterning of neurons
[15-17] and to control the connections of cardiomyo-
cytes [18,19]. Using that system to examine the contri-
bution of t he ‘community effect’ to the stability of the
beating in the homogeneous cardiomyocyte networks
[20,21], we found that the beating of an in vitro commu-
nity (network) comprising nine cells is as stable as the
beating of the heart, that the rhythms of two isolated
cells became synchronized after the cells made physical
contact with each other, and that the synchronized
rhythm of those two cells was the more stable one
rather than the faster one [22]. We did not, however,
examine the role of the community effect in heteroge-
neous cell networks, especially in cardiomyocytes.
In this study, we have examined the single-cell-based
minimum heterogeneous network of cardiomy ocytes and
fibroblasts on a chip, measured the time course of
changes in the stability of the synchronization of two car-
diomyocytes connected by a fibroblast, analyzed the con-
tributions of cardiac fibroblasts to the sy nchronization of
cardiomyocyte beating, and discussed the effect of the
fibroblast population in heart tissue on the ‘community
effect’ of cardiomyocyte network synchronization.
Methods
Cardiomyocyte and cardiac fibroblast isolation and
culture
Embryonic mouse cardiomyocytes were isolated and
purified using a modified version of a method described
in Ref. [22]. All animal protocols and experiments were
approved by the Institutional Animal Care and Use
Committee of Tokyo Medical and Dental University
(Ethical Approval Number: 0110091A). In brief, the car-
diomyocytes were isolated from 13-to-14-day-old ICR
mouse embryos (Saitama Experimental Animals Supply,
Japan). After the embryos were rapidly removed from a
mouse anesthetized with diethyl ethe r, the hearts of the
embryos were removed and washed with phosphate-buf-
fered saline (PBS: 137 mM NaCl, 2.7 mM KCl, 8 mM
Na
2
HPO
4
, 1.5 mM KH
2
PO
4
, pH 7.4) containing 0.9 mM
CaCl
2
and 0.5 mM MgCl
2
to induce heart contraction
and remove corpuscles. The hearts were then trans-
ferred to PBS without CaCl
2
and MgCl
2
and the ventri-
cles were separated from the atria, minced into 1-mm
3
pieces with fine scissors, and incubated at 37°C for 30
minutes in PBS containing 0.25% collagena se (Wako,
Osaka, Japan) to digest the ventricular tissue. After this
procedure was repeated twice, the cell suspension was
transferred to Dulbecc o’s modified Eagle’smedium
(DMEM: Invitrogen, Carlsbad, CA, USA) supplemented
with 10% fetal bovine serum, 100 U/ml penicillin, and
100 μg/ml streptomycin at 4°C. The cells were filtered
through a 40-μm-nylon mesh and then cent rifuged at
180 g for 5 minutes at room temperature. After the cell
pellet was resuspended in a supplemented DMEM, 100
μl of the suspension (diluted to a final concentration of
1.0 × 10
5
cells/ml) was plat ed onto a 35-mm dish and
the individual cardiomyocyteswerepickeduponeby
one using a micropipette (Tip diameter: 20 μm) with
micromanipulation system (CellTramAir and Microma-
nipulator 5171 [Eppendorf, Hamburg, Germany]) and
put into the microchambers in the cultivation dish. Cell-
handling pipet tes (inner diameter: 0.03 mm) were fabri-
cated by pulling glass capill aries (outer diameter: 1 mm;
GD- 1, Narishige, Japan) with a puller (PC-10, Narishige
Japan), and cutting, and fire polishing the cut end of the
tubes with a microforge (MF-900, Narishige, Japan). The
inner and outer surfaces of cell-handling pipettes were
coated with sigmacote (SL-2; Sigma-Aldrich, MO, USA)
by evaporation at r oom temperature in order to prevent
cell adhesion onto the pipettes. For distinguishing target
cardiomyocytes, we have checked their smooth surfaces
and their sizes as indexes. Then, we cultivated the cells
in the microchambers and we chose the microchambers
in which two cardiomyocytes were successfully beating
in both of chambers for the further experiments.
The fibroblasts were identified by their fast cell division
and extension speed just after cultivation. Cardiac fibro-
blasts were obtained from the remaining cells after the
cardiomyocytes isolation procedure. The obtained cells
were cultured on a tissue-cultured dish more than 5 pas-
sages in supplemented DMEM. As the fibroblasts
increased and formed a monolayer on the dish, the num-
ber of cardiomyocytes in cultivated cells was substantially
decreased. Cardiac fibroblasts were harves ted with 0.25%
trypsin/ethylenediaminetetra aceti c acid (EDTA: Invitro-
gen, Carlsbad, CA, USA) and selected by their rough
shape and size after 20 min of suspension cultivation.
Using a micropipette, cardiac fibroblasts were picked up
and put into the chosen microchambers where both of
two cardiomyocytes was beating successfully.
Image analysis
The spontaneous contraction rhythm of cultured cardio-
myocytes was evaluated by a video-image recording
method as described previously[20-22].Briefly,images
of beatin g cardiomyocytes were acquired with a charge-
coupled device (CCD) camera attached to a phase con-
trast microscope, recorded by a video cassette recorder
(VCR), and analyzed using a video capture system on a
personal computer. From each image a small region
where intensity changed considerably with contraction
Kaneko et al. Journal of Nanobiotechnology 2011, 9:21
/>Page 2 of 13
was selected and the average signal intensity of the
selected area was d igitized by a personal computer.
Temporal variations of average signal intensity in the
selected area correspond to the contraction rhythm of
the cardiomyocytes.
Patch-clamp measurement
Double whole-cell patch-clamp recordings were
achieved with multiclamp 700B (Axon Instruments)
patch-clamp amplifier. T he transmembrane potential
was recorded using the whole cell recording mode of
the patch-clamp technique. Patch pipettes (6-7MΩ
resistance) were pulled from glass capillary tubes and
filled with pipette solution (in mM: 100 K-gluconate, 40
KCl, 4 Na-ATP, 1 M gCl2, 0.5 EDTA, and 5 HEPES,
with pH adjusted to 7.4 with KOH). The bath solution
contained (in mM) 145 NaCl, 4 KCl, 1 CaCl2, 1 MgCl2,
1 glucose, a nd 10 HEPES, with pH adjusted to 7.4 wit h
NaOH. For data acquisition and analysis Clampex9.2
software (Axon Instruments) was used. We measured
the time lag between two action potentials at 0 mV.
Statistics
Data are given as mean ± SD. Data sets were compared
usingtheStudentttest(2-tailed), and differences were
considered significant at P < 0.001.
Immunofluorescence staining
After the measurements, the preparations were washed
with PBS, fixed with 4% paraformaldehyde for 15 minutes
at room temperature, and permeabilized in 0.1% Triton
X-100 for 15 min. Thereafter, they were incubated at
room temperature for 1 hour with blocking b uffer (PBS
containing 1% BSA) before being exposed for 2 hours to
the primary antibodies (mouse monoclonal a ntibody to
heavy chain cardiac myosin, abcam, Tokyo, Japan, and
rabbit polyclonal antibody to connexin-43, Sigma-aldrich,
St. Louis, MO, USA) dissolved in blocking buffer. Finally,
the preparations were washed and incubated for 1 hour
at room temperature with secondary antibodies (Alexa
Fluor 488, goat anti-mouse IgG, and Alexa Fluor 546,
goat anti-rabbit IgG, Molecular probes, Eugene, OR,
USA). To visualize the nuclei, cells were counterstained
with Hoechst 33342 for 30 min at room temperature.
The preparations were imaged on an inverted microscope
equipped for epifluorescence (IX-70, Olympus, Tokyo,
Japan) using cooled CCD camera (ORCA-ER, Hama-
matsu photonics, Shizuoka, Japan).
Results and disc ussion
On-chip single-cell-based cell observation system using
an agarose microchamber
Agarose microchambers were made using a modified
version of a method described previously [13-22]. In
brief, the attachment of cardiomyocytes to the bottom
of the microchambers was improved by coating the 5-
nm chromium layer on a glass slide with type І col-
lagen (Nitta gelatin, Osaka, Japan) before depositing 50
μm of a 2% (w/v) agarose solution (ISC BioExpress,
GenePure LowMelt: melting temperature 65°C) on it
by spin coati ng at 4,000 rpm for 30 se c (Spincoater
1H-D7, Mikasa, Tokyo, Japan). After the agarose was
hardened into a gel by keeping the slide in a refrigera-
tor at 4 °C, a 1064-nm infrared laser beam (Nd: YAG
laser; PYL-1-1064-M, IPG Laser GmBH, Germany)
focused on the chromium layer was used to melt
three-microchamber linear arrays in the agarose layer.
Because the 1064-nm infrared laser beam is permeable
to water, thin stable chromium bottom layer was used
for absorption of the 1064-nm laser for further μm-
order spot heating of a portion of agarose layer to
form microstructures. A microscope observation was
used to confirm that the melting had occurred, and
then either the heating was continued until the micro-
chamber reached the desired size or the heating posi-
tion was shifted to create a channel connecting that
microchamber with an adjacent one (Figure 1(a)). As
the focused beam was moved, parallel t o the chip sur-
face, from one microchamber to another the agarose
adjacent to the h eated chromium melted and diffused
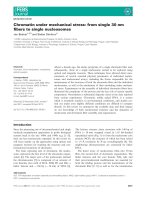
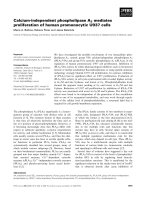
Figure 1 On-chip single-cell-based cell culture system using
agarose microchambers. (a) Making of microchambers. Collagen
was applied to the chromium-coated glass slides in order to
improve the attachment of the cells. After the slides were spin-
coated with agarose, microchambers and channels connecting
them were formed using a 1064-nm infrared laser beam. (b) On-
chip single-cell-based cultivation and observation system.
Kaneko et al. Journal of Nanobiotechnology 2011, 9:21
/>Page 3 of 13
into water, forming a channel. Indiv idual cardiomyo-
cytes were micropipetted into the end microchambers
and cultured there at 37°C in a humidified atmosphere
(95% air and 5% CO
2
) in a cell culture container
(INU-ONIG; Tokai Hit, Shizuoka, Japan) mounted on
a phase contrast microscope (Figure 1(b)).
Formation of single-cell-based cardiomyocytes and
fibroblast network model
For the precise evaluation of cell-to-cell connection of
cardiomyocytes and fibroblasts quantitatively, especially
to compare the characteristic s before and after their
connection to be formed and to control their spatial
arrangements and their distances, on-chip single-cell-
based microfabrication a nd cultivation technology was
useful. We cultivated single fibroblasts to conn ect iso-
lated two cardiomyocytes cultivated in both sides of
three lined-up microchambers so that we could see
how two cardiomyocytes with different beating
rhythms synchronized their rhythms through fibro-
blasts. First, the two single cardiomyocytes were cul-
tured in the two microchambers at the ends of a
three-microchamber array, and Figure 2(a) shows the
cell growth 48 hours after cultivation started. At this
time the two cardiomyocytes did not contact each
other and their beating rhythms were independent and
uncorrelated even the two cells were obtained from
same tissue sam ple (Figure 2(b)). Then, to connect the
two cardiomyo cytes through a fibroblast, 72 hours
after starting the cultivation we put a single fibroblast
into the center microchamber (Figure 2(c)) and contin-
ued the cultivation. Finally, as shown in Figure 2(d), 6
hours later, a cardiomyocyte-fibroblast-cardiomyocyte
network had formed as a result of fibroblast elongation
and attachment to the two cardiomyocytes. The cardi-
omyocytes connected by the fibroblast then synchro-
nized their beating rhythm (an arrow in Figure 2(e)). It
should be noted that, as in the synchronization of
homogeneous cardiomyocyte networks [22], the syn-
chronized rhythm was not intermediate betw een the
individual rhythms but was one of them. As shown in
Figure 2(e), for example, during the synchronization of
the independent rhythms of cells A and B, the beating
of cell A stopped and then restarted in synchrony with
the beating of cell B.
These results show that cardiomyocyte-fibroblast
connections can couple a fibroblast and two asynchro-
nously beating cardiomyocytes into a three-cell net-
work in which the rhythms of the cardiomyocytes are
synchronized and that the process of establishing a
synchronous state can be observed continuously at the
single-cell level.
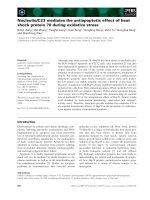
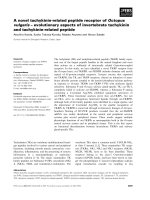
Figure 2 Interaction through a cardiac fibroblast of two cardiomyocytes with different rhythms. (a) A phase-contrast image of two
cardiomyocytes (white arrows) with different beating rhythms cultured in microchambers A and B (48 hours after cultivation started). (b) Time
course of two cardiomyocytes’ beating rhythm before synchronization. (c) Using glass micropipette, single cardiac fibroblast (white arrowhead)
was set at the center of three lined-up microchambers (72 hours after cultivation started). (d) The two cardiomyocytes were connected through
single cardiac fibroblast (6 hours after re-cultivation started, i.e., 76 hours after cultivation started). (e) Time course of beating rhythms of
cardiomyocytes cultured in microchambers A and B after synchronization. Dashed line shows time that synchronization occurred.
Kaneko et al. Journal of Nanobiotechnology 2011, 9:21
/>Page 4 of 13
Figure 3 showed another example of four cell net-
work formation on a chip. Just same as three cell net-
work model, first, two cardiomyocytes were settled
both ends of four lined-up microchambers (A and B in
Figure 3(b)). After the confirmation of their beating,
two cardiac fibroblasts were settled in the remaining
two center microchambers (Figure 3(c)), and finally
these four cells were connected, and synchronized
(Figures 3(e) and 3(g)).
Synchronization of two cardiomyocyte beating through a
fibroblast
In Figures 2 and 3, t he synchronization of two cardio-
myocytes was observed by optical measurement of
those cells’ displacements. Then we have evaluated the
electrical connection of two cardiomyocytes with/
without fibroblast between them using double whole-
cell patch-clamp recordings for studying the character-
istics of connections quantitatively. Figures 4(a) and 4
(b) showed a n example of two cardiomyocyte network
measurement and the results of electrical connections
of two cardiomyocytes. Figures 4(c) and 4(d) also
showed an example of two cardiomyocyte network
connected through a cardiac fibroblast. As shown in
the graph, slight delay of electrical potential change
was observed when the fibroblast was added between
two cardiomyocytes.
Table 1 is a summary of a series of two cardiomyo-
cytes’ delay times. In this experiment, applying the
advantage of our agarose microchamber cultivation
method, we control the distances of cells strictly. First,
the direct connections of two cardiomyocytes (CM-CM)
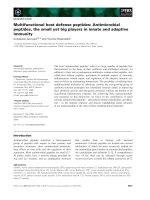
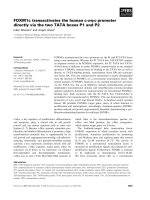
Figure 3 Interaction of two cardiomyocytes through two cardiac fibroblasts . (a) Four agarose microchamber array fabricated on the
cultivation chip. (b) Two cardiomyocytes cultivated in both sides of four microchambers (A, B) (micrograph image acquired 24 hours after
cultivation started). (c) After the confirmation of two cardiomyocytes’ beating, two fibroblasts were put into the two center microchambers
(micrograph, 1 h after fibroblast cultivation started). (d) Confirmation of fibroblasts because of their fast elongation ability (2 h after (c)). (e)
Synchronization of two cardiomyocytes through two fibroblasts (1 day after fibroblasts’ addition). (f) Time course of beating rhythms of
cardiomyocytes cultured in microchambers A and B before synchronization at (b), and (g) after synchronization at (e).
Kaneko et al. Journal of Nanobiotechnology 2011, 9:21
/>Page 5 of 13
with 60 μm distance showed less than 0.1 ms delay of
propagation (average: 0.055 ms) and average conduction
velocity of 1.3 m/s. In contrast, the delay time of propa-
gation in two cardiomyocytes connected by a fibroblast
(CM-F-CM) increased to 0.7 - 6.0 ms (average: 3 ms),
and was a magnitude slower than the direct connection
of two cardiomyocytes both in the 120 μm and 180 μm
distance models, i.e., 60 μ mand90μ mdistances
between cardiomyocyte and fibroblast respectively. Aver-
age conduction velocity with 120 μmdistance(CM-F-
CM) was 0.08 m/s. There are significantly difference (P
< 0.001) between conductio n velocity of CM-CM and
one of CM-F-CM. Moreover, when we arranged two
fibroblasts between two cardiomyocytes (CM-F-F-CM)
with 60 μm distances between neighbori ng cells, the
propagation delay increased to 11 ms, and was obviously
slower than that of single fibroblast connection model.
The above results showed that the fluctuations in CM-
F-CM samples having same 60 μm distances were larger
than the difference of fluctuations between CM-F-CM
samples having 60 μm distances and 90 μm distances,
andalsoshowedtheadditionoffibroblast significantly
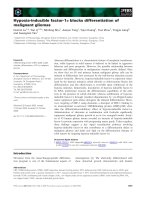
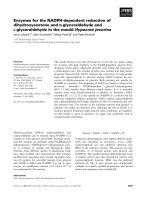
Figure 4 Electroph ysiological measurement of synchron ization of two cardiomyocytes with/without a fibroblast between them. ( a) A
phase-contrast image of two cardiomyocytes (A, B; yellow arrows) and two micropipettes (white arrows) for electrophysiological recording. Two
cardiomyocytes were connected through the channel fabricated in the agarose layer on a chip. (b) Time course of two cardiomyocytes’ beating
action potentials. (c) A phase-contrast image of a lined-up two cardiomyocytes (C, D; yellow arrows) and single fibroblast (green arrow) network
(72 hours after cultivation started). Two micropipettes (white arrows) were put on two cardiomyocytes for electrophysiological recording. Two
cardiomyocytes were connected through the channel fabricated in the agarose layer on a chip. (d) Time course of two cardiomyocytes’ beating
action potentials connected by a fibroblast. In detail, see Table 1.
Table 1 Electrical connection of two cardiomyocytes
Connection
type*
1
Distance
(μm)*
2
Delay time
(ms)*
3
Velocity (m/
s)*
4
N*
5
CM-CM 60 0.031 ± 0.03 1.8 ± 0.8 12
CM-CM 60 0.059 ± 0.02 1.3 ± 0.7 24
CM-CM 60 0.063 ± 0.03 1.3 ± 0.7 20
CM-CM 60 0.068 ± 0.008 0.90 ± 0.1 60
CM-F-CM 120 0.67 ± 0.03 0.18 ± 0.008 93
CM-F-CM 120 1.5 ± 0.2 0.080 ± 0.01 39
CM-F-CM 120 3.8 ± 0.3 0.032 ± 0.003 95
CM-F-CM 120 6.0 ± 0.6 0.020 ± 0.002 48
CM-F-CM 180 0.91 ± 0.4 0.23 ± 0.08 29
CM-F-CM 180 2.2 ± 0.3 0.085 ± 0.01 50
CM-F-F-CM 180 11 ± 0.4 0.016 ±
0.0006
6
*1
Connection type: CM-CM means two cardiomyocytes directly connection.
CM-F-CM means two cardiomyocytes connected by one fibroblast. CM-F-F-CM
means two cardiomyocytes connected by two fibroblasts.
*2
Distance: interval of the tips of micropipettes.
*3
Delay time: interval between the action potentials of two cardiomyocytes at
0 mV (mean ± SD).
*4
Velocity: conduction speed (distance/delay time).
*5
N: sampling number of spikes.
Kaneko et al. Journal of Nanobiotechnology 2011, 9:21
/>Page 6 of 13
contributed to delay the propagation. These results indi-
cated that the delay of propagation was mainly occurred
by the increase of number of fibroblasts, not by the
extension of fibroblasts.
Community effect in cardiomyocyte networks coupled
through fibroblasts
Then, we used this heterogeneous cardiomyocyte-fibro-
blast coupling system to examine the tendency of the
stability of interbeat intervals and beating rhythm fluc-
tuation of two cardiomyocytes before and after their
synchronization through a fibroblast. In our previous
study of using homogeneous (i.e., direct) coupling of
two cardiomyocytes [22] , the tendency of the synchroni-
zation was simply explained by saying that the synchro-
nization of two cardiomyocytes was caused by the more
unstablecell(theonewiththemorevariablebeating
intervals) following the more stable cel l. Such fluctua-
tion reduction tendency was more obvious when the
number of cardiomyocytes in the netw ork increased,
and we call this phenomenon as “community effect” of
synchronization [21-23].
Evaluating the mechanism of community effect, we
also should compare the heterogeneous cell networks
against the homogeneous cell networks. Hence we have
exami ned the synchronization of the two-cardiomyocyte
network having a fibroblast connection, and found two
types of tendencies of the fluctuation of beating intervals
before and after synchronization.
The first type was the tendency of fluctuation reduc-
tion caused by synchronization, which is same tendency
seen in a network formed by the direct connectio n of
two cardiomyocytes. As shown in Figure 5, in this case,
the two cells having interbeat interv als of 0.78 s and 1.1
s before synchronization (Figure 5(a)) had made a syn-
chronized interbeat interval of only 0.65 s after synchro-
nization (Figure 5 (b)). The fluctuation of synchronized
network became smaller than either of the two initial
fluctuations (Figure 5(c)).
In contrast, the s econd type was the tendency of fluc-
tuation increase caused by synchronization, which was
not occurred in the cardiomyocyte network. In this case,
the two cells having two interbeat intervals of 0.48 s and
1.2 s be fore synchronization(Figure5(d))hadamean
Figure 5 Distribution of interbeat intervals of two cardiomyocytes coupled through a cardiac fibroblast, and changes in the mean
beating rhythm fluctuation before and after synchronization. (a)(d) Distribution of interbeat intervals before synchronization. Blue and red
bars show the frequency (%) of each interbeat interval for two cardiomyocytes, and blue and red arrowheads indicate the mean values for each.
(b)(e) Distribution of interbeat intervals after synchronization. Blue and red arrowheads indicate the before-synchronization mean values for the
same two cardiomyocytes whose data are shown in (a) and (d) respectively, and the black arrowheads show the mean value for the
synchronized cardiomyocytes. (c)(f) Beating rhythm fluctuation (coefficient of variation, CV) in 1-min intervals before and after synchronization.
Blue filled circles and red filled squares show mean values for the same two cardiomyocytes whose data are shown in (a) and (d) respectively.
Results for two kind pairs are shown in (a)-(c) for fluctuation CV decrease and (d)-(f) for those increase. In detail, see Table 2.
Kaneko et al. Journal of Nanobiotechnology 2011, 9:21
/>Page 7 of 13
interbeat interval of 0.79 s after synchronization (Figure
5(e)), and the fluctuation of the synchronized network
was greater than that of the cell that had the lower fluc-
tuation before the synchronization (Figure 5(f)).
Tables 2 and 3 showed the results of synchronization of
two cardiomyocytes connected through a fibroblast. All
the fluctuation CV decrease samples (Table 2) showed
reduction of fluctuation from both of CV’s before syn-
chronization regardless of the tendencies of synchronized
interbeat intervals (IBIs) formation. However, the fluctua-
tion CV increase samples (Table 3) showed the CVs of
synchronized cardiomyocytes were larger than one of the
smaller CV cardiomyocytes. That is, the improvement of
fluctuation by network formation was not observed.
We also have checked the phenomenon of three cardi-
omyocyte networks (CM-CM-CM) for the confirmation
(Table 4), and found all of three samples were categor-
ized into the fluctuation CV decrease samples same as
we have reported previously [23]. Hence, t he fluctuation
CV increase samples should be caused by the fibroblast,
which is connecting two cardiomyocytes.
These results indicate that the interbeat interval after
the synchronization of two cardiomyocytes connected
by a fibroblast is not sa me as that after the synchroniza-
tion of two cardiomyocytes directly connected to each
other [22], and the tendency of community effect seems
to be suppressed when the cardiomyocytes are heteroge-
neously coupled through a fibroblast. Since the gap
junctions between fibroblasts and cardiomyocytes are
smaller than those between pairs of cardiomyocytes
[4,5], the suppression of this tendency might be due to
the lower electrical conductivity. This suggests tha t the
community effect in the synchronization of cultured car-
diomyocytes –that is, the enhanced synchronization seen
with larger communities–will be most evident in homo-
geneous cardiomyocyte clusters.
Time course of stability of cardiomyocyte networks
coupled through fibroblasts
Investigating the time course of the stability of synchro-
nization, we also checked the possibility of occurrence
of asynchronization after their synchronization accom-
plished. Two cardiomyocytes fo r long-term observation
were cultured in the chambers at the ends of a three-
microchamber array in which a fibroblast was cultured
in the center chamber. The fibroblast grew and
extended through the narrow channels connecting adja-
cent chambers until it was attached to the two cardio-
myocytes ( Figure 6(a)), which then started to
synchronize. After the synchronization accomplished,
however, the beating of the two cardiomyocytes later
became asynchronous (Figures 6(b) and 6(c)).
This after-synchronization asynchronization was not
seen in our earlier study using directly connected cardi-
omyocytes [22]. It also should be n oted that this asyn-
chronization phenomenon was observed in all the above
two types of fibroblast-cardiomyocyte synchronization.
For the confirmation of long term cultivation, we also
have observed three of the CM-F-CM samples continu-
ously for 6 h, and found that their fluctuation (CV)
decreased gradually during cultivation, and no asynchro-
nization occurrence was observed when we observed
them 6 h after the synchronization accomplished (Table
5). The result indicates that the asyn chronization was
temporal phenomenon and finally they synchronized
completely within 6 h during long term cultivation.
Figure 7 showed the tendency of synchronization and
asynchronization of cardiomyocyte network connected
through a fibroblast. Figure 7(a) is the logistic map of
neighboring synchronized periods and the asynchronized
periods replotted from the data shown in Figure 6. If the
neighboring periods have any kind of correlations, the
Table 2 CV down group of interbeat interval (IBI) and
fluctuation (CV) of two cardiomyocytes networks
connected by a fibroblast
CV
down
Before After Before After
Sample
No.
IBI (Left) IBI (Right) IBI vCV
(Left)
CV
(Right)
CV
1 0.78 ± 0.13 1.1 ± 0.32 0.65 ± 0.08 17 29 12
2 2.4 ± 3.1 1.2 ± 0.54 1.0 ± 0.34 130 45 34
3 0.63 ± 0.25 2.3 ± 1.1 1.0 ± 0.34 39 49 34
4 5.0 ± 6.9 0.43 ± 0.12 0.59 ± 0.10 140 28 17
5 2.3 ± 1.9 0.57 ± 0.09 0.55 ± 0.08 84 16 15
Table 3 CV up group of interbeat interval (IBI) and
fluctuation (CV) of two cardiomyocytes networks
connected by a fibroblast
CV up Before After Before After
Sample
No.
IBI (Left) IBI (Right) IBI CV
(Left)
CV
(Right)
CV
1 0.48 ± 0.10 1.2 ± 0.62 0.79 ± 0.32 20 52 40
2 1.2 ± 0.26 0.62 ± 0.10 0.73 ± 0.14 22 16 19
3 0.52 ± 0.10 6.1 ± 11 0.78 ± 0.32 19 180 41
4 1.9 ± 1.6 0.86 ± 0.15 1.6 ± 0.59 82 18 37
5 2.6 ± 1.4 0.57 ± 0.13 3.8 ± 1.8 53 22 47
6 22 ± 17 1.7 ± 0.80 6.0 ± 4.4 78 47 74
Table 4 Interbeat interval (IBI) and fluctuation (CV) of
three cardiomyocytes networks
Before After Before After
Sample
No.
IBI (Left) IBI (Right) IBI CV
(Left)
CV
(Right)
CV
1 0.36 ± 0.08 0.48 ± 0.12 0.42 ± 0.06 22 25 14
2 0.83 ± 0.20 0.78 ± 0.17 0.76 ± 0.15 24 21 20
3 0.46 ± 0.15 1.3 ± 0.53 1.3 ± 0.19 33 42 15
Kaneko et al. Journal of Nanobiotechnology 2011, 9:21
/>Page 8 of 13
results (plotted dots) should show some pattern on the
map. The results indicated that 1) the tendency of the
length of the synchron ized period increased gradually
depending on the cultivation time, whereas the length of
asynchronized periods did not changed, 2) both of the
length of the synchronized period and the length of
asynchronized periods showed no obvious correlation
between neighboring periods (i.e., no hysteresis).
Regarding the independence of the recovery time from
asynchronized periods, it is more obvious when we plot
the required number of beating for the recovery from
asynchronized periods to synchronized periods. As
shown in Figure 7(b), all the length of asynchronized
condition was within 30 beatings independent to cultiva-
tion time, whereas the length of synchronized condition
varied from less than 10 beatings to more than 40
beatings.
Regarding the electrical conductivity, Figures 8 and 9
showstheresultsofimmunostainingsofgap-junction
proteins (connexin-43) to the three cardiomyocyte net-
work (CM-CM-CM) and the two cardiomyocyte net-
work connected by a fibroblast (CM-F-CM). As far as
we can see in the Figures 8(h) and 9(h), at least connex-
tin-43 was observed both in cardiomyocytes and
Figure 6 Time-course of beating synchronization of two cardiomyocytes connected through a cardiac fibroblast. (a) 10 min of beating
rhythms of two cardiomyocytes (blue line and red line). The line under the beating rhythms indicate the condition of their synchrony, i.e., green
line indicates synchronized condition, whereas yellow line indicates asynchronized condition. (b) Magnified graph of Figure (a) from 0 to 10 s,
and (c) from 505 to 515 s.
Table 5 Long term observation of interbeat intervals and fluctuation of two cardiomyocytes connected by a fibroblast
Before After 0h After 0h After 6h
Sample No. IBI (Left) IBI (Right) CV (Left) CV (Right) IBI CV IBI CV IBI CV
1 0.77 ± 0.23 0.67 ± 0.11 30 16 0.56 ± 0.08 15 0.30 ± 0.06 20 0.27 ± 0.04 14
2 0.55 ± 0.23 0.81 ± 0.14 42 17 0.74 ± 0.10 14 0.58 ± 0.08 14 0.59 ± 0.07 12
3 0.48 ± 0.18 0.49 ± 0.12 37 25 0.47 ± 0.11 27 0.40 ± 0.05 12 0.37 ± 0.04 11
Kaneko et al. Journal of Nanobiotechnology 2011, 9:21
/>Page 9 of 13
Figure 7 Tendency of synchronization and asynchronization of cardiomyocyte network connected through a fibroblast. (a) Logistic
map of synchronized intervals and asynchronized intervals, (b) frequency of the synchronized condition length or asynchronized condition
length of sample shown in Figure 6.
Figure 8 Immunostaining of synchronized three cardiomyocyte network. (a) - (e) Phase-contrast images of arrangement and cultivation
process of three cardiomyocyte network. (a) Agarose microchamber. (b) Two cardiomyocytes set in both ends of the microchambers (white
arrowheads). (c) Two cardiomyocytes having different beating rhythms was observed 1 day after cultivation started. (d) The third cardiomyocyte
set in the center microchamber (white arrow). (e) After their physical contact, all three cardiomyocytes synchronized (12 h after recultivation
started). (f) Phase-contrast image of three cardiomyocyte after fixation with 4% Formaldehyde solution. (g) - (i) Fluorescence images of (g)
Nucleus (Hoechst33342; blue), (h) connexin-43 (green), (i) heavy chain cardiac myosin (red). (j) Phase-contrast image superimposed on the
fluorescence images (g) - (i).
Kaneko et al. Journal of Nanobiotechnology 2011, 9:21
/>Page 10 of 13
fibroblasts in both of the networks. Summing up to the
results of the direct measurement of electrical conduc-
tivity of CM-F-CM by patch-clamp measurement and
immunostaining, electrical conductivity was maintained
among CM-F-CM networks.
One possible reason for asynchronization occurrence
might be the limited intercellular communication due to
the lower electrical conductivity caused by the fibro-
blast-cardiomyocyte gap junctions [4,5], and another is
the contribution of the mechanochemical coupling, i.e.
mechanical stretching caused by the beating of neigh-
boring cells triggers or enhances the calcium release in
cardiomyocytes, induced synchronization tendency in
cardiomyocyte network [23,24].
If the asynchronization is due to the lower electrical
conductivity, the more fibroblasts are added between
two cardiomyocytes, the less communication should be
recorded between those cardiomyocytes. As shown in
Table 1, the addition of fibroblast into the cardiomyo-
cyte network decreased the propagation velocity, and is
indicating the reduction of ability to respond to the
cardiomyocytes. The addition of fibroblasts also
lengthens the pathway between two cardiomyocytes,
however, the propagation of signals did not changed
caused by the length differences. That is, only the
increase number of fibroblasts should influence t he
synchronization ability.
If, on the other hand, the synchronization is due to
the mechanochemical coupling of neighboring cardio-
myocytes, the contribution of physical contact and
shorter distance of beating cardiomyocytes should be
large to mai ntain the synchronization state in the cell
network.
To clarify and discuss more carefully about the contri-
bution of above two factors for cardiomyocytes’ syn-
chronization and contribution of fibroblasts, we h ave
then examined another three cell connection experi-
ment. That is, two cardiomyocyte cells were connected
by a HeLa cell. HeLa cells are one of the cell line and is
not regarded as the connecting cells between cardio-
myocytes. Figure 10(a) is the phase-contra st micrograph
oftheCM-HeLa-CMnetwork.Whenweaddedthe
Alexa Fluor 568 Hydrazide into the HeLa cell and found
no transportation of fluorescence dye to two cardiomyo-
cytes (Figure 10(b)). And the two ends of c ardiomyo-
cytes continued synchronized as shown in Figure 10(d).
The results indicate that the synchronization of two
cardiomyocytes also could not only by the electrical
Figure 9 Immunostaining of synchronize d two cardiomyocytes connected by a fibroblast. (a) - (e) Phase-contrast images of arrangement
process of cardiomyocytes and a fibroblast. (a) Agarose microchamber. (b) Two cardiomyocytes set in both ends of the microchambers (white
arrowheads). (c) Two cardiomyocytes with different beating rhythms were observed 3 days after cultivation started. (d) A fibroblast set at the
center of the microchambers (white arrow). (e) Two cardiomyocytes were synchronized through the fibroblast (12 h after recultivation started). (f)
Phase-contrast image of two cardiomyocytes connected by a fibroblast after fixation with 4% Formaldehyde solution. (g) - (i) Fluorescence
images of (g) Nucleus (Hoechst33342; blue), (h) connexin-43 (green), (i) heavy chain cardiac myosin (red). (j) Phase-contrast image superimposed
on the fluorescence images (g) - (i).
Kaneko et al. Journal of Nanobiotechnology 2011, 9:21
/>Page 11 of 13
conductivity like gap-junction connection nor cytoplas-
mic transportation.
For example, as described in our p revious report [24],
slight (sarcomere-level) displacement was enough to
trigger synchronization as far as enough acceleration
was generated. If it is correct, the existence of fibroblast
might intercept acceleration conduction and reduced
the stabilization of synchronization.
We have prepared the human induced pluripotent
stem cell-derived cardiomyocytes and confirmed their
fundamental ion-channel abilities [25], and we al so have
indicated the importance of control of community effect
of cardiomyocytes, which can explain the difference of
compound responses depending on cell network sizes
[26]. Hence, considering the appropriate arrangement of
fibroblasts among cardiomyocyte networks to represent
re-modeling heart or aged heart, we might be able to
improve on-chip in vitro cardiomyocyte network model
for cardiotoxicity testing having more precise and sensi-
tive human QT prolongation measurement.
Conclusions
In this pa per, as a pa rt of our c onstructive/re-con-
structive approach to fabricate artificial higher com-
plexity of cellular system, functional cell-network, we
have examined the meaning and contribution of fibro-
blasts in the cardiomyocyte network using on-chip
single-cell-based cultivation system. Our results
summarized as (1) propagation velocity of electrophy-
siological signals between cardiomyocytes decreased
depending on the increasing number of fibroblasts, not
the lengths of fibroblasts; (2) fluctuation of interbeat
intervals of synchronized two cardiomyocyte network
connected by a fibroblast did not always decreased,
and was different from homogeneous cardiomyocyte
networks, and (3) the synchronized cardiomyocytes
connected by fibroblasts loses their synchronized con-
dition and recovered to synchronized condition, in
which the length of asynchronized period was indepen-
dent to their cultivation time whereas the length of
synchronized period increased according to cultivation
time. All above results indicated that the importance
of the influence of the fibroblasts in a cardiomyocyte
cluster from the viewpoint of synchronization, i.e.,
reduct ion of the ability of synchronization.
Limitations of the study
The exact nature of the cell in the middle is not 100%
clear but it is likely a fibroblast because this cell is fast
cell division time, fast extension speed, and no staining
of cardiomyocyte marker.
Abbreviations
CCD: charge-coupled device; DMEM: Dulbecco’s modified Eagle’s medium;
EDTA: ethylenediaminetetraacetic acid; PBS: Phosphate-buffered saline;VCR:
video cassette recorder.
Figure 10 Microinjection of fl uores cence dye into a HeLa cell between synchronized two cardiomyocytes. (a) Phase-c ontrast image of
two cardiomyocytes (black arrowheads) beating synchronizaiton connected by a HeLa cell (black arrow). (b) Fluorescence image of Alexa Fluor
568 Hydrazide (white arrow) injected into the HeLa cell. (c) Phase-contrast image superimposed on the fluorescence image of (b). No dye
transfer was found from the HeLa cell to the two cardiomyocytes. (d) Time course of synchronized beating rhythm of two cardiomyocytes
connected by a HeLa cell. Bar, 50 μm.
Kaneko et al. Journal of Nanobiotechnology 2011, 9:21
/>Page 12 of 13
Acknowledgements
This work was supported in part by the Japan Science and Technology
Agency and by Grants-in-Aids for Science Research from the Japanese
Ministry of Education, Culture, Sports, Science and Technology.
Authors’ contributions
TK and FN carried out whole experiments and participated in the design of
the study and contributed to the drafting of the manuscript. KY conceived
of the study, participated in its design and coordination and drafted the
manuscript. All authors read and approved the final manuscript.
Competing interests
The authors declare that they have no competing interests.
Received: 20 July 2010 Accepted: 23 May 2011 Published: 23 May 2011
References
1. Rudy Y: Conductive bridges in cardiac tissue: a beneficial role or an
arrhythmogenic substrate? Circ Res 2004, 94:709-11.
2. Camelliti P, Green CR, LeGrice I, Kohl P: Fibroblast network in rabbit
sinoatrial node: structural and functional identification of homogeneous
and heterogeneous cell coupling. Circ Res 2004, 94:828-35.
3. Camelliti P, McCulloch AD, Kohl P: Microstructured cocultures of cardiac
myocytes and fibroblasts: a two-dimensional in vitro model of cardiac
tissue. Microsc Microanal 2005, 11:249-59.
4. Kohl P: Heterogeneous cell coupling in the heart: an electrophysiological
role for fibroblasts. Circ Res 2003, 93:381-3.
5. Gaudesius G, Miragoli M, Thomas SP, Rohr S: Coupling of cardiac electrical
activity over extended distances by fibroblasts of cardiac origin. Circ Res
2003, 93:421-8.
6. Miragoli M, Gaudesius G, Rohr S: Electrotonic modulation of cardiac
impulse conduction by myofibroblasts. Circ Res 2006, 98:801-10.
7. Fahrenbach JP, Mejia-Alvarez R, Banach K: The relevance of non-excitable
cells for cardiac pacemaker function. J Physiol 2007, 585(Pt 2):565-78.
8. Goshima K: Synchronized beating of and electrotonic transmission
between myocardial cells mediated by heterotypic strain cells in
monolayer culture. Exp Cell Res 1969, 58:420-6.
9. Goshima K: Formation of nexuses and electrotonic transmission between
myocardial and FL cells in monolayer culture. Exp Cell Res 1970,
63:124-30.
10. Goshima K: Initiation of beating in quiescent myocardial cells by
norepinephrine by contact with beating cells and by electrical
stimulation of adjacent FL cells. Exp Cell Res 1974, 84:223-34.
11. Rohr S, Schölly DM, Kleber AG: Patterned growth of neonatal rat heart
cells in culture. Morphological and electrophysiological characterization.
Circ Res 1991, 68:114-30.
12. Rohr S, Flückiger-Labrada R, Kucera JP: Photolithographically defined
deposition of attachment factors as a versatile method for patterning
the growth of different cell types in culture. Pflugers Arch - Eur J Physiol
2003, 446:125-32.
13. Moriguchi H, Takahashi K, Sugio Y, Wakamoto Y, Inoue I, Jimbo Y, Yasuda K:
On-chip neural cell cultivation using agarose-microchamber array
constructed by a photothermal etching method. Electr Eng Jpn 2004,
146:37-42.
14. Moriguchi H, Wakamoto Y, Sugio Y, Takahashi K, Inoue I, Yasuda K: An
agar-microchamber cell-cultivation system: flexible change of
microchamber shapes during cultivation by photo-thermal etching. Lab
Chip 2002, 2:125-30.
15. Suzuki I, Sugio Y, Moriguchi H, Jimbo Y, Yasuda K:
Modification of a
neuronal network direction using stepwise photo-thermal etching of an
agarose architecture. J Nanobiotechnol 2004, 2:7.
16. Suzuki I, Sugio Y, Jimbo Y, Yasuda K: Individual-cell-based
electrophysiological measurement of a topographically controlled
neuronal network pattern using agarose architecture with a multi-
electrode array. Jpn J Appl Phys 2004, 43:403-6.
17. Sugio Y, Kojima K, Moriguchi H, Takahashi K, Kaneko T, Yasuda K: An agar-
based on-chip neural-cell-cultivation system for stepwise control of
network pattern generation during cultivation. Sens and Actuators B 2004,
99:156-62.
18. Kojima K, Moriguchi H, Hattori A, Kaneko T, Yasuda K: Two-dimensional
network formation of cardiac myocytes in agar microculture chip with
1480 nm infrared laser photo-thermal etching. Lab Chip 2003, 3:292-6.
19. Kojima K, Takahashi K, Kaneko T, Yasuda K: Flexible control of electrode
pattern on cultivation chamber during cultivation of cells using non-
destructive optical etching. Jpn J Appl Phys 2003, 42:980-2.
20. Kojima K, Kaneko T, Yasuda K: A novel method of cultivating cardiac
myocytes in agarose microchamber chips for studying cell
synchronization. J Nanobiotechnol 2004, 2:9.
21. Kojima K, Kaneko T, Yasuda K: Stability of beating frequency in cardiac
myocytes by their community effect measured by agarose
microchamber chip. J Nanobiotechnol 2005, 3:4.
22. Kojima K, Kaneko T, Yasuda K: Role of the community effect of
cardiomyocyte in the entrainment and reestablishment of stable
beating rhythms. Biochem Biophys Res Commun 2006, 351:209-15.
23. Kaneko T, Kojima K, Yasuda K: Dependence of the community effect of
cultured cardiomyocytes on the cell network pattern. Biochem Biophys
Res Commun 2007, 356:494-498.
24. Shimamoto Y, Suzuki M, Mikhailenko SV, Yasuda K, Ishiwata S: Inter-
sarcomere coordination in muscle revealed through individual
sarcomere response to quick stretch. PNAS 2009, 106:11954-9.
25. Tanaka T, Tohyama S, Murata M, Nomura F, Kaneko T, Chen H, Hattori F,
Egashira T, Seki T, Ohno Y, Koshimizu U, Yuasa S, Ogawa S, Yamanaka S,
Yasuda K, Fukuda K: In vitro pharmacologic testing using human induced
pluripotent stem cell-derived cardiomyocytes. Biochem Biophys Res
Commun 2009, 385:497-502.
26. Kaneko T, Kojima K, Yasuda K: An on-chip cardiomyocyte cell network
assay for stable drug screening regarding community effect of cell
network size. Analyst 2007, 132:892-8.
doi:10.1186/1477-3155-9-21
Cite this article as: Kaneko et al.: On-chip constructive cell-Network
study (I): Contribution of cardiac fibroblasts to cardiomyocyte beating
synchronization and community effect. Journal of Nanobiotechnology
2011 9:21.
Submit your next manuscript to BioMed Central
and take full advantage of:
• Convenient online submission
• Thorough peer review
• No space constraints or color figure charges
• Immediate publication on acceptance
• Inclusion in PubMed, CAS, Scopus and Google Scholar
• Research which is freely available for redistribution
Submit your manuscript at
www.biomedcentral.com/submit
Kaneko et al. Journal of Nanobiotechnology 2011, 9:21
/>Page 13 of 13