báo cáo khoa học: "Determination of pore size distribution at the cell-hydrogel interface" ppt
Bạn đang xem bản rút gọn của tài liệu. Xem và tải ngay bản đầy đủ của tài liệu tại đây (3.13 MB, 7 trang )
SHOR T COMMU N I C A TION Open Access
Determination of pore size distribution at the
cell-hydrogel interface
Aldo Leal-Egaña
1*
, Ulf-Dietrich Braumann
2,3
, Aránzazu Díaz-Cuenca
4,5
, Marcin Nowicki
6
and Augustinus Bader
1
Abstract
Background: Analyses of the pore size distribution in 3D matrices such as the cell-hydrogel interface are very
useful when studyin g changes and modifications produced as a result of cellular growth and proliferation within
the matrix, as pore size distribution plays an important role in the signaling and microenvironment stimuli
imparted to the cells. However, the majority of the methods for the assessment of the porosity in biomaterials are
not suitable to give quantitative information about the textural properties of these nano-interfaces.
Findings: Here, we report a methodology for determining pore size distribution at the cell-hydrogel interface, and
the depth of the matrix modified by cell growth by entrapped HepG
2
cells in microcapsules made of 0.8% and
1.4% w/v alginate. The method is based on the estimation of the shortest distance between two points of the
fibril-like network hydrogel structures using image analysis of TEM pictures. Values of pore size distribution
determined using the presented method and those obtained by nitrogen physisorption measurements were
compared, showing good agreement. A combination of these methodologies and a study of the cell-hydrogel
interface at various cell culture times showed that after three days of culture, HepG
2
cells growing in hydrogels
composed of 0.8% w/v alginate had more coarse of pores at depths up to 40 nm inwards (a phenomenon most
notable in the first 20 nm from the interface). This coarsening phenomenon was weakly observed in the case of
cells cultured in hydrogels composed of 1.4% w/v alginate.
Conclusions: The method purposed in this paper allows us to obtain information about the radial deformation of
the hydrogel matrix due to cell growth, and the consequent modification of the pore size distribution pattern
surrounding the cells, which are extremely important for a wide spectrum of biotechnological, pharmaceutical and
biomedical applications.
Background
Alginate is a natural polysaccharide, which forms stable
three-dimensional (3D) hydrogels upon binding divalent
cations such as Ca
2+
,Sr
2+
or Ba
2+
. Due to the high
immune compatibility, the use of alginate to entrap cells
has been widely studied with the purpose of entrapping
immortalized and/or transformed cells which could
replace malfunctioning tissues of a diseased organ [1].
Besides, alginate microcapsules can be used to test the
action of anticancer drugs on malignant cells embedded
in a 3D environment (tumour-like microcapsules) [2].
Owing to the enhanced proliferation capacity of
immortalized and/or cancer cells, the analysis of modifi-
cations of the interface between cell and biomaterial
with cell growth is highly desirable. Some methods to
characterize the porous structure of the 3D networks
have been previously reported, such as mercury intru-
sion porosimetry [3], nitrogen physisorption [4], and the
diffusion kinetics of relevant solutes [5]. Nevertheless,
these techniques cannot be applied in the presence of
cells, nor do they give information about modifications
produced at the cell-biomaterial interface due to cell
proliferation.
Owing to the feasibility of obtaining and analyzing
high resolution electron microscope images of cr yofixed
cells embedded in 3D matrice s, it is one of the most
widely used techniques to analyze textural properties of
hydrogels, offering the advantage of simultaneously
* Correspondence:
1
Department of Cell Technology and Applied Stem Cell Biology,
Biotechnology and Biomedicine Centre (BBZ), University of Leipzig.
Deutscher Platz 5, 04103, Leipzig, Germany
Full list of author information is available at the end of the article
Leal-Egaña et al. Journal of Nanobiotechnology 2011, 9:24
/>© 2011 Leal-Egañ a et al; lice nsee BioMed Central Ltd. This is an Open Access article distrib uted under the terms of the Creative
Commons Attribution License ( which permits unrestricted use, distribution, and
reproduction in any medium, provided the original work is properly cited.
obtaining information pertaining to both the cells and
the material comprising the matrix [6]. Since hydrogels
are most commonly formed by networks of randomly
interconnected polymers, they form complex microar ch-
itectures of cavities with variable shapes and morpholo-
gies. Even though well-defined pore-like structures can
be clearly observed with scanning electron microscopy
[7], we need to consider other approaches for extracting
accurate quantitative three dimensional information of
the hydrogel matrix from measurements made in two
dimensions.
In this paper we describe a methodology based on
automated image processing and analysis of transmis-
sion electron microscopy (TEM) images obtained from
hydrogels, and its applicability on determining modifica-
tions of the pore size distribution at the cell-alginate
interface as a result of cell growth.
The method was performed after entrapping the hepa-
tocarcinoma cell line HepG
2
, which represents an exam-
ple of cells with enhanced proliferative capacity.
Findings
Material and methods
Electron microscopy images
Transmission Electron Microscopy (T EM) images were
obtained with an Electron M icroscope (Carl Zeiss EM
10, Germany) according to methods published pre-
viously [8]. Briefly, the method is based on the fixation
of alginate microcapsules with a 2.5% glutaraldehyde
solution (Serva, Germany) dissolved in a buffer solution
composed of 9 g/l NaCl (Carl Roth, Germany), 5.55 g/l
CaCl
2
(Merck, Germany) and 10.46 g/l of Mops buffer
(Carl Roth, Germany). After overnight fixation (4°C),
alginate microcapsules were saturated with 2.0% (w/v)
agarose (Carl Roth, Germany), and fixed again with 2.5%
glutaraldehyde at 4°C for 1 h. Capsules were rinsed
three times for 20 min with the buffer solution. Post-
fixation was perfor med by using 1.0% osmium tetroxide
(Merck, Germany) at 4°C (2 × 1h), and posterior
embedded in Durcupan (Sigma-Aldrich, Germany).
Ultrathin s ections were stain ed with uranyl acetate an d
lead citrate (Serva, Germany) [8].
The total number of TEM pictures o btained was 72,
assuming a random distribution of cells within the algi-
nate capsules.
Textural properties of cell-free alginate microcapsules [4]
Measurements were carried out after drying the micro-
capsules in CO
2
beyond the critical point. N
2
adsorp-
tion-desorption isotherms were collected using a
Micromeritics ASAP2010 gas adsorption analyzer at
77K, after degassing the samples at 298K overnight on a
vacuum line. The Brunauer-Emmet-Teller (BET) specific
surface area was evaluated using adsorption data in a
relative pressure range, 0.05 to 0.2 [9]. Alginate matrix
pore size distribution was calculated on the basis of the
desorption branches using the Barret-Joyner-Halenda
method (BJH) [10].
Cell culture
HepG
2
cells (obtained from the departmental cell bank
of the Stem Cell Biology laboratory, University of Leip-
zig, Germany) were cultivated in DMEM (Biochrom,
Germany) supplem ented with 15% v/v foetal b ovine
serum (GIBCO, Scotland), 100 ng/ml sodium pyruvate
(Sigma-Aldrich, Germany) and 50μg/ml Gentamycin
(PAA laboratories, Austria).
Cell encapsulation
HepG
2
cells were immobilized in 0.8% and 1.4% w/v
alginate-CaCl
2
microcapsule s of 500μm di ameter
according to methods described previously [4,8]. A com-
mercially available encapsulation system (Innotech, IE-
50R) with a 250μm nozzle was used. This system pro-
duces capsules with a diameter of up to 500μm. In all
cases, the initial number of immobilized HepG
2
per mL
alginate was 1.5·10
6
(approximately 100 cells per cap-
sule). The viability of the immobilized cells before the
process of encapsulation was determined by the Tripan
Blue exclusion method (Sigma-Aldrich, UK), where the
viability of HepG
2
reached 95%.
Determination of cell and/or aggregates sizes
Analysis of cells and/or aggregates radii was carried out
by using the program Axiovision (Car l Zeiss, Germany)
after images capture of cells and/or aggregates with an
Axiovert HRC camera (Carl Zeiss, Germany) mounted
on an inverted microscope (Zeiss Axiovert 200). Ana-
lyses of size distribution were carried out with a mini-
mum number of 200 capsules, which were placed in a 4
well plate containing 500 μL media, 0.05% v/v concen-
tration of Calcein A/M (Invitrogen, USA) and 0.25% v/v
of Ethidium homodimer I (Invitrogen, USA).
Image Analysis
Automated analysis of transmission electron microscopy
(TEM) was accomplished using the following protocol:
firstly, relatively high image-inherent contrast basically
makes automatic image segmentation (alginate vs. cav-
ities) straightforward by applying binarization using a
simple thresholding, however, preprocessing is required
in order to compensate for local contrast fluctuations,
so that image inhomogeneity correction using a high-
pass filter [11] was applied. Image noise was removed
doing a preserving edge-smoothing using total variation
filtering [12]. Additionally, coherence-enhancing shock
filtering [13] was done to further intensify all directed
alginate structures. Pre-processed TEM images were
then partitioned into algina te and cavity segments using
binarization. The minimum accepted lumen area was set
to approx. 275nm². Measurements of these binary
images were performed using an unsigned Euclidean
image distance transformation [14] providing for all
Leal-Egaña et al. Journal of Nanobiotechnology 2011, 9:24
/>Page 2 of 7
background pixels a respectiveshortestdistancetothe
surrounding alginate, thereby obtaining values of relative
radii of these cavities. The number of times the same
value was repeated is hereafter dubbed the frequency.
All distance transformation-based measurements were
accomplished along the skeleton between two o pposite
alginate fibrils. Discrete values of radii of the alginate
cavities are named in this paper as relative pore radius
(rpr). For images obtained after cell entrapment, we car-
ried out the protocol described above, followed by c or-
relating measurements of relative pore radii to the
perp endicular distance from the interface cell-biomater-
ial, assuming a maximum distance of 400 nm. This was
carried out by delineating the cell contour to generate a
mask, which was use d as a starting point for measure-
ments, again accomplished based on a computational
effective Euclidean distance transform. In order to
obtain a distribution of values in percent, rpr between
10 and 70 nm were grouped in a discrete cluster. All
image processing was accomp lished using the computer
algebra system MATHEMATICA
®
(Wolfram Research,
Inc., Urbana-Champaign, Illinois, USA) including the
Digital Image package written by Jens-Peer Kuska.
Similar to the measurements of relative pore’s radii,
after treatment of the images with the procedures
described previously, measurements of diameters of the
alginate fibrils were carried out by measuring the dis-
tan ce transform masked out along a fibril skeleton. The
precision of our method depends of the image resolu-
tion, where in case of the pictures used in this paper
(obtained with an amplification of 20000X), 1 pixel
represents 2.34 nm².
Results and Discussion
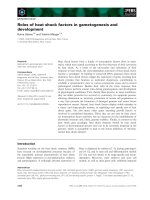
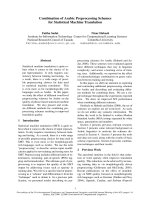
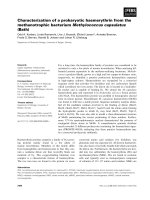
Figure 1 shows 2D images of the matrix nano-architec-
ture of the alginate hydrogel microcapsules. The hydro-
gel matrix is formed by a network of fibril-like
structures which can be identified and discriminated
from the surrounding cavities by computational pro-
grams. These cavities are named in this paper as relative
Figure 1 Illustration of the method to determine pore size distribution developed in this work. Image A depicts a hydrogel as it is
typically observed using transmission electron microscopy. Image B shows the results of the image segmentation after binarization. Image C
shows the result of a Euclidean distance transformation. Image D gives an overlay of the pore region image skeleton (red lines) with the original
image. Image skeletons are one-pixel wide center axes. They are defined via the set of inner pore pixels. The set is defined via local distance
maxima with respect to alginate segments. Scale bar corresponds to 250 nm.
Leal-Egaña et al. Journal of Nanobiotechnology 2011, 9:24
/>Page 3 of 7
pores (rp). In this work we measured the shortest dis-
tance between two opposite points of these fibril-like
structures, generating a simulated skeleton, which
allowed us to estimate the dimensions of the rp. Half o f
this distance, named in this paper as the relative pore
radius (rpr), was u sed as the criteria for defining the
sizes of these cavities. In addition, the frequency in the
determination o f the same values of rprs was analyzed,
with the purpose of studying the pore size distribution.
This analysis allows us to compare different concentra-
tions of hydrogels, and the pore size distribution mea-
sured with other standardized methods.
To analyze the reliability of our image analysis, the
values of the pore size distribution of cell-free microcap-
sules were compared with those obtained by nitrogen
physisorption on dried microcapsules. Although this
technique is widely used to measure surface areas in
powders and porous networks, it can also provide useful
information about pore size in the mesoporous range.
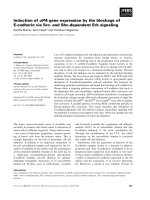
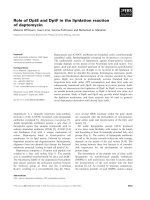
The isotherms obtained are presented in Figure 2, and it
is possible to observe a similar behaviour to those of
type IV and hysteresis type H
3
according to the IUPAC
classification [15], typical for mesoporous solids with
strong adsorbent-adsorbate interactions, indicating the
presence of large mesopores with a size distribution that
continues into the macropore domain (pores > 50 nm).
Type H
3
loops are usually given by adsorbents contain-
ing slit-shaped pores in good agreement with the
observed network cavities. The adsorption at low rela-
tive pre ssure allowed us to evaluate the specific surfa ce
area of the samples by the BET method, assuming a
monolayer of N
2
molecules covering 0.162 nm
2
. Specific
surface areas of 245 and 532 m
2
.g
-1
have been obtained
for capsules made of 0.8% and 1.4% w/v alginate respec-
tively, in a reproducible and well-correlated measure-
ment with the increase in biopolymer material per
capsule of similar dimensions (approximately 500 μmin
diameter).
Table 1 shows the comparison of the results obtained
in microcapsules made of 0.8% and 1.4% w/v alginate,
using our image analysis and the N
2
-adsorption-deso-
rption. The good agreement between the results of both
methods is clear, with errors lower than 5.0%. The
results in Table 1 indicate that alginate hydrogels have a
wide distribution of relative pores, with dimensions up
to roughly 70nm. Quantities of pores smaller than 10
nm correspond to approximately 50% in the case of algi-
nate 0.8% w/v, and approximately 60% in the case of
alginate 1.4% w/v microcapsules, indicating that both
matrices seem to be very similar in terms of pore size
distribution. Beside the determination of the dimensio n
of the cavities forming the alginate matrix, our metho-
dology allowed us to determine the alginate fibril-like
structure w idth, which is higher in the c ase of alginate
1.4% than in the capsules made of 0.8% w/v (Table 2).
It is important to note that although the hydrogel
matrix allows easy diffusion of several nutrients with
small molecular we ight (e.g. glucose, oxygen), the pre-
sence of a high populat ion of pores smaller of 10 nm
could restrict t he diffusion of some proteins, such as
albumin and/or hemoglobin (Stokes radius of 3.1-3.5
nm and 2.4 nm respectively) [16].
It is important to remark that the sensitivity of our
method r elies on the micrograph image resolution.
Thus, the use of image analysis becomes a powerful
strategy for the analysis of meso- and nano- porous
Figure 2 N
2
adsorption (black filled symbols) - desorption
(unfilled symbols) at 77K isotherms of supercritical CO
2
dried
capsules made of 0.8% (triangles) and 1.4% w/v (circles).
Table 1 Comparison of values of relative pore radius (rpr) determined by N
2
adsorption-desorption and image
analyses in cell-free microcapsules made of 0.8% and 1.4% w/v alginate
Range rpr (nm) 0.8% w/v Alginate 1.4% w/v Alginate
N
2
-adsorption (%) Image analysis (%) N
2
-adsorption (%) Image analysis (%)
rpr ≤ 10 48.9 ± 1.3 49.4 ± 2.3 59.8 ± 1.5 62.8 ± 1.8
10 < rpr < 20 15.4 ± 1.1 16.7 ± 2.3 16.1 ± 1.2 19.9 ± 1.1
20 < rpr < 25 13.3 ± 1.0 11.1 ± 2.2 8.9 ± 1.0 9.4 ± 1.6
25 < rpr < 40 11.3 ± 0.8 9.3 ± 1.9 8.8 ± 0.7 4.7 ± 0.4
40 < rpr < 70 9.0 ± 0.5 11.0 ± 0.7 5.3 ± 0.5 2.9 ± 0.3
70 < rpr 2.2 ± 0.3 3.0 ± 0.3 1.1 ± 0.2 1.0 ± 0.2
Leal-Egaña et al. Journal of Nanobiotechnology 2011, 9:24
/>Page 4 of 7
materials, presenting clear advantages to other strategies
for characterization of textural properties of hydrogels.
After characterization of cell-free alginate hydrogel,
HepG
2
cells were entrapped in microcapsules made of
0.8% and 1.4% w/v alginate, and culture d for 6 days,
analyzing aggregation and proliferation as increases in
the size of single cells and aggregates. Since alginate
lacks domains for proteases, entrapped cells cannot
migrate into the matrix, generating spherical aggregates
after proliferation, which can be analyzed by measuring
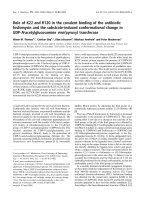
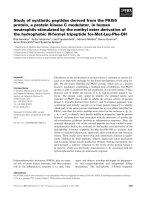
their diameters [17]. As Figure 3 shows, cells entrapped
in 0.8% w/v microcapsules increased their size much
more than those immobilized in 1.4% w/v.
Measurements of rp sizes and frequency were carried
out on days 0, 3 and 6, in a similar manner to the deter-
minations performed in cell-free hydrogels. These values
were correlated with a third parameter measured per-
pendicularly inwards from the alginate matrix to the
cell. This analysis allows us to quantify the extension
(depth) to which the cells can modify the material
matrix in terms of pore size distribution.
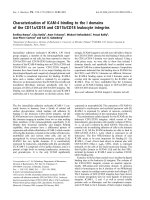
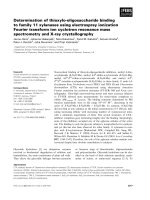
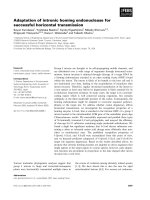
Our results show significant modifications in the pat-
tern of pore size distribution, mostly observed in case of
cells entrapped in hydrogels made of 0.8% alginate,
where an increase in the presence of pores smaller than
10 nm was clearly observed ( Figure 4). Furthermore,
these modifications were observable up to depths of 40
nm from the interface, with the higher coarsening
detected within the first 20 nm from the interface. By
contrast, only slight deformations were observed in the
experiments performed with hydrogels made of 1.4% w/
v alginate (approximately 40 nm from the interface),
where coarsening of pores seems to be much slower and
more homogeneous than in the softer capsules.
The higher resistance of the more highly concentrated
hydrogel to mechanical deformation can be explained
by increases in both the p ercentage of pores smaller
than 10 nm, and the thickness of the alg inate fibril-like
structures, due to increased crosslinking of alginate
polymer.
According to r ecent publications, immobilized cells
within alginate hydrogels are submitted to compression
forces which lead single cells to generate cellular micro-
spheroids [18]. Thus, analyses of radial deformation of
the alginate matrix due to cell growth and the conse-
quent modificat ion of the pore size distrib ution pattern
can give us very important information about modula-
tion of rates of molecular diffusion of nutrients/waste
products, information which is not only extremely useful
for biomedical applications [1], bu t also for studying the
development of primary tumours in tumor-like micro-
capsules [2,19], as mentioned previously.
It is important to mention that methods for cell fixa-
tion can slightly diminish cell size, and therefore a short
distance between cells and the material interface can be
observed in several cases. Nevertheless, as shown in Fig-
ures 1 and 4, this does not affect the pore size distribu-
tion and the textural proper ties of the matrix material,
ensuring the reliability of our method. As a final remark,
it is important to note that although our methodo logy
has been not tested with o ther polymers, because it is
based on image analysis of TEM pictures, studies of
modifications of the cell-hydrogel interface may be pos-
sible in different types of hydrogels which maintain their
textural properties after fixation.
Table 2 Comparison of values of fibril-like radii (flr)
determined by image analyses in alginate microcapsules
made of 0.8% and 1.4% w/v alginate
Range (nm) 0.8% w/v Alginate(%) 1.4% w/v Alginate(%)
flr ≤ 2.34 48.7 ± 2.8 30.3 ± 2.4
2.34 < flr < 4.68 48.9 ± 3.2 64.0 ± 3.1
4.68 < flr < 7.02 2.3 ± 0.3 5.5 ± 0.5
7.02 < flr < 9.36 0.1 ± 0.01 0.3 ± 0.1
9.36 < flr 0.0 ± 0.0 0.0 ± 0.0
Figure 3 Sizes of HepG
2
cell population (individual living cell s
and aggregates) within microcapsules made of 0.8% (A) and
1.4% w/v (B) alginate, during days 0 (yellow triangles), 3 (filled
circles), and 6 (open circles) of culture.
Leal-Egaña et al. Journal of Nanobiotechnology 2011, 9:24
/>Page 5 of 7
Acknowledgements
The authors thank Dr. John Hardy and Eileen Lintz for proof-reading and
constructive criticism during the preparation of this manuscript. We
gratefully acknowledge the financial support provided by the Spanish
Government, Department of Science and Innovation, MICINN (Plan Nacional
BIO2009-13903-C02-02). Aldo Leal-Egaña is grateful for the financial support
by a grant from the German Academic Exchange Service (Deutscher
Akademischer Austauschdienst). Ulf-Dietrich Braumann is grateful for the
long and fruitful cooperation with Dr. Jens-Peer Kuska who died in 2009 at
the young age of 45.
Author details
1
Department of Cell Technology and Applied Stem Cell Biology,
Biotechnology and Biomedicine Centre (BBZ), University of Leipzig.
Deutscher Platz 5, 04103, Leipzig, Germany.
2
Institute for Medical Informatics,
Statistics, and Epidemiology (IMISE), University of Leipzig, Härtelstraße 16-18,
04107 Leipzig, Germany.
3
Interdisciplinary Center for Bioinformatics (IZBI),
University of Leipzig, Härtelstraße 16-18, 04107 Leipzig, Germany.
4
Materials
Science Institute of Seville (Spanish National Research Council (CSIC) -
University of Seville), Centro de Investigaciones Científicas Isla de la Cartuja,
Avda. Americo Vespucio no. 49, 41092 Sevilla, Spain.
5
Networking Research
Center on Bioengineering, Biomaterials and Nanomedicine (CIBER-BBN),
Spain.
6
Institute of Anatomy, Medicine Faculty, University of Leipzig,
Liebigstrasse 13, 04103 Leipzig, Germany.
Authors’ contributions
ALE conceived and designed the method, performed the experiments and
interpreted the data. UDB performed the image analysis and conceived the
method. ADC performed the textural analysis and interpreted the data. MN
obtained the electron microscopy images. ALE, ADC, and UDB prepared the
manuscript. AB and ADC critically revised the intellectual content of the
manuscript and gave the final approval of the version to be published. All
Authors read and approved the final manuscript.
Competing interests
The authors declare that they have no competing interests.
Received: 20 February 2011 Accepted: 27 May 2011
Published: 27 May 2011
References
1. Sgroi A, Mai G, Morel P, Baertschiger RM, Gonelle-Gispert C, Serre-Beinier V,
Buhler LH: Transplantation of encapsulated hepatocytes during acute
liver failure improves survival without stimulating native liver
regeneration. Cell Transplant 2011.
2. Yu L, Chen M, Cheung K: Droplet-based microfluidic system for
multicellular tumor spheroid formation and anticancer drug testing. Lab
Chip 2010, 10:2424-2432.
3. Vay K, Scheler S, Friess W: New insights into the pore structure of poly(d,
l-lactide-co-glycolide) microspheres. Int J Pharm 2010, 402:20-6.
4. Leal-Egaña A, Díaz-Cuenca A, Bader A: Determination of the decay rate
constant for hepatocytes immobilized in alginate microcapsules.
J Microencapsul 2010, 27:86-93.
5. Gautier A, Carpentier B, Dufresne M, Vu Dinh Q, Paullier P, Legallais C:
Impact of alginate type and bead diameter on mass transfers and the
metabolic activities of encapsulated C•A cells in bioartificial liver
applications. European Cells and Materials 2011, 21:94-106.
6. Guilherme M, Fajardo A, Moia T, Kunita M, Gonçalves M, Rubira A,
Tamb ourg i E: Porous nanocomp osite hydrogel of vinyled
montmorillonite-crosslinked maltodextrin-co-dimethylacrylamide as a
highly stable polymer carrier for controlled release systems. Eur
Polymer J 2010, 46:1465-1474.
Figure 4 Analysis of transmission electron microscopy images of the cell biomaterial interface on microcapsules made of 0.8% (A, B,
and C) and 1.4% w/v (D, E and F), at day 0 (A and D), 3 (B and E), and 6 (C and F). Arrows show zones where clear constriction of the
alginate interface due to cell proliferation is observed. Scale bar represents 10 nm.
Leal-Egaña et al. Journal of Nanobiotechnology 2011, 9:24
/>Page 6 of 7
7. Seck T, Melchels F, Feijen J, Grijpma D: Designed biodegradable hydrogel
structures prepared by stereolithography using poly(ethylene glycol)/
poly(d,l-lactide)-based resins. J Control Release 2010, 148:34-41.
8. Leal-Egaña A, Heinrich JM, Smith M, Nowicki M, Bader A: A simple non-
destructive method for the fixation and immunostaining of cultured
cells encapsulated in alginate. Biotechnol Appl Biochem 2006, 44:143-150.
9. Rouquerol F, Rouquerol J, Sing K: Adsorption by powders and porous
solids: principles, methodology and applications. London, Academic
Press; 1999.
10. Sing K, Williams R: Empirical Procedures for the Analysis of Physisoption
Isotherms. Adsorption Science and Technology 2005, 23:839-853.
11. Gonzalez R, Woods R: Digital Image Processing New Jersey: Pearson
Education; 2008.
12. Chan T, Osher S, Shen J: The digital TV filter and nonlinear denoising. In T
Image Process. Volume 10. IEEE; 2001:231-241.
13. Weickert J: Coherence-enhancing shock filters. LNCS 2003, 2781:1-8.
14. Saito T, Toriwaki J: New algorithms for n-dimensional Euclidean distance
transformation. Pattern Recogn 1994, 27:1551-1565.
15. Sing K, Williams R: Physisorption hysteresis loops and the
characterization of nanoporous materials. Adsorpt Sci Technol 2004,
22:773-782.
16. Ralla K, Sohling U, Riechers D, Kasper C, Ruf F, Scheper T: Adsorption and
separation of proteins by a smectitic clay mineral. Bioprocess Biosyst Eng
2010, 33:847-861.
17. Gevertz J, Gillies G, Torquato S: Simulating tumor growth in confined
heterogeneous environments. Phys Biol 2008, 5:036010.
18. Cheng G, Tse J, Jain R, Munn L: Micro-environmental mechanical stress
controls tumor spheroid size and morphology by suppressing
proliferation and inducing apoptosis in cancer cells. PLoS one 2009, 4:
e4632.
19. Hutmacher D: Biomaterials offer cancer research the third dimension. Nat
Mater 2010, 9:90-93.
doi:10.1186/1477-3155-9-24
Cite this article as: Leal-Egaña et al.: Determination of pore size
distribution at the cell-hydrogel interface. Journal of Nanobiotechnology
2011 9:24.
Submit your next manuscript to BioMed Central
and take full advantage of:
• Convenient online submission
• Thorough peer review
• No space constraints or color figure charges
• Immediate publication on acceptance
• Inclusion in PubMed, CAS, Scopus and Google Scholar
• Research which is freely available for redistribution
Submit your manuscript at
www.biomedcentral.com/submit
Leal-Egaña et al. Journal of Nanobiotechnology 2011, 9:24
/>Page 7 of 7