Encyclopedia of Smart Materials (Vols 1 and 2) - M. Schwartz (2002) WW Part 12 doc
Bạn đang xem bản rút gọn của tài liệu. Xem và tải ngay bản đầy đủ của tài liệu tại đây (2.63 MB, 70 trang )
P1: FCH/FYX P2: FCH/FYX QC: FCH/UKS T1: FCH
PB091-S-DRV-I January 24, 2002 15:42
892 SELF-DIAGNOSING OF DAMAGE IN CERAMICS AND LARGE-SCALE STRUCTURES
Glass fiber
Carbon-fiber - glass-fiber-reinforced plastics
Vinyl ester resin Carbon fiber
(a)
Glass fiber
Vinyl ester resin Vinyl ester + carbon particles
Carbon-particle - glass-fiber-reinforced plastics
(b)
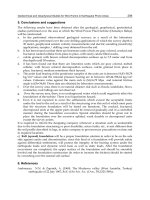
Figure 1. Schematics of the structural design for CFGFRP (a)
and CPGFRP (b) in the shape of rod.
The CFGFRP and CPGFRP consisting of unidirectional re-
inforced fiber have a diameter of 3 mm.
The schematic structural designs for the CMC are
shown in Fig. 2. The composites were fabricated by the
filament winding method using Si
3
N
4
particles (Ube In-
dustries Co., Ltd. SN-COA) as the matrix and SiC fiber
(Nippon Carbon Co., Ltd. NL-401) as the reinforcement for
strengthening or toughening the composite. A portion of
the fibers was replaced with tungsten wire (Nippon tung-
sten Co., Ltd. φ 30 µm). The conductive particles of TiN
(Japan New Metals Co., Ltd.) were dispersed in part of the
Si
3
N
4
matrix. The volume fraction of the conductive phase,
which includes 40 vol% of TiN particles, was 0.13%. These
conductive phases wereformed near the surface (500 µmin
Si
3
N
4
SiC fiber
Tungsten wire
(conductive fiber)
Si
3
N
4
+TiN
(conductive phase)
Si
3
N
4
-SiC fiber-W fiber
Si
3
N
4
-SiC fiber-(Si
3
N
4
+ TiN)
(a)(b)
Figure 2. Structural design for CMC containing tungsten wire (a) and TiN particles (b).
depth) which was the tensile surface in the bending tests.
These composites were hot-pressed under 40 MPa at 1773
KinN
2
atmosphere for one hour. The sintered specimens
were cut into 3 × 4 × 45 mm bars for bending test pieces.
Self-Diagnosis Function of FRP
Figure 3 presents two scanning electron micrographs of a
polished transverse section and of a longitudinal section of
CPGFRP (2). The circles in Fig. 3(a) and the white lines in
Fig. 3(b) denote glass fibers. The bright gray flakes are the
dispersed carbon particles. Note that the carbon particles
are sufficiently dispersed in the matrix and that the matrix
is well impregnated between glass fibers. This means that
a percolation structure consisting of conductive particles
has been successfully achieved.
The self-diagnosis functions of these materials were
evaluated through simultaneous measurements of stress
and electrical resistance change as a function of applied
strain in tensile loading tests. The resistance change was
defined as relative change in resistance (R − R
0
)/R
0
, indi-
cated by R/R
0
in which R
0
denotes initial resistance be-
fore loading. The two types of loading selected were (1)
a normal tensile test until specimen fracture and (2) a
cyclic loading–unloading test below the maximum stress
level. Figure 4 shows the electrical resistance changes and
the applied stress for CFGFRP and CPGFRP as a func-
tion of the applied strain in the tensile tests. The stresses
in both specimens were increased linearly in proportion to
the strains until fracture occurred of the carbon fiber or the
glass fiber. The CFGFRP indicates a slight change in resis-
tance below a 0.6% strain due to the elongation of carbon
fiber and shows a tremendous change around 0.7% strain
owing to the fracture of the conductive fiber; namely the re-
sistance of CFGFRP exhibits a nonlinear response to the
applied strain as shown in Fig. 4(a). The initial resistance
R
0
for CPGFRP was higher than that for CFGFRP because
of a slight electrical contact between carbon particles in
the percolation structure. As can be seen from Fig. 4(b),
the CPGFRP indicates a linear increase in resistance with
increasing tensile strain. The response of the resistance to
applied strain appears at 0.01% strain (100 µ strain) or
lower. The linear increase in the resistance continues un-
til the fracture of the composite. Comparing Fig. 4(a) with
(b) illustrates CPGFRP’s higher sensitivity at the small
strain level and the wider detectable strain range com-
pared to CFGFRP. These results mean that the percolation
P1: FCH/FYX P2: FCH/FYX QC: FCH/UKS T1: FCH
PB091-S-DRV-I January 24, 2002 15:42
SELF-DIAGNOSING OF DAMAGE IN CERAMICS AND LARGE-SCALE STRUCTURES 893
(a)
(b)
Figure 3. SEM photographs of polished transverse section (a) and longitudinal section (b) of
CPGFRP with unidirectional glass fiber.
structure formed with the carbon particle enables more
sensitive and adaptable diagnosis of damage than the
structure consisting of carbon fiber. The strong response of
resistance for CPGFRP was attributed to a local break in
electrical contact between carbon particles because of the
micro crack formation in the matrix or in the rearrange-
ment in the percolation structure under tensile stress. It
should be noted that the dispersion of the carbon parti-
cles had no effect on the strength of the composite, since
the fracture stress and mode for CPGFRP were similar to
those of GFRP without carbon particles.
Figure 5 shows the change of resistance to the applied
strain as a function of time in the cyclic loading tests for
CFGFRP and CPGFRP. These FRP were loaded and un-
loaded cyclically under a gradual increase in stress. The
resistance of CFGFRP showed poor response below 0.6%
strain and a drastic increase above 0.7% strain as shown
in Fig. 5(a). From Fig. 5(b), it can be seen that the change in
resistance of CPGFRP corresponded well with strain fluc-
tuation (3). It is noteworthy that the resistance decreased
400
350
Stress
∆R/Ro
R
0
= 9 Ω
300
250
200
Stress / MPa
∆R/R
0
/ %
150
100
50
0
50
40
30
20
10
0
0 0.5 1
Strain / %
1.5 2
(a)
400
(b)
350
Stress
∆R/Ro
R
0
= 1200 Ω
300
250
200
Stress / MPa
∆R/R
0
/ %
150
100
50
0
50
40
30
20
10
0
0 0.5 1
Strain / %
1.5 2
Figure 4. Changes in electrical resistance (solid line) and applied stress (dashed line) as a function
of applied strain in tensile tests for CFGFRP (a) and CPGFRP (b).
but did not completely return to zero at the unloading
state. The residual resistance in CPGFRP appeared after
the application of 0.2% strain, and then increased with
the increase to the maximum applied strain. The maxi-
mum resistance during loading, indicated by R
max
, and
the residual resistance change after unloading, denoted by
R
res
, were arranged according to the maximum strain ap-
plied in the past as shown in Fig. 6. The residual resistance
of CFGFRPappeared aroundthe 0.4%strain and increased
discontinuously above 0.6%. The appearance of residual re-
sistance for CFGFRP owing to fracture of the carbon fiber
was limited in a narrow strain range. The change in resid-
ual resistance of CPGFRP correlated closely with previous
maximum strain over the wide strain range as shown in
Fig. 6(b), suggesting that the CPGFRP has the ability to
diagnose the maximum strain based on measurements of
past residual resistance at an unloading state (3). A com-
parison of Fig. 6(a) and (b) shows that the CPGFRP per-
forms a more useful diagnostic function of damage history
over the wide strain range than does the CFGFRP.
P1: FCH/FYX P2: FCH/FYX QC: FCH/UKS T1: FCH
PB091-S-DRV-I January 24, 2002 15:42
894 SELF-DIAGNOSING OF DAMAGE IN CERAMICS AND LARGE-SCALE STRUCTURES
2
1.5
Strain
∆R/Ro
R
0
= 9 Ω
1
0.5
0
Strain / %
∆R/Ro
/ %
40
35
30
25
20
15
10
5
0
0
10 20
Time / min
30 40 50
(a)
2
1.5
Strain
∆R/Ro
R
0
= 1200 Ω
1
0.5
0
Strain / %
∆R/Ro
/ %
40
35
30
25
20
15
10
5
0
0
20 40
Time / min
60 80 100
(b)
Figure 5. Change in resistance (solid line) and applied strain
(dashed line) as a function of time in cyclic loading test for the
CFGFRP (a) and CPGFRP (b).
The microstructure of CPGFRP after the loading–
unloading cycle induced 0.6% strain and 2.1% strain was
observed by scanning electron microscopy (SEM) as shown
in Fig. 7 (2). Clearly, the number of micro cracks in the ma-
trix increased with the increase in applied strain. Although
the elongation of CPGFRP affected the elasticity after un-
loading, the percolation structure did not return reversibly
(a)
(b)
Figure 7. Scanning electron micrographs of CPGFRP after removing 0.6% strain (a) and 2.1%
strain (b).
35
(a)
25
30
20
15
∆Rmax, ∆Rres / %
10
5
0
0 0.5 1
Strain / %
1.5 2
∆Rmax
∆Rres
35
(b)
25
30
20
15
∆Rmax, ∆Rres / %
10
5
0
0 0.5 1
Strain / %
1.5 2
∆Rmax
∆Rres
Figure 6. Maximum resistance change at loading state andresid-
ual resistance change at unloading state as a function of applied
strain in cyclic loading tests for the CFGFRP (a) and CPGFRP (b).
to the initial state because of the micro crack formation
in the matrix. The irreversible change in the percolation
structure in the conductive phase was partly responsible
for the appearance of obvious residual resistance over a
wide strain range.
P1: FCH/FYX P2: FCH/FYX QC: FCH/UKS T1: FCH
PB091-S-DRV-I January 24, 2002 15:42
SELF-DIAGNOSING OF DAMAGE IN CERAMICS AND LARGE-SCALE STRUCTURES 895
(a)
(b)
500 µm
Figure 8. SEM cross sections of polished CMC specimens. The arrows point to the tungsten wire
(a) or to the area containing TiN particles (b).
Self-Diagnosis Function of CMC
The conductive phases in the CMC observed by SEM
are shown in Fig. 8 (4). Three tungsten wires were em-
bedded near the tensile surface. The conductive phase
containing dispersed TiN particles and SiC fibers was
observed as the bright area. Some voids (white bareas)
appeared in the conductive phase; however, these defects
were thought to be insignificant for the damage diagno-
sis function because the amount was negligible. The inter-
face between these conductive phases and the Si
3
N
4
matrix
did not show a remarkable reaction and exhibited good
adhesiveness.
The self-diagnosis functions of the CMC were evaluated
by simultaneous measurements of stress and electrical re-
sistance change R as a function of applied strain in four-
point bending tests. The loading was performed two ways:
(1) a normal bending test until specimen fracture and (2)
cyclic loading–unloading tests below the maximum stress
level. The dependence of the applied load and change in re-
sistance on displacement for the CMCis shown in Fig. 9(4).
300
(a)
200
Load
R
0
= 280 Ω
∆R
100
Load / N
∆R / Q
0
0 0.1 0.2
Displacement / mm
0.3 0.4
0.6
0.4
0.2
0
300
(b)
200
R
0
= 62 Ω
100
Load / N
∆R / Q
0
0 0.1 0.2
Displacement / mm
0.3 0.4
0.6
0.4
0.2
0
Figure 9. Change in load and resistance as a function of displacement in the four-point bending
tests for the CMC containing tungsten wire (a) or TiN particles (b).
Similar fracture behavior peculiar to CMCs was observed
in both composites in which a part of the ultimate load
was kept after fracture at a displacement of about 0.1 mm.
The peculiar load–displacement curve explained from the
extraction of SiC fibers from the Si
3
N
4
matrix is shown
in Fig. 10. The difference in the ultimate load and in the
load-displacement curve for both composites was thought
to be due to the uneven quality of SiC–Si
3
N
4
phase, and
not to the difference in conductive phase. The nonlinear re-
sponse ofresistance changes to displacement was exhibited
in both composites. The CMC with tungsten wire showed
a slight change in resistance in a small deformation, and
then a drastic change was accompanied by their own frac-
ture as shown in Fig. 9(a). The CMC containing TiN parti-
cles exhibited a distinct change in resistance from a small
displacement to the fracture in the composite as shown
in Fig. 9(b). These results suggest that the monitoring of
resistance for CMCs with percolation structures is advan-
tageous for diagnosing damages to the composites.
Figure 11 shows the hysteresis of resistance change
in loading–unloading bending tests under the ultimate
P1: FCH/FYX P2: FCH/FYX QC: FCH/UKS T1: FCH
PB091-S-DRV-I January 24, 2002 15:42
896 SELF-DIAGNOSING OF DAMAGE IN CERAMICS AND LARGE-SCALE STRUCTURES
(a)
100 µm
(b)
200 µm
Figure 10. SEM images of fractured surface for the CMC specimens containing tungsten wire
(a) or TiN particles (b).
load (4). The resistance of CMCs containing tungsten wire
showed no change at the loading and unloading state,
which was expectedfrom Fig. 9(a). The applied load of some
50% of the ultimate load induced the increase in the resis-
tance for the CMCs containing TiN particles, and then the
increased resistance remained at about 80% of the maxi-
mum resistance after unloading. It should be noted that
the loading–unloading cycle induced elastic deformation
for the CMCs without residual strain. Hence, the residual
resistance was thought to be due to irreversible local frac-
ture in the conductive phase. The residual phenomenon in
resistance change for theCMCs was more remarkable than
that for FRP shown in Fig. 5(b), which was attributed to
the brittleness of the ceramic in the matrix.
Figure 12 presents an attempt at repeatedly varying
the resistance for the CMC with tungsten wire or TiN
200
(a)
150
100
50
Load / N
0
0 0.02 0.04 0.06
Displacement / mm
R
0
= 218 Ω
0.5
1
0
∆R / Q
200
(b)
150
R
0
= 57 Ω
100
50
0.5
1
0
Load / N
∆R / Q
0
0 0.02 0.04 0.06
Load
∆R
Displacement / mm
Figure 11. Change in load and resistance as a function of displacement in the loading–unloading
tests for the CMC containing tungsten wire (a) or TiN particles (b). The applied maximum load
was 150 kN.
particles in cyclic bending test. The applied load was,
however, kept constant at 150 kN. The residual resis-
tance for the CMCs with tungsten wire indicated no
change, while that for the composites containing TiN par-
ticles after unloading rapidly increased up to 10 cycles.
It should be noted that the residual resistance propor-
tionally increased with an increasing number of repeti-
tions after 20 cycles. The linear response of residual re-
sistance was thought to be attributed to the propagation of
micro cracking in the conductive Si
3
N
4
–TiN phase. This
result further confirms that the CMCs containing TiN
particles have the ability to diagnose cumulative damage
to the composite through measurements of the residual
resistance.
The electrical conductive FRP and CMC were de-
signed and produced by adding a conductive fiber or
P1: FCH/FYX P2: FCH/FYX QC: FCH/UKS T1: FCH
PB091-S-DRV-I January 24, 2002 15:42
SELF-DIAGNOSING OF DAMAGE IN CERAMICS AND LARGE-SCALE STRUCTURES 897
2.0
1.6
1.2
0.8
∆R / Ω
Load / N
0.4
0
100
0
02040
Number of repetitions / cycles
60 80
TiN particles
Tungsten wire R
0
= 102 Ω
R
0
= 37 Ω
100
Figure 12. Change in resistance as a function of number of repe-
titions in the cyclic bending tests for the CMC containing tungsten
wire and TiN particles.
particles, and the self-diagnosis functions for these con-
ductive composites were investigated. Compared with
the composites that include conductive fiber or wire the
composites with the percolation structure consisting of
conductive particles were found to be capable of diag-
nosing deformation or damage in the composites. The
composites containing carbon particles appeared capa-
ble of diagnozing damage at the sensitivity level of a
small strain and in a detectable strain range. Concern-
ing the detectable strain level, the FRP showed an ex-
cellent response to the resistance change and to the
applied strain. This is a suitable range for the health
monitoring of structural materials such as concrete con-
struction. It was also found through measurements of the
residual resistance that the FRP composites are capable
of memorizing the maximum applied strain or stress. The
CMCs with percolation structures consisting of TiN par-
ticles exhibited superior resistance to small deformation
changes. It should finally be noted that the CMC materials
proved capable of diagnosing cumulative damage for the
composites by evaluating the residual resistance, and that
these self-diagnosis functions are easily obtained by simple
measurements of electrical resistance.
APPLICATION OF THE SELF-DIAGNOSIS COMPOSITE
TO CONCRETE STRUCTURES
A new type composite was developed that had a self-
diagnosis function for health monitoring and damage
detection inmaterials (1–7).The composite, which haselec-
trical conductivity as well as reinforced fibers, provides
a signal of electrical resistance change corresponding to
the degree of damage in the material. This self-diagnosis
composite offers also some advantages in properties, cost,
and simplicity, compared with other materials or systems
such the an optical fiber and the strain gauge. A concrete
structure is the best application for the self-diagnosis
composite because the composite has a good sensitivity to
micro cracking in concrete materials, shows high strength
in reinforcing concrete material, and provides ease both in
its attachment and in the measurement of electrical con-
ductivity. The study was aimed at determining whether
the composite was useful for measuring damage and frac-
ture in concrete blocks and piles. Particularly, the appli-
cation into concrete piles was treated as a typical exam-
ple of concrete construction limiting the direct observation
of damage or fracture after a serious load has been ap-
plied in its utilization. Also investigated, by bending tests
and electrical resistance measurements were the function
and performance of the composites when embedded in mor-
tar/concrete blocks and concrete piles.
Specimen and Experiment
Two kinds of glass-fiber reinforced plastics composites
were fabricated in this study. The first composite included
carbon fibers substituted for some of the glass fibers; its
electrical conductivity was calledCF. The second composite
involved carbon powders dispersed in a part of the plastic
that formed the percolation structuresas a conductivepath
(CP). The CF and CP composites were embedded into mor-
tar specimens and concrete specimens reinforced by steel
bars or rods by the following procedures. Figure 13(a–c)
shows the structure and arrangement of the composites
in the three concrete specimens types. The first type is a
rectangular mortar block specimen with the CP compos-
ites. The second type is a rectangular concrete block speci-
men with the CP and CF composites and two steel bars.
The third type is a concrete pile specimen having the CP
composites and 16 steel bars. The pile type specimens have
been pre-stressed at 14.3 MPa applied by the tension stress
of the steel bars, while the block type was free from pre-
stress.
Figure 14 illustrates the methods used for bending tests
for the block and the pile type specimens with different
lengths and distances. The electrical resistance change
(R/R
0
, where R is an increase of resistance and R
0
is an initial resistance) of the composites was measured
simultaneously in the loading tests. The strain gauge
measurement attached on the tension-side surface of the
specimen was also used. Photographs the actual bending
tests for the block and the pile specimens are shown in
Fig. 15.
Mortar Block Tests
The CP composite was embedded in the tensile side of
the mortar specimens in order to demonstrate the self-
diagnosis function. Figure 16 shows the applied load and
resistance change of the CP composite as a function of
displacement in a bending test. The embedded CP com-
posite was located 8 mm apart from the tensile sur-
face of the mortar. The load–displacement curve indicates
discontinuous changes at points A and B, which corre-
spond tothe crack formation and propagationin the mortar
specimen, respectively. The crack formation and propaga-
tion are shown in photographs of the mortar specimen.
The resistance of the CP composite begins to increase
P1: FCH/FYX P2: FCH/FYX QC: FCH/UKS T1: FCH
PB091-S-DRV-I January 24, 2002 15:42
898 SELF-DIAGNOSING OF DAMAGE IN CERAMICS AND LARGE-SCALE STRUCTURES
40
40
20
8
(a)
Type - 1
CF (5 mm φ)
CP (5 mm φ)
Steel (9 mm φ)
unit: mm
100
100
50
12
9
17
21
21
(b)
Type - 2
400
(c)
270
34
12
Type - 3
Figure 13. Structure and arrangement of the composites in the three types of concrete specimens.
(a) Type-1, a rectangular mortar block specimen with the CP composite. (b) Type-2, a rectangular
concrete block specimen with the CP and CF composites. (c) Type-3, a concrete pile specimen with
CP composite.
D
1
D
2
L
Type Bending test L / mm D
1
/ mm D
2
/ mm D
3
/ mm
1 3 points 160 50 - 50
2 4 points 400 100 100 100
3 4 points 8000 3000 1000 3000
D
3
Figure 14. Different bending tests for the block-and-pile type
specimens with different length and distances corresponding to
type-1, type-2, and type-3.
slightly before crack formation. Note that the increase in
resistance appears simultaneously with the micro crack
formation and that a discontinuous resistance change
is generated in response to the crack propagation. The
residual resistance was observed in the FRP material af-
ter unloading at point D. The resistance change of em-
bedded CP composite corresponds well to the propagation
of damage inflicted on the mortar specimen. Once again,
the results demonstrate that the embedded CP composite
has the ability to diagnose micro crack formation/propa-
gation and loading history in cement-based structural
materials.
The behavior of residual resistance for the CP composite
embedded in a mortar specimen was investigated in detail
by cyclic bending tests. Figure 17 presents the hystere-
sis of resistance changes by cyclic loading–unloading tests
under 40% of ultimate load. The application of load caused
micro crack formation, and then the crack was closed at an
unloading state as shown in Fig. 17. It should be noted
that the crack was eliminated, but the behavior of the
micro crack induced residual resistance after unloading.
The application of higher load (60% of ultimate load) made
higher residual resistance after unloading. These results
suggested that the CP composite embedded in the mortar
specimen has theability to diagnose the closed micro crack,
namely the hysteresis of micro crack formation by evalu-
ation of the residual resistance even after the crack has
closed.
P1: FCH/FYX P2: FCH/FYX QC: FCH/UKS T1: FCH
PB091-S-DRV-I January 24, 2002 15:42
(a)
(b)
(c)
Figure 15. Bending tests in progress for the mortar block specimens (a), the concrete block speci-
mens (b), and the pile specimens (c).
0
1
2
3
4
5
6
7
0
5
10
15
20
25
30
35
0123
Load
B
A
D
C
0.5
1.5 2.5
3.5
∆R/R0 / %
Load / kN
Displacement / mm
R
0
= 4200 Ω
∆R/R0
(a)
(b)
(c)
(d)
Figure 16. Changes in resistance (solid line) and applied load (dashed line) in a bending test for
CPGFRP rod embedded in mortar specimen. These points (A–D) on the graph correspond to the
photographs of the mortar specimen.
899
P1: FCH/FYX P2: FCH/FYX QC: FCH/UKS T1: FCH
PB091-S-DRV-I January 24, 2002 15:42
900 SELF-DIAGNOSING OF DAMAGE IN CERAMICS AND LARGE-SCALE STRUCTURES
3
Load
∆R/R0
2.5
2
1.5
Load / kN
1
0.5
0
0 0.5
Displacement / mm
1 1.5
0
1
2
3
∆R/R0 / %
4
5
6
Loaded
Unloaded
Figure 17. Changes in resistance (dashed line) and applied load (solid line) in the cyclic loading–
unloading tests, under 40% of the ultimate load.
Concrete Block Tests
Figure 18 shows the results of load, strain, and R/R
0
of
CP and CF composites as a function of time in the bend-
ing test for the concrete block (6). The stain change, which
followed closely the loading curve, indicates that a mi-
cro crack formed at about 200µ strain and the steel bars
yielded atabout 1000µ strain.The straingauge was broken
in the loading test owing to the crack propagation in the
surface of the concrete specimen. The R/R
0
of the CP
composite is initiated at about 300 s, which corresponds to
the stage of crack formation. The R/R
0
of the CP compos-
ite increased with an increased load up to the maximum
load at about 1000s. The R/R
0
of CF is scarcely detected
until the high load level when it increases suddenly near
the maximum load. Both the CP and CF composites do not
break in the test because of their high strength and flexi-
bility. It should be noted that the CP composite shows good
sensitivity in the small stain range as well as a continuous
response in the wide strain range up to the final fracture
of the specimen.
Figure 19 provides the results of a cyclic loading test for
the block-type specimen (6). In all, eight cycles of loading
and unloading with an increased load level were carried
out in this test. The strain change and the R/R
0
of CP
composite responded well to the load curve from a lower
load level, while the R/R
0
of CF did not act until a higher
load was applied. It was also found that the CP composite’s
residual resistance appeared only after the cycles of the
medium load level.
The block specimen is shown in Fig. 20 (a–c) as it ap-
peared in the cyclic bending test (6). The cracks are clearly
initiated from the tension-side surface at a low load, and
they grow with an increased load level until the specimen
finally breaks owing to steel bar fracture.
Concrete Pile Tests
Figure 21 gives the results of the cyclic bending test for the
type-3 concrete pile specimen (6). The specimen included
only the CP composite because of the sensitivity it showed
under a small load, which was higher than that for the CF
composite as confirmed in Figs. 18 and 19. This test aimed
to increase the sensitivity of the CP composite, which is
arranged near the tension-side surface of the pile speci-
men. Figure 21(d) is the result from the enlarged R/R
0
axis of the CP composite in Fig. 21(c). The R/R
0
of the
CP composite in the pile responds well in a wide range
of loading as shown in Fig. 21(c). The CP composite lo-
cated near the tension-side surface of the pile specimen
indicates good sensitivity in the lower load levels as shown
in Fig. 21(d). The R/R
0
of the CP composite in the lower
load range is very similar to the strain change in Fig.
21(b), which means that the CP composite can signal a
smaller strain before the crack forms in the pile surface.
In these pile tests there is no clear indication of resid-
ual resistance phenomena as detected in the block tests,
probably because of the effect of pre-stress in the pile
specimens.
The appearances of the pile specimen in the cyclic bend-
ing test are shown in Fig. 22(a–c) (6). The crack forms at
a low load, its growth occurs with an increased load, and
finally the pile fractures after the test has ended.
Performance of the Self-diagnosis Composites
In the bending tests of the concrete block, the CP compos-
ite produced good results compared to the CF composite.
Remarkably, the electrical resistance of the CP compos-
ite increased under a small strain to detect a micro crack
formation at about 200µ, and it responded well to small de-
formations before the crack formation. The CP composite
showed continuous resistance change up to a large strain
level near the final fracture of the concrete structures re-
inforced by steel bars. It was also found that the CP com-
posites embedded in mortar/cement block specimens have
the ability to diagnose the hysteresis of micro crack forma-
tion by the evaluation of the residual resistance even after
unloading.
P1: FCH/FYX P2: FCH/FYX QC: FCH/UKS T1: FCH
PB091-S-DRV-I January 24, 2002 15:42
SELF-DIAGNOSING OF DAMAGE IN CERAMICS AND LARGE-SCALE STRUCTURES 901
100
(a)
80
60
40
Load / kN
20
0
0 500 1000 1500
Time / s
2000 2500
5000
(b)
4000
3000
2000
Strain / µ
1000
0
0 500 1000 1500
Time / s
2000 2500
30
(c)
25
20
15
∆R/R0 / %
10
5
0
0 500 1000 1500
Time / s
2000 2500
2500
(d)
2000
1500
1000
∆R/R0 %
500
0
0 500 1000 1500
Time / s
2000 2500
Figure 18. Load (a), strain (b), and R/R
0
(c,d)ofCPandCF
composites as a function of time in the bending test for the block-
type specimen.
100
(a)
80
60
40
Load / kN
20
0
0 4000300020001000 60005000
Time / s
7000 8000
5000
(b)
4000
3000
2000
Strain / µ
1000
0
0 4000300020001000 60005000
Time / s
7000 8000
30
(c)
25
20
15
∆R/R0 / %
10
5
0
0 4000300020001000 60005000
Time / s
7000 8000
2500
(d)
2000
1500
1000
∆R/R0 %
500
0
0 4000300020001000 60005000
Time / s
7000 8000
Figure 19. Load (a), strain (b), and R/R
0
(c,d)ofCPand
CF composites in the cyclic loading test for of the block type
specimen.
P1: FCH/FYX P2: FCH/FYX QC: FCH/UKS T1: FCH
PB091-S-DRV-I January 24, 2002 15:42
902 SELF-DIAGNOSING OF DAMAGE IN CERAMICS AND LARGE-SCALE STRUCTURES
(a)
(b)
(c)
Figure 20. Appearances of the block specimen during the cyclic
bending test (a) A low load level; (b) a high load level; (c) after the
test.
Such excellent properties can be attributed to the perco-
lation structure of the carbon particles dispersed within a
section of the plastic matrix phase. The conductive path in
the percolation structure of carbon particles, which is very
different from the conductive path in carbon continuous
fibers, can react to small strains that are lower than 200
µ. This may be due to its flexible structure which is filled
with faint gapsand cracks asseen in the microstructures of
the carbon particles mixed with plastics. The phenomenon
of the residual electrical resistance at the unloading state
suggests that the distorted structure at the loading state
does not completely return to its original shape at the
unloading state. The residual resistance phenomenon has
a possibility for the hysteresis function of an applied load.
250
(a)
200
150
100
Load / kN
50
0
0 8000600040002000 1.2 10110
Time / s
3000
2500
(b)
2000
1500
1000
Strain / µ
500
0
0 8000600040002000 1.2 10110
Time / s
10
(c)
8
6
4
∆R/R0 / %
2
0
−2
0 8000600040002000 1.2 10110
Time / s
1
(d)
0.8
0.6
0.4
∆R/R0 /%
0.2
0
0 8000600040002000 1.2 10110
Time / s
Figure 21. Load (a), strain (b) and R/R
0
(c, d) of CP composite
in.
P1: FCH/FYX P2: FCH/FYX QC: FCH/UKS T1: FCH
PB091-S-DRV-I January 24, 2002 15:42
SENSOR ARRAY TECHNOLOGY, ARMY 903
(a)
(b)
(c)
Figure 22. Appearances of the pile specimen in the cyclic bending
test of type-3 (a) A low load level; (b) a high load level; (c) after the
test.
The continuous change of resistance in the CP composite
contributes to the damage detection of concrete structures.
The percolation structure in the fiber-reinforced structure
can keep its flexible structure up to the final fracture.
It is necessary to arrange the CP composite in concrete
specimens to optimize the function. The location near a
tension-side surface and far from steel bars is effective
in order to obtain a quick response to applied stress and
crack formation. The existence of prestress (compression)
in concrete structures can dull the sensitivity of the com-
posite. For the CP composite near the tension-side surface
in the pile specimen, its clear sensitivity proves that the
performance of the composite overcomes the influence of
prestress.
Two kinds of glass-fiber reinforced plastic composites
with carbon powder (CP) or carbon-fiber (CP) were in-
troduced into the mortar/concrete specimens, with block
and concrete pile types and electrical resistance change
(R/R
0
) of the composites being measured in the bending
tests. The R/R
0
of theCP composite in the block specimen
showed a good sensitivity in a small strain range to detect
crack formation in the mortar/concrete and a continuous
change in a large strain range up to the final fracture of the
specimen, while the R/R
0
of the CF composite increased
suddenly at a certain strain of the specimen. The CP com-
posite had the good response to cyclic load patterns in the
bending test of the block specimen and indicated the resi-
dual resistance at an unloading state. The R/R
0
of the CP
composite in the pile specimen with prestress showed good
results to the loading patterns before and after micro crack
formation in the bending test. The arrangement of the CP
composite near the tension-side’s surface, and far from the
steel bars in the pile, effectively improved the sensitivity of
the composite. The excellent self-diagnosis function of the
CP composite in the concrete structures was considered to
be mainly caused by the flexibility in the percolation struc-
ture of carbon particles.
BIBLIOGRAPHY
1. N. Muto, H. Yanagida, T. Nakatsuji, M. Sugita, and Y.
Ohtsuka. J. Am. Ceram. Soc. 76 (4): 875–879 (1993).
2. M. Takada, S G. Shin, H. Matsubara, andH. Yanagida. J. Jpn.
Soc. Compos. Mater. 25: 225–230 (1999).
3. Y. Okuhara, S G. Shin, H. Matsubara, and H. Yanagida.
Trans. MRS-J. 25 (2): 581–584 (2000).
4. M. Takada, H. Matsubara, S G. Shin, T. Mitsuoka, and
H. Yanagida. J. Ceram. Soc. Jpn. 108 (4): 397–401 (2000).
5. Y. Okuhara, S G. Shin, H. Matsubara, H. Yanagida, and
N. Takeda. Proc. SPIE (2000), in press.
6. H. Nishimura, T. Sugiyama, Y. Okuhara, S G. Shin, H.
Matsubara, and H. Yanagida, Proc. SPIE 3985, 335 (2000).
SENSOR ARRAY TECHNOLOGY, ARMY
JEFFREY SCHOESS
Honeywell Technology Center
Minneapolis, MN
INTRODUCTION
Today’s commercial and military aircraft require signi-
ficant manpower to provide operational readiness and
flight safety. Aging aircraft fleets are much in need of
new and innovative health-monitoring methods to prevent
catastrophic failure and reduce life-cycle costs. The key
needs for characterizing in situ structural integrity char-
acteristics of corrosion and barely visible impact damage
(BVID) to determine “damage susceptibility” must be ad-
dressed. This article presents a new concept for onboard
real-time monitoring using conductive polymer sensor ar-
ray technology.
BACKGROUND
Both commercial and military service personnel currently
employ “walk-around” structural inspection as a corner-
stone of condition-based maintenance. This means that
a hierarchy of inspections is required to ensure that
fleet readiness and availability requirements are met.
Structural inspection includes daily inspection, phased
maintenance based on aircraft operating time, conditional
P1: FCH/FYX P2: FCH/FYX QC: FCH/UKS T1: FCH
PB091-S-DRV-I January 24, 2002 15:42
904 SENSOR ARRAY TECHNOLOGY, ARMY
Figure 1. Key sensing locations on aircraft.
Enging inlet 5A
Landing geat
(nose and main)
3B
2B
6A
1C
5B
4A
1A
3C
2B
Load bearing
antenna
Fuel tank and
weapons pulon
External skin
(upper and
lower)
Wing fold
Horizontal/
vertical
stabilizer
7A,B
Engine Aft
exhaust
Wing
tanks
Leading and trailing edges
Gun bay area
3A
2A
Cockpit canopy
Redome
bulkhead
inspection based on the mission andlocation of the aircraft,
and calendar-based inspection.
Although condition-based maintenance inspection is
mature and is reliable in most cases, its application in
future military and commercial systems has significant
drawbacks notably high cost and intensive effort. Cur-
rently, the cost to maintain a Navy aircraft is up to
$200,000 per year. A 1996 Naval Center for Cost Analysis
AMOSC report indicates that the direct cost of maintain-
ing Navy aircraft and ships is at least $15.0 B per year. As
much as 25 to 30% of operating revenue is spent on main-
tenance for commercial air carriers. According to a 1995
study by the office of the Under Secretary of Defense, 47%
of the Navy’s active duty enlisted force (173,000 sailors)
and 24%of theMarine Corps(37,600 marines)are assigned
to maintenance functions. The mandate to reduce man-
power while performing duties faster, cheaper, better, and
more reliably is a reality in both military and commercial
transportation.
In addition to these issues, problem areas exist specifi-
cally for maintaining structural integrity, including BVID
and hidden and inaccessible corrosion. The increased use
of composite materials in aircraft structures introducesthe
potential for BVID, a maintenance-induced damage effect.
At least 30% of all maintenance is related to structural
repair due to tool dropping and in-service damage. A sig-
nificant amount of the loss of structural integrity is due to
hidden corrosionas well as corrosion located in inaccessible
areas (wheel wells, landing gear areas, and fuel tanks). The
practice of applying surface treatments of various types to
provide adequate protection, in some cases overcoating the
surface with several layers, causes considerable weight in-
crease. This increase results in loss of fuel savings and
proved aircraft performance.
TECHNICAL APPROACH
A trade study was performed to identify and assess po-
tential aircraft inspection areas that could benefit from
conductive polymer sensor array technology. The trade
study involved the identification of seven key areas of a
generic fighter aircraft (F-18 or equivalent). The areas ad-
dressed in the study were external wing structure, inter-
nal wing and fuselage structure, including landing gear
and cockpit canopy, communications, external stores, and
empennage structure. The study addressed specific parts
of these identified areas and included a problem defini-
tion, a proposed sensing layout approach, and a sensing
configuration. Figure 1 is a drawing of the F-18 aircraft
that shows the functional layout of the seven aircraft sens-
ing areas for possible future technology insertion. The
sensing areas are mapped to the aircraft geometry, labeled
by area, and keyed to the full-scale trade study chart shown
in Table 1. The chart highlights the details of the trade
study effort and contains specifics on subassemblies, in-
cluding a general problem description. It maps the prob-
lems using three different types of sensing: “M/C” refers to
moisture/corrosion sensing, “ID” refers to impact detection,
and LBA refers to “load-bearing antenna.” For each sens-
ing approach, three packaging options exist: (1) a confor-
mal sensor array, which would cover a larger surface area
such as an external wing area of more than several square
feet; (2) a conformal sensor applique to provide sensing
coverage in a smaller area (a few square inches, possibly
with significant contour shapes); and (3) a conformal boot
assembly. The conformal boot design would involve fabri-
cating a preformed structure—a sensory boot that fits the
spatial constraints of the aircraft contour. An example of
this configuration would be a preformed boot fit over the
leading edge or radome bulkhead assembly.
Sensor Development
A conductive polymer sensor array design provides the
capability for multifunction conformal sensing. Honeywell
has developed polymer sensors to sense moisture (i.e.,
electrolyte) conditions and the presence of moisture/fluids
across an extended surface area. A primary maintenance
concern is the need to sense and quantify moisture trapped
between the protectant system layer and the aircraft sur-
face that could cause corrosion. Typically, the moisture is
an electrolyte, an electrically conducting fluid that has ions
in solution. The polymer sensor array has been designed to
P1: FCH/FYX P2: FCH/FYX QC: FCH/UKS T1: FCH
PB091-S-DRV-I January 24, 2002 15:42
SENSOR ARRAY TECHNOLOGY, ARMY 905
Table 1. Aircraft Trade Study Chart
Sensing Sensing
Aircraft Area Part/Assembly Problem Definition Approach
a
Configuration
1 Wing external
r
Leading edges
r
Flap and drive assembly
r
M/C
r
Conformal array
r
Trailing edges
r
Impact (BVID)
r
ID
r
Conformal boot
r
Corrosion—wing attach fitting
r
Erosion
r
External skin (upper
r
Impact (BVID due to maintenance/
r
M/C
r
Conformal array
and lower) repair)
r
ID
r
Conformal applique
r
Corrosion (fastener area)
r
Wing fold
r
Corrosion in hinge area
r
M/C
r
Conformal tape
r
Wing attachment fatigue
2 Communications
r
Radome bulkhead
r
Corrosion (dissimilar ± F-galvanic)
r
M/C
r
Conformal boot
support
r
Wing antenna
r
Phased-array antenna
r
LBA
r
Conformal applique
3 Fuselage
r
Cockpit canopy
r
Corrosion—dissimilar interface
r
M/C
r
Conformal applique
(galvanic)
r
Landing gear
r
Corrosion in wheel well area, main
r
M/C
r
Conformal applique
landing gear assembly
r
Gun bay area
r
Corrosion—dissimilar interface
r
M/C
r
Conformal applique
4 Wing internal
r
Wing tank
r
Fuel leakage in web area (wet bay)
r
M/C
r
Conformal applique
r
Electrical connector/ground straps
5 Engine
r
Engine inlet
r
Impact (BVID) from debris/bird strike
r
ID
r
Conformal applique
r
Aft engine exhaust area
r
Corrosion—moisture
r
M/C
6 External stores
r
Fuel tank pylon
r
Corrosion—dissimilar interface
r
M/C
r
Conformal applique
r
Weapons pylon
r
Erosion
7 Empennage
r
Horizontal stabilizer
r
Pivot shaft corrosion
r
M/C
r
Conformal applique
r
Vertical stabilizer box
r
Corrosion
a
M/C = moisture/corrosion; ID = impact detection; LBA = load-bearing antenna.
detect the “presence” of an electrolyte, which can be seawa-
ter, acid rain, lavatory fluids, fuel, hydraulic fluid, chemi-
cals, or cargo by-products.
The basic design is implemented by printing a spe-
cific pattern design on a flexible substrate material, cur-
ing it, and layering it using a pressure-sensitive adhesive.
A typical pattern developed for electrolyte sensing is a
transducer design that has alternating electrode pairs.
Figure 2 illustrates the pattern layout for a polymer sensor
array. The figure shows a set of dedicated electrode pairs,
each of which operates as a sensory element. The sensor
is designed to function as a linear 2-D array that mea-
sures the “location” where the electrolyte is sensed and
the “amount” of electrolyte based on exposure across the
sensor array.
Electrode
linewidth ~ 1/32 in.
1/2 in.
IDT
(interdigitated
tranducer) electrode # 1
6 in.
To scanning
electronics
C0024 1-11
Figure 2. Pattern layout of polymer sensor array.
Detection of Corrosivity. Four conditions must exist be-
fore corrosioncan occur:(1) the presence of a metal that will
corrode an anode; (2) the presence of a dissimilar conduc-
tive material (i.e., cathode) that has less tendency to cor-
rode; (3) the presence of a conductive liquid (electrolyte);
and (4) an electrical path between anode and cathode. A
corrosion cell is formed because of the electrochemical ef-
fect, if these four conditions exist, as shown in Fig. 3. In
a typical aircraft coating application, paint applied to the
surface ofthe metalacts asa moisture barrier to protect the
bare metal from exposure to an electrolyte. The paint film
prevents the corrosion cell from functioning by separating
the electrolyte from the anodic and cathodic sites on the
metal surface. If this paint layer is damaged by erosion,
heat exposure, or aging, the cell is activated, and corrosion
occurs.
Figure 3 also highlights the concept of using a polymer
sensor array to detect corrosivity when a corrosion cell is
formed in an aircraft lap joint. As shown, the linear sen-
sor array senses the “conductivity” of the trapped fluid by
conducting a current through the fluid that is between IDT
electrode pairs. The fluid’s conductive property is, by defi-
nition, “the ability to act like an electrolyte and conduct a
current, or a measure of its corrosivity.”
The concept of performing corrosive environmental
“exposure susceptibility” index monitoring to minimize
scheduled inspections and provide direct cost savings is
shown in Fig. 4. The basic idea is continuous monitor-
ing of the actual exposure of each aircraft to corrosive
P1: FCH/FYX P2: FCH/FYX QC: FCH/UKS T1: FCH
PB091-S-DRV-I January 24, 2002 15:42
906 SENSOR ARRAY TECHNOLOGY, ARMY
Moisture migration ID
Polymer
sensor
array
Corrosive
agents enter
at unsealed
skin edges
Aircraft fastener
Paint layer
Electron
flow
Anodic
area
Cathodic
area
Metal
Paint
layer
Paint erosion
effect
Electrolyte
(i.e.fuel,
water)
C0 024 1-01
Figure 3. Simplified corrosion cell and lap joint application.
environmental factors (moisture ingress into protective
coating, type of corrosive agent, etc.) and then scheduling
corrosion inspectionsbased onthese measurements, rather
than on preset rules that are only loosely related to corro-
sion. Typical preset rules that an exposure susceptibility
index would replace are calendar-based (i.e., inspection ev-
ery 30 days) or usage-based (i.e., inspection every 10 h of
operation) inspections. One can think of the system as a
“corrosion odometer” whose a readout steadily increases
according to the corrosiveness of the environment to which
the aircraft is exposed. Maintenance personnel can inter-
mittently check the odometer and inspect as needed. The
exposure susceptibility index provides a reliable method
for scheduling corrosion inspections that (1) is based on
the true exposure of the aircraft, which leads to a higher
degree of susceptibility to corrosion; (2) appropriately re-
flect variations in exposure due to short-term weather pat-
terns; and (3) can be consistently applied to aircraft of a
given type at any location in the world.
The sensor array approach can sense and calculate an
exposure index to ingress of an electrolyte (i.e., water) and
the “wetness” effect of the electrolyte. The wet/dry cycle of
exposure is a strong indicatorof how susceptible an aircraft
is to corrosion; wetness is a basic requirement for corrosion
F
W ≡ Humidity, wetness
Cl ≡ Concentration level of index
C ≡ Corrosivity
T ≡ Temperature
W
F
Cl
F
C
F
T
l =
∫
dt.F(W,Cl,C,T)
Figure 4. Exposure susceptibility index.
to occur. The wetness exposure index is defined as the in-
tegral over time of the function F
W
(W). Here W is the time-
varying output of a “wetness” sensor (1 = wet, 0 = dry)
that quantifies the total corrosive effect of wetness. F
W
is a
simple function that gives the exposure index on a conve-
nient scale, so an abbreviated inspection is called for each
time the index passes through a multiple of 100, for exam-
ple. Thus, for severe environments such as Puerto Rico, an
increase by 100 every 15 days could occur, compared to an
increase by 100 every 90 days in Denver.
Further improvement of the exposure susceptibility in-
dex can be obtained by adding other environmental factors
that influence corrosion, including the concentration of the
electrolyte, the temperature, and the conductivity (corro-
sivity factor).
Figure 5 illustrates the index calculation concept and
shows the maintenance cost saving concept in detail. The
design approach is set up to collect and analyze the en-
vironmental factors related to structural health (mois-
ture ingress, impact forces, etc.) that could lead to loss of
structural integrity. These factors are collected and inte-
grated as a “cumulative index” to determine (1) the level of
“susceptibility” to failure and (2) whether maintenance is
required at a given location in the aircraft. The cumulative
index value, it is envisioned,will berepresented as a simple
100
Index change
Time
Inspections
Maintenance
index
Figure 5. Maintenance cost saving tutorial.
P1: FCH/FYX P2: FCH/FYX QC: FCH/UKS T1: FCH
PB091-S-DRV-I January 24, 2002 15:42
SENSOR ARRAY TECHNOLOGY, ARMY 907
Force applied
via structural
impact
Semiconductor
polymer layer
Applique film
F
Polymer
sensor
pattern
C00241-04
As pressure (i.e., force)
is applied, polymer
sensor is "shunted,"
causing decrease in
resistance
Figure 6. Force-sensing resistor (FSR).
whole number from 0 to 100 (which indicates the level of
susceptibility; a higher number indicates that more poten-
tial for damage may exist) that could be read outby mainte-
nance personnel from the aircraft maintenance debriefing
interface at scheduled inspection intervals. The crew could
then decide to perform scheduled maintenance or bypass
the action. This would directly reduce the cost of main-
taining the aircraft by eliminating or reducing the number
of inspections. In addition, reducing the time for a main-
tenance procedure based on the polymer sensor system’s
ability to identify the general structural location where the
repairs may be needed and the type of repair required (i.e.,
impact damage vs. corrosion) will result in additional op-
erational cost savings.
Impact Detection. The polymer sensor for mois-
ture/corrosion sensing can also sense impact forces caused
by maintenance-induced damage or operational servicing.
To provide sensing for impact forces, the polymer sensor
array is configured with an additional semiconductor poly-
mer layer, as shown in Fig. 6. The design approach is set
up to operate as a force-sensing resistor (FSR). An FSR
operates on the principle of converting force applied via
1K
10K
100K
1M
10 100 1,000
10,000
C00241-05
I II III
Figure 7. FSR response vs. applied force.
Uniforce
C00241-06
Figure 8. Example of off-the-shelf FSR product.
a structural impact to an equivalent voltage output.
As pressure is applied, individual electrode pairs are
shunted, causing a decrease in electrical resistance. The
measurement of impact force magnitude, impact direction
vector along the sensor array, and impact surface area can
be quantified, depending on polymer composition, shunt
pattern and shunt shape, and the method for applying
pressure (hemispherical vs. flat). Figure 7 shows a typi-
cal curve of sensor response. The figure is a plot of electri-
cal resistivity versus applied force and has an active sens-
ing region of two to three orders of magnitude from low
impedance (kilohms) to high impedance (megohms). The
sensor response is approximately a linear function of force
across a wide range of applied pressure. The first abrupt
transition thatoccurs isat lowpressure. This point is called
the “breakover point” where the slope changes. Above this
region, the force is approximately proportional to 1/R until
Localized
region of
particles
(Higher density)
External
force F
Electrically
insulation
polymer matrix
Active
sensing
region
2 to 3 orders
of magnitude
Applied force
C00241-09
Electrical resistivity (π)
F
Conductive
particles
Figure 9. Polymer matrix sensor.
P1: FCH/FYX P2: FCH/FYX QC: FCH/UKS T1: FCH
PB091-S-DRV-I January 24, 2002 15:42
908 SENSOR ARRAY TECHNOLOGY, ARMY
Table 2. PTF Resistor Versus Other Resistor Technology
a
Gauge TCR Application Relative
Resistor Type Factor (G) (ppm/
◦
C) Method Cost
Continuous metallic films 2.0 20.0 Spin cast High
Thin film 50.0 20.0 RF sputter High
Evaporation
Semiconductor 50.0 1500.0 Diffused Medium
Implanted
Thick film (PTF) 10.0 50.0–500.0 Screen print Low
Stencil
Spin cast
a
Source: G. Harsanyi, ed., Polymer Films in Sensor Applications—Technology, Materials, Devices and Their
Characteristics. Technomic, 1995.
a saturation region is reached. When the force reaches this
magnitude, applying additional force does not decrease the
resistance substantially.
Figure 8 is a photo illustration of a commercially avail-
able off-the-shelf FSR product called Uniforce, which has
an operating range of 0–1000 psi.
Another type of conductive polymer sensor is a poly-
mer matrix sensor that consists of electrically conducting
and nonconducting particles suspended in a matrix binder.
Figure 9 shows a cross-sectional view of a polymer
matrix sensor. Typical design construction includes a ma-
trix binder and filler. Matrix binders include polyimides,
polyesters, polyethylene, silicone, and other nonconduct-
ing materials. Some typical fillers include carbon black,
copper, silver, gold, and silica. Particle sizes typically are of
the order of fractions of microns in diameter and are formu-
lated to reduce temperature dependence, improve mechan-
ical properties, and increase surface durability. Applying
an external force to the surface of a sensing film causes
A/D
Mux
+V
R
x
R
x
+
Damage α force
area
C00241-10
Paint layer
Force-sensing resistor (FSR)
matrix array
1-in.
space
FSR
elements
Aircraft composite
access panel
(approx. 24 in
2
)
V
sense
− Equivalent circuit
(voltage divider)
to
µC
f
applied
Structural
BVD
Access
panel
(after f
x
exceeded)
Damage
ID
Damage
threshold
(f
x
)
Force applied (psi)
(f
x
)
Figure 10. Structural impact damage tutorial.
particles to touch each other and decreases the overall elec-
trical resistance.
Table 2 illustrates the typical performance of polymer
thick-film (PTF) resistor technology and other resistor
technologies. The table includes a summary for thin films,
semiconductor, and continuous metal films. The significant
advantage of PTF resistor technology overall other resistor
sensing is the cost to fabricate devices. The PTF cost factor
is achieved by the ability to print resistive material via
stencil, screen printing, and ink-jet printing techniques.
A prime example of using FSR technology for aerospace
sensing is structural integrity monitoring. Today’s com-
mercial and aerospace structures incorporate a large
amount of composite materials to reduce structural weight
and increase load-bearing properties. Composites are
susceptible to damage from impact forces experienced
in operation, including debris picked up from runways
and maintenance-induced damage caused by dropped
tools. Figure 10 illustrates the system-level concept of
P1: FCH/FYX P2: FCH/FYX QC: FCH/UKS T1: FCH
PB091-S-DRV-I January 24, 2002 15:42
SENSOR ARRAY TECHNOLOGY, ARMY 909
Shape-conforming CST antenna
Flexible
substrate
C00241-12
Antenna
patch
element
Patch
antenna
(conductive film)
Nonconductive
film layer
Ground plane layer
50-100 mm
square
Strip
feed
Detailed view
of antenna
Figure 11. Example of conformal antenna.
impact-damage-detection-based applied force versus dam-
age for a composite aircraft panel. A matrix array of FSR
elements integrated into the aircraft panel is shown. Panel
construction involves printing FSR elements directly on
the panel surface or on a film layer, which is then bonded
to the panel using a pressure-sensitive adhesive layer. The
polymer patterns incorporated on the panel include a com-
bination of sensor elements and electrical interconnects
implemented with conductive polymer materials.
To measure and record impact forces in real time, the
output of each FSR element is converted to an equivalent
voltage via a simple voltage divider circuit and is provided
as input for a dedicated data acquisition system. Each
FSR element output is routed to an analog multiplexer.
10 .5'
6'
Conformal
antenna array
Antenna
Antenna
EMI
generator
EMI
generator
(broadband)
1 mHz–5 GHz
Results
Results
C00241-03
Aircraft access
panel
(approx. 24 in
2
)
Figure 12. Conformal antenna con-
cept.
An analog-to-digital converter sequentially digitizes each
FSR value into an equivalent digital word for processing
by a dedicated system controller. The illustration on the
right-hand side of Fig. 10 shows what happens if struc-
tural damage occurs. An external force event (i.e., a tool
dropped on the surface) causes an impact. Structural dam-
age usually consists of multilayer delaminating or mi-
crocracking of individual composite layers. In composite
structure applications, the curve for quantifying structural
damage is an exponential relationship and is detected by
setting a force threshold value. A value that exceeds the
threshold value f
x
indicates that barely visible structural
damage has occurred. The effects of detected damage can
be read out by maintenance personnel periodically to de-
termine if structural repair is needed it or is marked as
suspect, and the vehicle is returned to active service. A
set of damage identification threshold values could be re-
tained for each major structural component of the air-
craft in a 3-D map database to perform maintenance on
demand.
Conformal Antennas. A significant feature of polymer
sensor array technology is the arrays’ ability to operate
as a low observable (LO) conformal antenna. The polymer
sensor has been tested in laboratory conditions to detect
broadband frequencies of several megahertz without any
optimization of the polymer circuit pattern. The confor-
mal antenna capability offers a significant benefitofin-
creasing detection of “bad guy” signature threats. Tests
performed by aircraft primes have indicated that confor-
mal load-bearing antennas improve detection by a fac-
tor of 6 to 14 times. In addition, the conformal polymer
construction makes it suitable for phased-array antenna
P1: FCH/FYX P2: FCH/FYX QC: FCH/UKS T1: FCH
PB091-S-DRV-I January 24, 2002 15:42
910 SENSORS, SURFACE ACOUSTIC WAVE SENSORS
Figure 13. Wireless transceiver module for self-contained
communications.
Sensor
array
PDA
Wireless
antenna
Control
antenna
Sensor
array
Control
antenna
Sensor
array
Control
antenna
Aircraft access panel Aircraft access panel Aircraft access panel
C00241-08
Figure 14. Wireless structural panel sensor web.
design for munitions and guided projectiles. Figure 11
illustrates the feasibility of using the polymer design
for antenna functions. Figure 12 highlights the use of a
broadband EMI source and detection of electromagnetic
wave pickup at increasing distances up to 10 ft from the
antenna.
Communications Debriefing
A significant system-level issue is how to obtain data on
environmental factors during aircraft inspections without
increasing the workloads of maintenance personnel. This
can be achieved by providing a wireless linkfor data access.
Figure 13 illustrates a photo of a 2 × 3 × 0.125 in wireless
transceiver module for field maintenance communications.
The module consists of a low-frequency (128 kHz) receiver
interface, a dedicated high-frequency (315 MHz) transmit-
ter interface, dedicated control logic, and internal RAM
memory. The radio-frequency (RF) system can be read at
ranges of 6–30 ft and operates at 2 µa in standby mode. The
RF module is powered by a high-energy-density lithium
button-cell battery. Future applications will include an
RF module that features a very low profile height of 4
mils and capability for RF power scavenging. This unique
capability implies that no batteries will be required to com-
municate and debrief the sensor suite. Up to 100 RF mod-
ules can be read simultaneously by a dedicated wireless
RF reader.
Figure 14 illustrates a concept for wireless sensor com-
munications to debrief a suite of aircraft structural compo-
nents. A field maintenance technician is shown holding a
personal data assistant that has a wireless interface. The
status of the structural integrity of each component could
be assessed by issuing a polling command to search and
identify the health status of a designated structural panel.
The wireless interface within each structural component
would read the poll message, determine if the message
request is intended for that component, and the designated
panel willthen returnthe healthstatus tothe maintenance
technician.
SENSORS, SURFACE ACOUSTIC WAVE SENSORS
DAVID W. GALIPEAU
South Dakota State University
Brookings, SD
INTRODUCTION
Surface acoustic wave microsensors are microchips that
usually have a sensing film applied to the substrate sur-
face. They differ from silicon-based microcircuits that form
the basis for most integrated circuit technology today, in
that they are based on piezoelectric versus semiconductor
substrates and are usually much less complex. Microsen-
sors are usually defined as sensors of micron dimensions or
are made by the same fabrication techniques that are used
for integrated circuits. Microsensors have several advan-
tages over older sensor technologies, including small size,
low cost, and typically better performance (1). The rela-
tively rapid development of surface acoustic wave (SAW)
microsensors has resulted from the demand for low-cost,
high-performance sensors to measure such things as haza-
rdous gases, biological pathogens, chemical and biological
weapons, automotive emissions, and indoor air quality. Ad-
ditionally, there is strong interest in developing an elec-
tronic nose for both industrial and laboratory applications.
As a result of these advantages and the strong demand,
the development of SAW microsensors has grown rapidly
during the last twenty years.
BACKGROUND
SAW devices were originally developed and are still widely
used as high-performance signal processing elements such
as filters and delay lines in electronic circuits (2,3). The
P1: FCH/FYX P2: FCH/FYX QC: FCH/UKS T1: FCH
PB091-S-DRV-I January 24, 2002 15:42
SENSORS, SURFACE ACOUSTIC WAVE SENSORS 911
term acoustic wave refers to the class of waves that dis-
places particles of the solid, liquid, or gas medium in which
they propagate. Therefore, acoustic waves are considered
mechanical waves compared to electromagnetic waves,
which can propagate in a vacuum because they do not re-
quire a medium or have related particle displacements.
The term surface acoustic wave (SAW) usually refers to
the class of acoustic waves that propagates at a solid sur-
face, versus bulk waves, which propagate within a solid.
The first type of SAW was discovered by Rayleigh in 1885.
It has longitudinal particle displacements (in the propaga-
tive direction) and transverse particle displacements (per-
pendicular to the propagative direction) that are normal to
the substrate surface. This type of SAW is called a Rayleigh
wave. There are several other types of SAWs that are dis-
tinguished primarily by their wave particle displacements
and are usually allowed only for certain crystallographic
orientations. For example, a wave that has transverse par-
ticle displacements in the plane of the substrate and propa-
gates just below the surface is called a surface skimming
bulk wave (SSBW). It occurs on ST-cut quartz. Bulk waves
are also classified as longitudinal or transverse (shear)
based on particle displacements. Classic reviews of acou-
stic waves in solids are provided by Auld (4) and Kino (5).
A SAW microsensor normally consists of two metal in-
terdigital transducers (IDTs) fabricated on a piezoelec-
tric substrate. The IDTs are patterned from a thin metal
film (usually aluminum) that has been deposited on the
substrate. The patterning is done by using standard pho-
tolithographic techniques. Figure 1 illustrates a single de-
lay line (channel) SAW sensor. The term delay line is used
for this design because it can be used for this application in
signal processing. The operation of a SAW microsensor is
as follows. SAWs are launched onto the delay path (Fig. 2a)
via the reverse piezoelectric effect when an RF signal at the
microsensor’s operating frequency is applied to the input
IDT. These SAWs travel across the delay path (Fig. 2b) to
the output IDT where they are converted back into electri-
cal signals via the piezoelectric effect (Fig. 2c). The velocity
and amplitude of the SAWs are the sensor outputs.
The acoustic velocity V of any material is a function of
the elastic constant c and density ρ of the material. For the
simplest (isotropic) case, the velocityis given by V =(c/ρ)
1/2
(5). The relationship between the SAW velocity, frequency
f , and wavelength λ, is given by V = f λ. The aftenua-
tion of the waves is primarily a function of the viscosity
Input IDT Output IDT
Delay
path
Interdigital
Transducer
Piezoelectric
substrate
Figure 1. Diagram of a single channel (delay line) SAW
microsensor.
Delay
path
Input IDT Output IDT
λ
(a)
Piezoelectric
substrate
(b)
(c)
Figure 2. The generation and propagation of SAWs on a sensor
surface.
of the material in which the waves propagate. The SAW
velocity or amplitude can be changed by a film or deposit
on the sensor surface or other disturbances at or near the
sensor surface because the density, elastic constant, and
viscosity (viscoelasticity) of the film or deposit are usu-
ally different from those of the SAW substrate. The SAW
velocity or amplitude can also be affected by the conducti-
vity or permittivity of the deposit because the SAW also has
an electrical component on a piezoelectric substrate. Sec-
ondary physicalparameters that affect the previously men-
tioned (primary) parameters also affect the SAWs’ charac-
teristics. They include temperature, stress, pressure, and
electric and magnetic fields. A change in the SAW velo-
city due to mass on the surface is commonly referred to as
“mass loading.” Mass loading and amplitude attenuation
are the most commonly used sensing mechanisms for SAW
sensors and are the primary focus of this review article.
The change in SAW velocity V
R
has been related to
the mass of a thin nonviscous (lossless) film on the sensor
surface by Wohltjen (6).
V
R
V
R
= (k
1
+ k
2
) fhρ
, (1)
where V
R
is the SAW velocity, k
1
and k
2
are substrate ma-
terial constants, f is the SAW frequency, and h and ρ
are
the height and density of the thin film layer, respectively.
Therefore, the change in SAW velocity due to a layer de-
pends on hρ
of the layer. Because the units ofhρ
are kg/m
2
,
this is also the layer surface density ρs. The change in SAW
velocity is determined experimentally by measuring the
phase shift, φ or the frequency shift f of the SAWs that
are related to the change in SAW velocity by (6)
V
R
V
R
=
f
f
o
=−
φ
φ
o
. (2)
The relationship between the attenuation of the SAWs and
the viscosity of the mass or film on the sensor surface has
been described by Martin et al. (7) for acoustically thin
(<1 µm thick) hard polymer films as
α = ω
2
n
V
3
R
CG
, (3)
P1: FCH/FYX P2: FCH/FYX QC: FCH/UKS T1: FCH
PB091-S-DRV-I January 24, 2002 15:42
912 SENSORS, SURFACE ACOUSTIC WAVE SENSORS
where α is the attenuation change, ω
2
is the angular fre-
quency (2πf),CisaSAW-film coupling constant, and G
is
the loss modulus (complex part of the shear modulus) of
the film which is directly related to its viscosity. The term
acoustically thin denotes a film that does not resonate at
the SAW microsensor’s operating frequency. As film thick-
ness increases, it can resonate at theoperating frequencies.
A macroscopic analogy for a resonant film would be a plate
of Jello which, if shaken at a certain frequency, will also
resonate when the Jello is high enough.
The earliest uses of SAW devices as microsensors were
reported by Das in 1978 (8) for measuring pressure (phys-
ical) and by Wohltjen in 1979 (9) for measuring thin film
properties (chemical). These sensor applications resulted
from the observed high sensitivity of SAW signal process-
ing devices to “external” physical parameters such as tem-
perature changes and package stress, as well as “inter-
nal” properties of the films deposited on the SAW sub-
strate. A major application of SAW sensors has been highly
sensitive mass detectors (microbalances). Wohltjen stated
that SAW sensors have a potential mass sensitivity 200
times greater than the better known quartz crystal mi-
crobalance due to their higher operating frequency (6).
The effect of frequency on SAW velocity is illustrated by
Eq. (1). SAW devices can operate at frequencies higher
than 1 GHz, compared to about 10 to 50 MHz for the quartz
microbalance which operates by using bulk (shear) acous-
tic waves. However, because noise in measurement elec-
tronics increases as frequency increases, the practical fre-
quency limit for SAW sensors may be closer to 500 MHz.
SAW and bulk wave devices have significantly different
geometries and fabrication techniques. SAW devices are
fabricated by standard microelectronic fabrication meth-
ods, whereas bulk wave devices are manufactured individ-
ually as small disks that have thin metal film electrodes on
each side. Thus, SAW devices are typically less expensive
and have a much wider range of designs than bulk devices.
The following are additional advantages of SAW sensors.
(1) They can be configured in “smart” designs by using two
sensing channels on the same substrate where one is a
reference. This allows the sensor to be self-compensating
for interfering environmental parameters such as tem-
perature (10). (2) Because SAW microsensors are sensitive
to several parameters, they can provide an amplified sen-
sor response via multiple detection mechanisms. (3) They
are easy to use in wireless sensing applications in both the
active mode, as the frequency control element in a trans-
mitter (8), and the passive mode, as an energy reflector
(11). The passive mode is particularly interesting because
the sensor does not need a power source but is read using
a special FM radar type system. SAW devices are also con-
sidered one of the earliest types of microelectromechanical
systems, or MEMS devices. MEMS devices are usually de-
fined by having both mechanical and electrical components
or functions in a single unit and are fabricated using mi-
croelectronic fabrication techniques. SAW devices fit this
description because they have acoustic waves (mechanical)
that are launched and detected electrically.
Commercial SAW microsensor based systems are
currently available for gas and biological sensing,
gas-chromatography vapor sensing, and chilled-surface,
dew-point hygrometry. All of these systems capitalize on
the high sensitivity of the SAW microsensor to small
mass changes. systems for chemical and biological sens-
ing have been developed by Microsensor Systems (now
a subsidiary of Sawtek) (12). These include “Vaporlab,”
which uses an array of SAW microsensors coated with
proprietary films and pattern recognition to identify the
vapor, and the SAW “Minicad,” which uses the same
techniques to detect chemical warfare agents. The SAW
gas-chromatography system was developed by Electronic
Sensor Technology (13). This system uses a single bare
SAW microsensor and can be used as an electronic nose in
several gas sensing applications that have been validated
by theEPA. The SAW dew-point hygrometer was developed
by Microconversion Technologies Co. (14). This hygrome-
ter, the “Ultra DP5,” also uses a bare SAW microsensor, in
this case to provide precision measurements of water vapor
concentration.
This article presents a fairly wide range of SAW
microsensor applications that are based on the personal
research and development experience of the author. These
applications include detection of water vapor and other
gases; thin polymer film characterization, including adhe-
sion, surface properties, and curing; chilled-surface dew-
point measurements; measurement of surface energy and
cleanliness; and temperature measurement. A review of
acoustic wave biosensors has been provided by Andle and
Vetelino (15). Additional SAW microsensor applications
are reviewedin booksby Ballantine et al. (16) and Thomson
and Stone (17). These books also provide more comprehen-
sive descriptions of SAW microsensor theory, design, and
applications. SAW device design procedures can also be
found in the literature (2,3).
EXPERIMENTAL PROCEDURES FOR SAW SENSING
The two most common methods for measuring SAW velo-
city are the phase and frequency techniques (9,16). The
experimental setup for the phase technique requires ap-
plying an RF signal (from a signal generator) to the input
IDT of the SAW sensor. A vector voltmeter is then used
to monitor both the phase and amplitude of the SAWs, as
shown in Fig. 3. The experimental setup for the frequency
technique requires using the SAW sensor as the frequency
control element in an oscillator circuit. A frequency counter
is then used to monitor the oscillatory frequency, as shown
in Fig. 4. The advantages of the phase technique are ease of
use, stability, and easily obtainable amplitude information.
RF signal
generator
SAW
microsensor
Vector
voltmeter
Figure 3. The experimental setup for the phase (vector volt-
meter) technique.
P1: FCH/FYX P2: FCH/FYX QC: FCH/UKS T1: FCH
PB091-S-DRV-I January 24, 2002 15:42
SENSORS, SURFACE ACOUSTIC WAVE SENSORS 913
Frequency
counter
SAW
microsensor
Amplifier
Figure 4. The experimental setup for the frequency (oscillator)
technique.
However, this technique typically involves relatively ex-
pensive laboratory equipment. The advantages of the fre-
quency technique are high sensitivity and less expensive
equipment; however, oscillatory stability can be a problem,
and additional circuitry is required to obtain the amplitude
information.
DISCRIPTION OF APPLICATIONS
AND EXPERIMENTAL RESULTS
Gas Detection: Water Vapor and Hydrocarbons
One of the most widely studied applications of SAW mi-
crosensors has been measuring gas concentration. The
most commonly used configuration consists of a very thin
film (<1 µm) applied to the SAW microsensor. These films
are carefully selected or designed to provide both high sen-
sitivity and selectivity to the gas of interest and also long-
term reliability. To study the response of the SAW sensor
to gas concentration, the sensors are placed in a chamber
in which the atmosphere is controlled by a gas delivery
system.
The measurement of water vapor concentration and rel-
ative humidity have been of high interest for many years
because of their effect on human comfort and health. More
recently, the measurement of water vapor has become very
important in several other fields, including meteorology,
agriculture, and manufacturing due to the effects of wa-
ter vapor on weather forecasting, product quality, and
the large energy costs of drying processes. Polymer-coated
SAW devices have been studied as an improved means to
measure relative humidity. Polymers are good candidates
for sensing films due to their ease of processing, widely
customizable properties, and relatively low cost. Polyimide
is a readily available polymer that is widely used in mi-
croelectronic applications. It has the advantages of dura-
bility at high temperatures, low dielectric constants, and
ease of application. Therefore, it was chosen for this work.
Table 1. Maximum SAW Phase Shift of Polyimide-Coated SAW Microsensors for
Various Gases
a
Polyimide Type Water n-Heptane n-Octane Iso-Octane MEK
Non photosensitive Initial 6
◦
5
◦
2
◦
2
◦
140
◦
Aged 18
◦
3
◦
2
◦
3
◦
200
◦
Photosensitive Initial 18
◦
6
◦
5
◦
6
◦
400
◦
Aged 37
◦
27
◦
17
◦
25
◦
1050
◦
a
Ref. 18
0
10
0
−10
−20
−30
−40
5 10 15 20 25
100
80
60
40
20
0
Phase shift (deg)
Time (min)
Relative humidity (%)
Photosensitive
Non-photosensitive
Figure 5. Water vapor response of photosensitive and nonphoto-
sensitive polyimide films (15).
In addition, photosensitive polyimides have recently been
developed that reduce the number of processing steps re-
quired for patterning. The major drawback of polyimide
in microelectronic applications is that it typically absorbs
more than 2% by weight of water vapor when placed in
high humidity. However, this property allows its use as a
humidity sensing film.
Figure 5 (18) shows the response to water vapor of two
SAW microsensors coated by different polyimide films, one
that was photosensitive and one that was nonphotosen-
sitive. The photosensitive polyimide had about twice the
sensitive to water vapor as the nonphotosensitive poly-
imide, as indicated by the maximum phase shifts (at 100%
relative humidity) of 35
◦
and 18
◦
, respectively. The dif-
ference in the responses was attributed to the more open
molecular structure of the photosensitive polyimide (which
comes in precured form). The higher sensitivity suggests
that the photosensitive polyimide would be preferred for a
relative humidity sensor. However the long-term stability
of the film needs to be studied. A comparison of a SAW hu-
midity sensor with other types of low cost humidity sensors
indicated that SAW sensors have the potential for the high-
est sensitivity at low relative humidities but would prob-
ably be more expensive than capacitive or resistive types
when signal conditioning circuitry is considered (19).
Polyimide has also been used to measure hydrocarbon
and alcohol vapors. Selective hydrocarbon measurement is
of high interest to the petroleum refining industry. Table 1
summarizes theresults of studies that used SAW microsen-
sors coated by nonphotosensitive and photosensitive poly-
imides to detect three different hydrocarbons, methyl ethyl
ketone (MEK) vapor, and water vapor. The maximum SAW
P1: FCH/FYX P2: FCH/FYX QC: FCH/UKS T1: FCH
PB091-S-DRV-I January 24, 2002 15:42
914 SENSORS, SURFACE ACOUSTIC WAVE SENSORS
microsensor phase responses are shown for polyimide films
before and after 4 months of aging (18). The responses were
similar in shape to those for water vapor (Fig. 5) but dif-
fer in magnitude. Neither polyimide was selective among
isooctane, n-octane, and n-heptane, but the nonphotosensi-
tive polyimide had good selectivity between water vapor
and MEK (large responses) versus n-octane, n-heptane,
and isooctane (small responses). Aging had a significant
effect on water and MEK responses for both polyimide
types. However, only aging significantly affected the hep-
tane and octane responses of the photosensitive polyimide.
These results suggest that the structure of the photosen-
sitive film may become more open or that its viscoelastic
properties changed due to additional curing, as the poly-
imide film aged. Other investigators have used a similar
polyimide as a light guide (20) and have shown that poly-
imide film can select between n-heptane and isooctane gas
molecules. This selectivity was attributed to the different
cross-sectional areas of these molecules. The poor selec-
tivity of the SAW microsensor between n-heptane and
isooctane was attributed to a different molecular struc-
ture of the film caused by the differences in film process-
ing or thickness from that of the light guide work. These
results illustrate some of the key difficulties in develop-
ing appropriate films for chemical sensors, namely, poor
selectivity and long-term stability. The most promising ap-
proach to the selectivity problem for many gases appears
to be the use of a sensor array using pattern recognition
such as that used by Microsensor Systems or a chromatog-
raphy system that uses pattern recognition such as that of
Electronic Sensor Systems. There is also room for SAW
sensor-based systems designed for specific gases or ap-
plications such as the Microconversion Technologies Co.
hygrometer.
Polymer Film Characterization: Surface Treatments
and Adhesion
The SAW microsensor has been used to characterize the ef-
fects of surface treatments on thin polyimide films and as
a nondestructive indicator of film adhesion. Surface treat-
ments are of high interest because they are commonly used
to modify film properties, particularly surface energy. The
surface energy is important because it is directly related
to the adhesion of additional layers to the film and to the
film’s ability to absorb vapors. This is particularly impor-
tant in the microelectronics industry. The characterization
method consisted of measuring changes in the water vapor
response of the films as a function of the film parameter of
interest.
The effects of plasma and chemical surface treatments
on the water uptake of polyimide films are illustrated in
Table 2 (21) which shows the maximum water vapor re-
sponse (100% relative humidity) for polyimide films that
were untreated, sputtered, exposed to KOH, and coated
by Teflon-AF. The maximum phase shift for untreated film
was about 40
◦
. This compares to the smallest response of
about 5
◦
for Teflon-AF treated film, to about 12
◦
for sput-
tered film, to a maximum response of about 80
◦
for KOH
treated film. These results indicate that the surface treat-
ments significantly affect the water uptake of polyimide
Table 2. Maximum Water Vapor Response for Polyimide
Film Subjected to Various Surface Treatments
Surface Treatment Phase Change (degrees)
Teflon-AF 5
Argon sputtered 12
None 40
KOH 80
a
Ref. 21.
film and that these changes can easily be measured by a
SAW microsensor. A small water vapor response may be
desirable when polyimide is used as a protective coating,
and the large response would be desirable when the poly-
imide is used as a sensing film.
Adhesion of thin films is directly related to film reli-
ability. Therefore, a method that can measure the adhesion
of thin films nondestructively would be extremely useful.
The water uptake response of thin polyimide films was
examined as a possible nondestructive indicator of film–
substrate interfacial characteristics and adhesion. The wa-
ter uptake response was measured for two polyimide films
which were identical except for the surface treatment used
to prepare the substrates before film application. For this
work, a dual channel SAW microsensor was used because
it can directly measure the response difference between
two films. The experimental setup used for this study is
a slightly modified version of the vector voltmeter (phase)
setup previously described (Fig. 3). The modifications in-
clude applying the signal generator output to both SAW
microsensor channels by using a splitter and putting one of
the vector voltmeter probes at each of the two output IDTs,
as shown in Fig. 6. The difference in the water uptake
responses of two polyimide films, one applied over silane
adhesion promoter and one applied without promoter is
shown in Fig. 7 (22). The positive phase shift indicates
that less water was absorbed in the film that used pro-
moter. Because the two films were identical except for the
interfacial region, these results suggest that the adhesion
promoter prevented water from entering the interface and
that a significant amount of water was present at the in-
terfacial region of the film/substrate without promoter.
This agrees with neutron scattering studies of water
adsorption at similarly treated polyimide/silicon interfaces
(23) and suggests that the SAW technique may provide
a simple and nondestructive indication of adhesion that
could be used in process control.
RF signal
generator
Polyimide
film
Polyimide
film
Vector
voltmeter
Figure 6. A dual delay line SAW microsensor that has two poly-
imide film samples and the experimental setup for the compara-
tive phase technique.
P1: FCH/FYX P2: FCH/FYX QC: FCH/UKS T1: FCH
PB091-S-DRV-I January 24, 2002 15:42
SENSORS, SURFACE ACOUSTIC WAVE SENSORS 915
0
10
2
4
6
8
0
−2
−4
−6
5 10 15 20 25
100
80
60
40
20
0
Phase difference change (deg)
Time (min)
Relative humidity (%)
T = 22°C
Figure 7. The difference in the water uptake of polyimide films
applied with and without silane adhesion promoter (22).
Note that this dual channel design has been widely stu-
died as a method of adjusting SAW microsensors for unde-
sirable effects and can be considered a “smart design.” For
example, the most common application of the dual chan-
nel design has been for temperature compensation which
is necessary because the SAW velocity for many SAW sub-
strates is sensitive to temperature. When the dual chan-
nel design, is used in conjunction with the vector voltmeter
setup in Fig. 6, it results in canceling the temperature re-
sponse ofthe substrate because it isthe same for both chan-
nels. However, because only one channel can be coated by
a sensing film, the temperature response of the film itself
is not compensated for.
Polymer Film Characterization: Curing
and Glass Transition Temperature
Polymer films are widely used in microelectronics as re-
placements for more traditional materials such as in-
organic coatings on integrated circuits and ceramic printed
circuit boards (PCBs). This is due to their low cost, ease
of fabrication, and the ability to modify their properties
easily to ensure compatibility with fabrication processes.
The increased use of thin polymer films in microelectronic
applications has resulted in the need for new characteri-
zation methods because these films are much smaller and
thinner than polymer films used previously and are there-
fore not always compatible with existing characterization
techniques. For example, the curing processes of some
new high-temperature polymer films are not fully under-
stood. Of particular interest are changes in mass and vis-
coelasticity during curing. Thermogravimetry, a common
method used to study curing, is the measurement of mass
changes caused by outgassing of solvents and other chemi-
cal changes in polymers during curing. It involves heating
the sample while simultaneously weighing it on a precision
balance. The balances currently used can measure mass
changes of the order of micrograms. The mass changes in
thin polymer films are in the parts per million range, so,
a relatively large amount of the polymer must be tested to
obtain mass changes that are measurable by these bal-
ances. This results in measuring the bulk properties of
the polymer which can be significantly different from the
0
−1
−0.8
−0.6
−0.4
−0.2
0
0.2
0.4
50 100 150 200 250 300 350 400
300
200
100
0
−100
−200
−300
−400
Relative phase (deg)
Relative amplitude
(arbitrary units)
Temperature (deg C)
Amplitude Phase
Film resonance
First harmonic
Figure 8. The temperature-compensated phase and amplitude
response of a polyimide film during cure (24).
thin film properties. Therefore, a highly sensitive tech-
nique isneeded to monitor mass andviscoelastic changes in
thin polymer films during curing. A surface acoustic wave
(SAW) system was developed that can measure the mass
lost due to water outgassing during the cure of thin poly-
mer films in a temperature range of 20 to 400
◦
C. It can
also measure the apparent glass transition temperature of
acoustically thin films and film resonance of acoustically
thick films. The principle limitations of the system were
the limited accuracy of temperature compensation and the
limited ability to separate mass loss effects from viscoelas-
tic effects.
The SAW sensor used was similar to that in Fig. 1, and
the polymer film to be tested was applied to the delay path.
A sensor test chamber contained the SAW sensor and a
heater and allowed dry nitrogen gas purging to prevent
water sorption by the polymers. The temperature compen-
sation was done by curve fitting the temperature response
data of an uncoated sensor because this provided much
better compensation than the dual delay line technique at
this high temperature range.
Figure 8 (24) shows the temperature-compensated am-
plitude and phase responses for a 1.2-µm thick polyimide
film. Boththe phaseand amplitudeinitially decreasedwith
increasing temperature, indicating that the polymer was
softening, until a minimum in amplitude was reached at
about 135
◦
C. Because the phase continued to decrease at
this temperature, this corresponds to the apparent glass
transition temperature (a function of the sensor operat-
ing frequency) described by Martin et al. (7). The first
film resonance point is indicated by the second amplitude
minimum at 255
◦
C because it corresponds to a sharp in-
crease in phase. There was also a phase increase of 43
◦
between 175 and 210
◦
C which was attributed to water out-
gassing caused by the reaction of the polyamic acid to form
polyimide monomers. This agrees reasonably with the pre-
dicted 65
◦
phase change based on the expected mass lost
due to water outgassing. It also agrees with work done
by others (25) which showed that the water outgassing of
polyimide during cure occurs between 175 and 225
◦
C. The
difference in the measured and theoretical phase change
may be accounted for by partial imidization during the soft
bake of the polymer application process or by further soft-
ening of the polymer. A second resonance point was also