Báo cáo y học: "Inflammatory Signals shift from adipose to liver during high fat feeding and influence the development of steatohepatitis in mice" pot
Bạn đang xem bản rút gọn của tài liệu. Xem và tải ngay bản đầy đủ của tài liệu tại đây (3.29 MB, 14 trang )
RESEARCH Open Access
Inflammatory Signals shift from adipose to liver
during high fat feeding and influence the
development of steatohepatitis in mice
Michaela C Stanton
1
, Shu-Cheng Chen
2
, James V Jackson
1
, Alberto Rojas-Triana
1
, David Kinsley
2
, Long Cui
2
,
Jay S Fine
2,3
, Scott Greenfeder
1
, Loretta A Bober
1
, Chung-Her Jenh
1*
Abstract
Background: Obesity and inflammation are highly integrated processes in the pathogenesis of insulin resistance,
diabetes, dyslipidemia, and non-alcoholic fatty liver disease. Molecular mechanisms underlying inflammatory events
during high fat diet-induced obesity are poorly defined in mouse models of obesity. This work investigated gene
activation signals integral to the temporal development of obesity.
Methods: Gene expression analysis in multiple organs from obese mice was done with Taqman Low Density Array
(TLDA) using a panel of 92 genes representing cell markers, cytokines, chemokines, metabolic, and activation
genes. Mice were monitored for systemic cha nges characteristic of the disease, including hyperinsulinemia, body
weight, and liver enzymes. Liver steatosis and fibrosis as well as cellular infiltrates in liver and adipose tissues were
analyzed by histology and immunohistochemistry.
Results: Obese C57BL/6 mice were fed with high fat and cholesterol diet (HFC) for 6, 16 and 26 weeks. Here we
report that the mRNA levels of macrophage and inflammation associated genes were strongly upregulated at
different time points in adipose tissues (6-16 weeks) and liver (16-26 weeks), after the start of HFC feeding. CD11b
+
and CD11c
+
macrophages highly infiltrated HFC liver at 16 and 26 wee ks. We found clear evidence that signals for
IL-1b, IL1RN, TNF-a and TGFb-1 are present in both adipose and liver tissues and that these are linked to the
development of inflammation and insulin resistance in the HFC-fed mice.
Conclusions: Macrophage infiltration accompanied by severe inflammation and metabolic changes occurred in both
adipose and liver tissues with a temporal shift in these signals depending upon the d uration of HFC f eeding. The
evidences of gene e xpression profile, elevated serum alanine aminotransferase, and histological data support a progression
towards nonalcoholic fatty liver disease and steatohepatitis in these H FC-fed mice within the t ime frame of 26 weeks.
Background
Increased adiposity with the conseq uence of chronic low-
grade inflammation and insulin resistance or type 2 dia-
betes has been linked to the development of nonalcoholic
fatty liver disease (NAFLD). Currently, up to 30 percent
of the g eneral population is affected by NAFLD with 35
to 50 percent of obese adults also being diagnosed with
nonalcoholic steatohepatitis (NASH). NAFLD has been
described as the emerging clinical problem for the ob ese
patient in the 21
st
century [1]. The pathways that are
active in promoting this disease process i n the liver both
in humans and in mouse models are poorly understood
and are an active area of research.
There are a number of observations in the literature
linking adiposity with inflammation and increased liver
disease. Adipose tissue from obese people contains an
increased number of CD68
+
macrophages with a pro-
inflamma tory phenotype [2]. In insulin-resistant patients
with fatty liver disease, there is a significant upregulation
of genes involved in fatty acid partitioning and binding
proteins, monocyte recruitment and inflamma tion [3].
Obese mice demonstrate a significant increase i n
* Correspondence:
1
Department of Cardiovascular and Metabolic Disease Research, Merck
Research Laboratories (formerly Schering-Plough Research Institute), 2015
Galloping Hill Road, Kenilworth, NJ 07033, USA
Full list of author information is available at the end of the article
Stanton et al. Journal of Inflammation 2011, 8:8
/>© 2011 Stanton et a l; licensee BioMed Central Ltd. This is an Open Access article distributed under the terms of the Cr eative Commons
Attribution License ( .0), which permits unrestricted use, distribution, and reproduction in
any medium, provided the original work is properly cited.
plasminogen activator in the fatty liver [4]. Likewise, the
absence of CCR2 protects the liver against fat accumula-
tion in the diet-induced obese mouse [5].
In the attemp t to model the human disease process in
rodents, researchers have used several versions of the
Western diet and have found differences in severity of dis-
ease and times of disease onset depending upon the type
of fats used for feeding. Mice fed diets high in trans fats
combined with high fructose in the drinking water develop
very aggressive liver disease within two months whereas
mice fed only 20% of calories fr om high fat deve lop liver
disease in nine months [6,7]. The genetic background of
the rodent (C57BL/6 versus DBA/2) as well as cholesterol
content of the diet and even the presence of endotoxin has
been documented to strongly influence the development
pattern of liver disease [8,9]. Zheng et al. [10] in our insti-
tution use a rodent model which incorporates a 45% fat
diet with 0.12% cholesterol to reflect approximate percen-
tages found in the Western diet. This rodent model has all
the hallmarks of obesity, insulin resistance, and liver stea-
tosis plus it offers the further advantage of proven use for
the investigation of therapeutic drugs relevant to these dis-
eases, such as ezetimibe [10].
As a prelude to the use of the model in other drug stu-
dies, we attempted t o determine the molecular pathways
that were activated in this mouse model of high fat and
cholesterol (HFC) feeding as the syndrome progressed
towards liver steatosis and fibrosis. We used a sensitive
andhighthroughputtechnology, Taqman Low Density
Array (TLDA) to study message expression profiling of 92
genes representing macrophage-associated, inflammation-
related and metabolism-driven genes in various tissues,
including the adipose tissues and liver at 6 weeks, midway
at 16 weeks and at 26 weeks post-HFC feeding. We report
here that there is an initial upregulation of genes in the
epididymal adipose tissue that is accompanied by a rela-
tively quiescent liver profile at 6 weeks post-HFC followed
by a dramatic shift in emphasis away from the epididymal
adipose tissue to liver tissue gene activation at 16 weeks
and 26 weeks. Capturing changes in gene expression pro-
files from different organ systems as disease progression of
the liver is actively occurring will allow valuable informa-
tion on molecular mechanisms leading to NAFLD and
NASH to be gathered in animal models of obesity and will
lead to the identification of new therapeutic targets.
Methods
Animals and Diet
Six week ol d C57BL/6 male mice (Charles River Labora-
tories, Wilmington, MA) were housed in individual cages
and kept at a temperature of 22°C and maintained on a
12:12 h light/dark cy cle. Three separate cohorts of mice
were used for these experiments so that evaluations could
be perfor me d at 6 weeks, 16 weeks and 26 weeks post-high
fat feeding. Mice were fed a semi-purified diet containing
high fat and cholesterol (45% Kcal from lard/soybean oil;
20% Kcal from protein; 35% Kcal from carbohydrate and
0.12% cholesterol by weight obtained from Research Diets
(D0401280; New Brunswick, NJ) beginning at 7 weeks of
age. Se parate cohorts of a ge-matched no r mal animals were
maintained on regular chow (Purina #5 053) which p rovides
24.65% Kcal from protein; 62.14% Kcal from carbohydrate;
and 13.2% Kcal from fat. The mineral and vitamin compo-
nents were comparable between the two diets. C57BL/6
mice do not all gain weight on a uniform basis when fed
this high fat diet. In order to minimize variability in our
gene analysis results, mice were selected for their suscept-
ibility to diet-induced obesity at day 21 following the start
of high fat and cholesterol (HFC) feeding. Animals were
considered to be diet-obese (DIO) if there was a seven
gram body weight gain or greater after 21 days. In the
cohorts of 150 mice started for each of these experiments,
approximately 17% of mice fail this selection criterion on
day 21 and are eliminated from further study. Body weight
was followed throughout the course of the experiment.
Total body fat was determined by use of a whole body
magnetic resonance imager (EchoMR11200; Echo Medical
Systems, Houston, TX).
The blood samples for analysis of insulin and glucose
were taken from overnight-fasted animals in the morn-
ing at approximately 10 am. This measurement was
done about three days prior to termination of the group.
Glucose and insulin concentrations (in Table 1) are pre-
sented in International Units as mmol/l and pmol/l,
respectively. Homeostatic model assessment (HOMA)
values were calculated as an estimate of insulin sensitiv-
ity using the formula: fasting plasma glucose (mm ol/l) ×
insulin (μU/ml) divided by 22.5. Higher values of
HOMA indicate the presence of reduced insulin sensi-
tivity in the animals [11]. The conversion of insulin
concentration from International Units is 1 μU/ml =
6 pmol/l. This conversion factor is stated in the SI units
table of the Journal of Diabetes Care.
Blood samples for lipid profile, cytokine analysis and
liver enzymes were taken on the day of termination
from non-fasted animals at approximately the same
time. All studies were carried out in our vivarium in
accordancewiththeGuidefortheCareandUseof
Laboratory Animals of the National Institutes of Health
and the Animal Welfare Act under the supervision of
our institutional Animal Care and Use Committee.
Serum Cytokines and Other Mediators
Serum was evaluated for GM-CSF, insulin, leptin,
MCP-1, IL-6, TNF-a, IL-10, IL12p70, IL-1b,KC(Meso
Scale D iscovery, Gaithersburg, MD); serum amyloid A
(Life Diagnostics, West Chester, PA); alanine amino-
transferase (ALT) (Catachem, Bridgeport, CA) and
Stanton et al. Journal of Inflammation 2011, 8:8
/>Page 2 of 14
adiponectin (R&D Diagnostics, Minneapolis, MN). Data
from cytokine and mediator evaluation is reported as
the mean (sem) of the group. All statistical analysis was
performed by Mann-Whitney U test using GraphPad
Instat version 3.06 for Windows XP (GraphPad Soft-
ware, San Diego, CA).
Histology and immunohistochemistry (IHC)
5 μm paraffin sections were stained by either hematoxy-
lin and eosin (H&E) or Masson trichrome stain [12].
For IHC and oil red O staining, frozen liver or adipose
tissues embedded in OCT were cut at 5 (IHC) or 10 μm
(oil red O) and freshly frozen i n -80°C freezer until use.
After fixation with acetone, tissue sections were incu-
bated with anti- CD11b (BD Bioscience), anti -CD11c
(Endogen) , anti-IL-1b (R&D) or anti-F4/80 (Serotec) for
1 h at room temperature followed by incubation with
either biotinylated rabbit anti-rat or donkey anti-goat
antibodies. Selective binding was visualized by the enzy-
matic reaction of an alkaline phosphatase (ABC kit, Vec-
tor) with its substr ate, permanent red (Dako).
Hematoxylin was used for counterstaining. Oil red O
staining was carried out as described [13].
RNA isolation and quantitative RT-PCR
Tissue collection and homogenization
Approximately 300-500 μl of blood from each mouse
was collected and added to a PAXgene blood RNA tube
containing ~1.3 ml of a proprietary reagent developed
by PreAnalytiX. Pa ncreas was isolated using a method
adapted from Mullin et al. [14]. Remaining tissues
(mesenteric lymph nodes, mesenteric fat pad, epididymal
fat pad, spleen, liver and gastrocnemius muscle) were
excised and flash frozen in liquid nitrogen.
A TissueLyser (Qiagen, Valencia, CA) was used to
homogenize and disrupt collected tissues in preparation
for total RNA extraction. A sterile 5 mm s tainless steel
bead and 1 ml QIAzol lysis reagent (for epididymal and
mesenteric fat pads), 350 μl buffer RLT (for mesenteric
lymph nodes) or 2 ml buffer RLT (for liver, spleen and
gastrocnemius muscle) was added to each 2 ml eppen-
dorf tube containing the frozen tissue piece. Tissues were
then agitated at 30 Hz for 2 × 2 minutes as per the
recommendations of the Qiagen TissueLyser handbook.
A handheld TissueMiser (Thermo-Fisher Scientific) was
used to homogenize and disrupt the pancreas tissues.
RNA isolation and cDNA synthesis
Total RNA isolation from all tissues was performed
according to manufacturer’ s protocol (Qiagen, Valencia,
CA). Optional on column DNase digestion was per-
formed on all tissues. Total RNA from blood w as iso-
lated o n the day it was co llected using PAXgene Blood
RNA kit. All isolated total RNA was stored at -80°C
until further use. RNA was quantified using the Nano-
Drop
®
ND-1000 spectrophotometer (Agilent Technolo-
gies, Santa Clara, CA). RNA quality was assessed by
Table 1 Assessment of serum metabolic parameters in diet-induced obese mice post-HFC initiation.
Parameter 6 weeks 16 weeks 26 weeks
HFC Chow fold
change
HFC Chow fold change HFC Chow fold change
Epididymal
fat pad, % 5.6 (0.8) 2.8 (0.1) 2.0 2.6 (0.2)* 3.8 (0.3) 0.7 2.4 (0.3)** 4.2 (0.4) 0.6
Mesenteric
fat pad, % 1.6 (0.1)* 0.9 (0.1) 1.8 2.1 (0.1) 1.6 (0.2) 1.3 1.9 (0.1) 1.9 (0.2) 1.0
Liver, % 3.6 (0.3) 3.7 (2) 1.0 7.3 (0.4)* 4.5 (0.4) 1.6 7.1 (0.4)* 4.6 (0.1) 1.5
ALT, U/ml 17 (2) 24 (3) 0.7 151 (24)* 31 (2) 4.9 76 (12)* 8 (1) 9.5
glucose, mmol/l 10.24 (0.25) 8.52 (0.25) 1.2 15.13 (0.54) 14.04 (0.46) 1.1 11.35 (0.28) 11.54 (0.34) 1.0
insulin, pmol/l 41.96 (2.81)* 28.85 (6.17) 1.5 436.49 (86.01)* 74.22 (9.97) 5.9 490.22 (55.19)* 278.26 (36.93) 1.8
HOMA 3.19 (0.24)* 1.92 (0.47) 1.7 47.83 (9.26)* 7.76 (1.14) 6.2 39.10 (3.35)* 24.12 (3.53) 1.6
adiponectin, μg/ml 6.7 (0.7) 6.0 (1) 1.1 12 (0.4)* 16 (0.8) 0.8 23 (3) 21 (2) 1.1
leptin, ng/ml 43 (10)* 0.5 (0.2) 86. 0 22 (6)* 4 (1) 5.5 46 (8)* 17 (3) 2.7
MCP-1, pg/ml 32 (2)* 26 (2) 1.2 36 (2)* 23 (2) 1.6 302 (26)* 134 (8) 2.3
IL-6, pg/ml 7 (1) 6 (1) 1.2 25 (6)* 12 (2) 2.1 33 (9)* 17 (5) 1.9
KC, pg/ml 32 (2) 21 (1) 1.5 67 (4) 44 (8) 1.5 98 (12)* 45 (4) 2.2
IL-10, pg/ml 15 (2) 27 (6) 0.6 124 (43) 47 (6) 2.6 45 (17)* 17 (6) 2.6
serum amyloid A
μg/ml 1.1 (0.02) 0.5 (0.2) 2.2 1.6 (0.7) 0.81 (0.05) 2.0 1.85 (0.2)* 0.43 (0.06) 4.3
Assessment was done at the termination point of 6, 16 or 26 weeks post-HF C initiation.
Values are means (sem), n = 14-20 per group. *confidence interval = 95%; **confidence interval = 99%.
The fold change is calculated as the level in HFC group divided by the level obtained from the Chow group.
The levels of GM-CSF, TNF-a, IL-12p70 and IL-1b were below detection limit of the assays.
Stanton et al. Journal of Inflammation 2011, 8:8
/>Page 3 of 14
running a 500-2000 ng sample on a MOPS buffered for-
maldehyde gel. First strand cDNA synthesis was per-
formed using the Applied Biosystems High Capacity
cDNA Reverse Transcription kit (Applied B iosystems,
Foster City, CA) according to manufacturer’sinstruc-
tions. To ensure equal loading of all samples on the
TLDA card, cDNA was quantified against an 18S stan-
dard curve prepar ed using hu man universal reference
total RNA purchased from Clontech (BD Biosciences
Clontech, Heidelberg, Germany).
Taqman Low Density Array
Quantitative real-time PCR utilized custom made Taq-
Man
®
Low Density Array (TLDA) from Applied Biosys-
tems and followed the manufacturer’ s instructions.
Thermal cycling was performed using an ABI Prism
7900HT Sequence Detection System. 100 ng cDNA i n
100 μl of Applied Biosystems 1X Universal PCR Master
mix was loaded onto each port of the TLDA plates.
Data was analyzed using SDS v2.2 software. The Ct
value of each gene is normalized to 18S to obtain ΔCt.
Relative quantitation or fold changes in gene expres sion
were determined using the formula 2
-ΔΔCt
,where
ΔΔCt = average ΔCt of all HFC-fed samples - average
ΔCt of all chow-fed samples. Statistical significance was
determined by two-tailed Welch t test using either
GraphPad Prism 4 or Microsoft Excel 2003, where P <
0.05 (*), P < 0.01 (**), and P < 0.001 (***). Unmarked
data points are not significant. The numbers o f mice in
each g roup are as f ollows: 7 Chow-fed and 15 HFC-fed
mice at 6 weeks; 8 Chow-fed and 10 HFC-fed mice at
16 weeks; and 10 Chow-fed and 12 HFC-fed mice at 26
weeks.
Results
To qualify our animal model as described previously by
Zheng et al. [10] we have characterized the animals by
tracking their body weight changes and the levels of
serum mediators and cytokines throughout the time
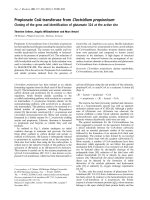
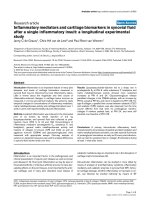
course. The percent body weight increased progressively
in the HFC-fed mice over the 6 to 16 week study period
and was maximal at 26 weeks post-HFC (Figure 1A).
This body weight increase was accompanied by an
increase i n fat mass (gms) determined by MRI (Figure
1B). There was no effect of diet treatment on lean body
mass. The HOMA index (Table 1) indicates that the
high fat fed mice developed a significant degree of insu-
lin resistance at the time points measured for this
experiment. The epididymal fat pad measured at 6
weeks was the organ most striking ly affected when com-
pared to the chow-fed animals. However, as the experi-
ment progressed to 16 and 26 weeks, the epididymal fat
pad weight as a percent of body weight actually
decreased (Table 1). The liver weight (expressed as a
percent of body weight ) of the 6-week HFC-fed mice
was unchanged from chow-fed controls; however, the
liver weigh t of 16- and 26-week HFC-fed mice showed a
continuous increase relative to the chow-fed mice. This
increase in liver weight at 16 and 26 weeks was accom-
panied by an increase in the serum levels of alanine
aminotransferase (ALT), indicative of progressive liver
damage (Table 1).
We measured a variety of serum cytokines and media-
tors from these animals at the observation points. We
found that there was a large degree of variability in
these animals despite pre-selection for diet-induced obe-
sity (DIO). We routinely kept the animals on a HFC
diet for 3 weeks prior to entrance into the experimental
cohorts to ensure that all animals chosen had at least a
30% increase in body weight when compared to chow-
fed mice. Of the adipokines measured, serum leptin
(
A
)
(B)
Figure 1 Percentbodyweightgainandfatmassincreasein
HFC-fed mice over time. A: Percent body weight gain over time.
All time points plotted are P < 0.01 for 45% high fat + 0.12%
cholesterol (HFC) vs. chow-diet (CHOW), Mann-Whitney U test.
Animals selected at day 21 for increased body weight (DIO; diet-
induced obesity). B: Body Density Parameters determined by MRI
Analysis. *P < 0.0001 for fat mass of HFC vs. CHOW, Mann-Whitney
U test.
Stanton et al. Journal of Inflammation 2011, 8:8
/>Page 4 of 14
levels continually increased o ver time (Table 1). Adipo-
nectin decreased only at 16 weeks of HFC feeding. Of
the chemokines tested, MCP-1 (CCL2) was elevated
throughout the observation periods in the HFC-fed
mice; KC levels although higher than those of the chow-
fed mice were not significantly elevated until 26 weeks
post-HFC. Of the pro-inflammatory cytokines measured,
IL-6 showed a modest increase at 16 and 26 weeks
post-HFC. We did not obtain apprec iable increases in
circulating levels of GM-CSF, TNF-a,IL-12p70and
IL-1b in these HFC-mice. Serum amyloid A (SAA) levels
were variable at 6 and 16 weeks post-HFC but wer e sig-
nificantlyelevatedintheHFC-fedmiceat26weeks
post-HFC. IL-10 levels were increased in the serum of
the HFC-fed mice at 16 weeks but were highly variable.
At 26 weeks, IL-10 levels were more consistently ele-
vated o ver the chow -fed controls. These measurements
over the course of HFC feeding demonstrated that there
was an inflammatory milieu in these mice.
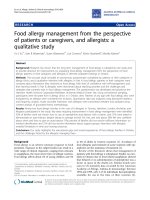
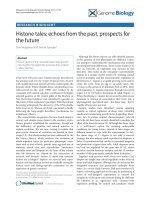
Histological analysis reveals hepatic steatosis and
inflammation in HFC-fed mice
Histological examination with both H&E and oil red O
staining of liver sections from HFC-fed mice demon-
strated a progressive development of steatosis coupled
with inflammation as shown in Figure 2. No macrovesi-
cular steatosis was observed in livers from chow-fed
mice at 6 and 16 weeks (Figure 2, A-B for H&E and
2G-H for oil red O). Low grade macrovesicular steatosis
was observed in the chow-fed group only at week 26
(Figure 2C for H&E and 2I for oil red O). In contrast to
the chow-fed group, macrovesicular steatosis was
observed in HFC liver as early as 6 weeks after exposure
to HFC d iet. At this t ime point, the fat droplets were
distributedinzone2and3withthemajorityinthe
intermediate zone (zone 2) between portal and central
veins as shown on H&E stained section (Figure 2D) and
this observation was further confirmed with oil red O
staining (Figure 2J). No cytoplasmic foamy changes were
foundatthistime.Thenumberandthesizeoffatdro-
plets were dramatically increased by week 16 and 26 as
evident from sections stained with oil-red O (Figure 2,
E-F for H&E and 2K-L for oil red O). In addition to
steatosis, signs of inflammation including infiltration of
inflammatory cells (see insert of Figure 2E) and focal
fibrosis, revealed by tric hrome stain (Figure 2M and 2N)
were readily observed in th e HFC liver at 16-26 weeks
post-HFC.
Gene expression profiling reveals profound inflammatory
gene regulation specifically in adipose and liver tissues of
HFC-fed mice
To study the molecular mechanisms and pathways
underlying chronic inflammation and insulin resistance,
we utilized a custom-designed gene card to perform
Taqman Low Density Array (TLDA) with multiple tis-
sues taken from HFC- and chow-fed mice. We used
previous comparisons to validate the results from TLDA
by conventional quantitative real-time RT-PCR which
then allowed us to choose TLDA as a high throughput
assay for multiple gene expression profiling throughout
this study. The gene card contains 92 unique genes cho-
sen from their known functions associated with macro-
phages, adipokines, cytokines, chemokines, insulin
signalling, endoplasmic reticulum stress, and glucose,
lipid and energy metabolism (see Additional File 1 for
details). The overall gene expression profiling reveals
profound gene regulation in epididymal adipose tissue,
mesenteric adipose tissue and liver (summarized in
Additio nal File 2). There was either minor or no change
of these genes in blood cells, muscle, pancreas, spleen
and lymph nodes, based mostly o n the results from
pooled RNA samples (see Additional File 3). Our ge ne
expression profiles in adipose and liver tissues estab-
lished that there is a definitive presence of macrophage
infiltration and inflammatory signals that is induced by
obesity in HFC-fed mice. Here, we describe differential
regulation of several group s of important genes involved
in chronic inflammation and insulin resistance in adi-
pose (epididymal and mesenteric fat pads) and liver
tissues.
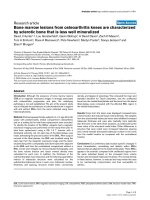
mRNA levels of genes involved in macrophage
recruitment are strongly upregulated early in adipose
tissues and progressively switched to liver of HFC- fed
mice
mRNA levels of genes involved in macrophage recruit-
ment including inflammatory chemokines (CCL2, CCL7,
CCL8), chemokine receptor (CCR2) and adhesion mole-
cules (ICAM1, VCAM1), were upregulated in epididy-
mal (EF) adipose tissues at 6 weeks of HFC feeding
(Figure 3). In contrast, in mesenteric (MF) adipose tissue
at this time period, only the mRNA levels of genes cod-
ing for CCR2, ICAM1, VCAM1 were upregulated but
not those of the chemokines. This differential upregula-
tion may provide the early inflamm atory signal for
recruiting circulating monocytes into the adipose tissues
of different areas. At this time point, there was no sig-
nificant change in expression of these genes in liver.
The strong upregulation of mRNA levels of these genes
in adipose tissues at 6 weeks was mostly decreased when
the dur ation of HFC feeding increased to 16 weeks and
26 weeks. The dramatic decrease of relative mRNA level
(fold change) at 16 weeks resulted from a decrease of
mRNA levels in the HFC group and a concomitant
increase of mRNA levels in the chow group. Intriguingly,
mRNA levels of these genes were highly upregulated in
liver at 16 weeks and even further increased at 26 weeks
Stanton et al. Journal of Inflammation 2011, 8:8
/>Page 5 of 14
MN
L
BC
D
JK
I
EF
A
GH
Figure 2 Steatosis, inflammation and fibrosis in livers of HFC-fed mice. Liver sections from 6 (A, D, G, J), 16 (B, E, H, K, M, N) and 26 (C, F, I,
L) weeks of chow (A-C, G-I, M) and HFC (D-F, J-L, N) fed mice were analyzed histologically. A-F, H&E stain. Cellular infiltrates are readily seen
throughout 16 and 26 weeks of HFC livers and is illustrated in the insert of E. G-L, Oil red O stain. Increased focal fibrosis as demonstrated by
trichrome stain was found in livers of some HFC-fed mice at 16 weeks (N) or later as compared to 16 week chow-fed liver (M). A-L bar = 0.15
mm. M&N, bar = 0.075 mm.
Stanton et al. Journal of Inflammation 2011, 8:8
/>Page 6 of 14
of HFC feeding (Figure 3). This is the first finding of sig-
nificant gene regulation in the liver of these obese mice.
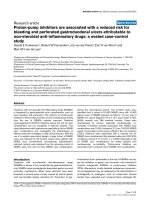
HFC diet induces macrophage infiltration and
accumulation in adipose and liver tissues
To investigate macrophage infiltration and accumulation
following exposure to HFC diet, gene expression profiles
of several macrophage markers and proteases were eval-
uated.AsshowninFigure4,mRNAlevelsoffour
macrophage markers CD11c, CD11b, CD68 and F4/80,
were highly upregulated in HFC adipose tissue at all
time points analyzed as compared to chow-fed mice and
peaked at 16 weeks of HFC feeding (Figure 4A).
Another macrophage marker CD83 was upregulated in
a similar manner (See Additio nal File 2). Two proteases
(MMP12 and C TSS) known t o be highly expressed in
macrophages a lso had a similar gene expression profile
as those macrophage markers (Figure 4B). Again,
significant upregulation of these macrophage markers in
liver was delayed until 16 weeks of HFC feeding.
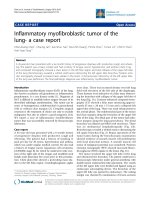
To confirm increased macrophage accumulation in the
liver we performed IHC w ith anti-CD11b and anti-
CD11c antibodies (Figure 5). Occasionally, small groups
of CD11b
+
or CD11c
+
aggregates were observed among
the groups of extramedullary hematopoietic (EMH) cells
(Figure 5A and 5B ). Consistent with findings by RT-
PCR, no significant increa se of CD11b
+
or CD11c
+
cells
were found in livers from chow-fed groups at all time
points (data of later time points not s hown) or at
6 weeks post-HFC as compared to chow controls
(Figure 5). However, at 16 and 26 weeks post-HFC, a
significant increase in inflammatory cell numbers was
found in th e liver sections of the HFC mice. In additio n
to the increased numbers of cells at these time points,
these cells also appeared to be enlarged and demon-
strated a morphology suggesting an activated state,
Figure 3 Genes involved in macrophage recruitment are differentially upregulated in adipose and liver tissues of HFC-fed mice.EF
stands for epididymal fat pad and MF for mesenteric fat pad. Data are presented as fold change of mRNA levels in HFC group vs. chow group.
Statistical significance was determined by two-tailed Welch t test where P < 0.05 (*), P < 0.01 (**), and P < 0.001 (***) (details in Methods).
Stanton et al. Journal of Inflammation 2011, 8:8
/>Page 7 of 14
which was consistent with the upregulation of CD83
mRNA. Macrophage infiltration into adipose tissues was
also investigated throughout the same time course. Con-
sistent to TLDA data, in the epididymal fat (EF) macro-
phage infiltrates peaked at week 16 and decline d at
week 26 post-HFC (Figure 5I-K). Occasionally, focal
massive infiltrates of CD11b
+
or CD11c
+
cells were also
observed in both 16- and 26-week HFC livers (Figure 5L
and 5M). These two populations of cells appear to co-
exist in the same area as demonstrated by the use of
adjacent sections.
mRNA levels of pro-inflammatory cytokine genes are
differentially upregulated in both adipose and liver
tissues of HFC-fed mice
A complex regulation of pro-inflammatory cytokine
genes was observed at different time points in both adi-
pose and liver tissues, underlying both disease-promoting
and compensatory mechanisms (Figure 6 and 7). As an
example, we determined that the mRNA level of IL-1b
increased throughout the time course in both adipose tis-
sues (EF and MF), as shown by both decrease in ΔCt
(increas e in expression level) and increase in fold change
(A)
(B)
Figure 4 Strong upregulation of mRNA levels of macrophage markers and proteases provides a direct evidence for macrophage
infiltration. (A) macrophage markers and (B) proteases. EF stands for epididymal fat pad and MF for mesenteric fat pad. Data are presented as
fold change of mRNA levels in HFC group vs. chow group. Statistical significance was determined by two-tailed Welch t test where P < 0.05 (*),
P < 0.01 (**), and P < 0.001 (***) (details in Methods).
Stanton et al. Journal of Inflammation 2011, 8:8
/>Page 8 of 14
A E
I
B F
J
C
G
KD
H
L M
Anti-CD11b (liver) Anti-CD11c (liver)
Anti-F4/80 (EF)
Figure 5 Macrophage infiltration in HFC-fed liver and adipose tissues. Liver (A-H, L&M) and epididymal fat (I-K) tissues from 6 week chow-
fed (A, E), 6 week HFC-fed (B, F, I), 16 week HFC-fed (C, G, J, L, M) and 26 week HFC-fed (D, H, K) mice were analyzed with
immunohistochemistry using anti-CD11b (A-D), anti-CD11c (E-H) and anti-F4/80 (I-K). L&M are adjacent sections incubated with either anti-CD11b
(L) or anti-CD11c (M) demonstrating similar patterns of cellular infiltrates in the same area of the sections. Arrows in A&E point to groups of
aggregates associated with EMH. bar = 0.15 mm.
Stanton et al. Journal of Inflammation 2011, 8:8
/>Page 9 of 14
(Figure 6). However, analysis of IL-1 receptor antagonist
(IL1RN) showed that although there was a dramatic
increase at 6 weeks of HFC feeding, this was followed by
a substantial decrease in the expression level of IL1RN at
16 weeks and 26 weeks of HFC feeding. In contrast,
IL-18 was not significantly regulated in the HFC-fed
mice (See Additional File 2). In addition, the rela tive
mRNA levels of TNF-a,TACE(Figure6)andTGFb-1
(Figure 7) were upregulated throughout the time course
in both adipose tissues. The relative mRNA levels o f
IL-6, IL-10 and IFN-g were consistently elevated in
mesenteric (MF) adipose tissue, rather than in epididymal
(EF) adipose tissue (Figure 7).
In the liver, mRNA levels of IL-1b,IL1RN,TNF-a,
IFN-g and TGFb-1 were highly upregulated at 16 weeks
of HFC feeding and further increased at 26 weeks
Figure 6 IL-1b,IL1RN,TNF-a and TACE genes are differentially upregulated in both adipose and l iver tissues of HFC-fed mice.
Expression levels of IL-1b, IL1RN, TNF-a and TACE genes from chow (in black) and HFC (in red) fed mice at each time point are presented as
average ΔCt of all animals in each group (details in Methods). The smaller ΔCt value indicates the higher expression level. EF stands for
epididymal fat pad and MF for mesenteric fat pad. The MF sample of 6 week/Chow and the liver samples of 6 week/Chow and 6 week/HFC had
no signal for IL1RN because of very low expression level. In addition, the fold change of mRNA levels in HFC group vs. chow group is also
presented below the expression level panel for each gene. Statistical significance was determined by two-tailed Welch t test where P < 0.05 (*),
P < 0.01 (**), and P < 0.001 (***).
Stanton et al. Journal of Inflammation 2011, 8:8
/>Page 10 of 14
(Figure 6 and 7), suggesting the presence of severe
inflammation. To confirm an elevation at the protein
level, we examined the expression of IL-1b in liver by
IHC (Figure 8). In general, there was no significant
IL-1b expression in chow-fed livers, except for occa-
sional small groups of aggregates, as shown in the insert
of Figure 8A. Consistent with its mRNA profile, the
numbers of IL-1b
+
cells increased with time in HFC-fed
animals (Fig ure 8B) indicating the relevance of IL-1b to
liver inflammation. No significant change of IL-1b
expression was observed throughout t he time course in
the livers of the chow-fed animals.
Discussion
Our work on gene activation in the HFC-fed mouse
model is an attempt to accurately predict the sites of
drug intervention and to possibly discover new targets
in the mechanisms leading up to the induction of overt
Figure 7 IL-6, IL-10, IFN-g and TGFb-1 genes are differentially upregulated in both adipose and liver tissues of HFC-fed mice. Expression
levels of IL-6, IL-10, IFN-g and TGFb-1 from chow (in black) and HFC (in red) fed mice at each time point are presented as average ΔCt of all
animals in each group. The smaller ΔCt value indicates the higher expression level. EF stands for epididymal fat pad and MF for mesenteric fat
pad. In addition, the fold change of mRNA levels in HFC group vs. chow group is also presented below the expression level panel for each
gene. Statistical significance was determined by two-tailed Welch t test where P < 0.05 (*), P < 0.01 (**), and P < 0.001 (***).
Stanton et al. Journal of Inflammation 2011, 8:8
/>Page 11 of 14
NASH disease. This paper describes a kinetic study for
the direct temporal and spatial comparison of gene acti-
vation in a variety of organs as compared to age-
matched chow-fed controls. First, a time dependent,
diet-induced development of liver histopathology remi-
niscent of NASH, including steatosis, fibrosis and
inflammatory infiltrates, was observed in the animal
model used in our study of gene expressio n. Analysis of
temporal inflammatory gene expression in multiple
organs was carried out by TLDA. The epididymal adi-
pose, mesenteric adipose and liver tissues show defini-
tive time-dependent gene activation. In particular, those
gen es representing inflammatory mediators change dra-
matically over time. Gene activation to a various degree
was also observed in other organ systems s uch as th e
bloo d cells, spleen, lymph nodes, gastrocnemius muscle,
or pancreas but these gene patterns do not appear in
any discernible pattern that would impa ct the induction
of liver disease.
We report here that gene activation occurs early in
the epididymal adipose with the peak activation at 6
weeks post-HFC. This activity in this particular adipose
tissue is followed by a definitive increase in inflamma-
tory signals in the liver at 16 weeks and 26 weeks post-
HFC feeding. On the contrary, activated genes were
downregulated in the epididymal fat pad at these later
time points. This switch in activation profile from epidi-
dymal adipose tissue to liver as determined by quan tita-
tive RT-PC R was corroborated by the finding that there
were significant increases in CD11b
+
or CD11c
+
macro-
phages in the liver at 16 weeks and 26 weeks post-HFC
as well as by an increased accumulation of fatty droplets
in the liver. These “activated macrophages” were not
seen in the 6 week HFC livers when evaluated versus
age-matched chow-fed control mice nor were there as
many fatty droplets at this early time point. This
increase in cellularity in the liver also appears in human
disease. Genes involved in monocyte/macr ophage
recruitment are over-expressed in the livers of insulin-
resistant human patients [3] and it is well-established
that macrophages will accumulate both in adipose and
liver under the influence of inflammatory signals
[15,16]. Furthermore, the reduction in gene activation
observed in the epididymal adipose tissues at the later
time point was acc ompanied by a decreased number of
macrophages in this fat pad at 2 6 weeks post-HFC.
Thesedatasuggestthatatriggerforinductionof
inflammation was first set off in the adipose tissue and
then sent out to other organ systems as fat feeding con-
tinued over time. This adipose-initiated signal sets up a
process which results in overt liver disease by 26 weeks.
TLDA results of the mesenteric adipose tissue from
HFC-fed mice indicate that inflammatory mediators and
cell activation signals are also induced in this fat depot.
This adipose tissue, however, does not appear to shift as
dramatically in gene activation profile as that of the epi-
didymal fat pad. This continual generation of cytokine
and mediator gene signals found within the mesenteric
fat amplifies the shift toward enhanced gene activation
of the liver in these HFC-fed mice. It has been reported
that the omental fat pad in obese humans can serve as a
steady-state generator of inflammatory mediators which
will then impact the development of disease [17].
Within the panel of genes included in our analysis,
which ranges from metabolic to cellular markers to
inflammatory mediators, IL-1b is identified as one of
the most relevant inflammatory mediator as the disease
induction process shifts from the inflamed epididymal
adipose tissue to the liver. This enhanced IL-1 signal is
relevant to current research findings in human meta-
bolic disease. In obese patients, mRNA levels of IL-1
receptor antagonist (IL-1Ra) and IL-1 receptor type 1
(IL-1R1) are markedly upregulated in white adipose
tissue. In addition, IL-1b gene expression was se lec-
tively increased in the visceral fat (but not subcuta-
neous fat) from obese subjects [18]. In patients with
AB
Figure 8 Increased number of IL-1b
+
cells in the liver of HFC-fed mice. Immunohistochemistry of anti-IL-1b demonstrated increased
number of IL-1b
+
cells in HFC-fed liver at 16 weeks (B) as compared to 16 week chow-fed liver (A). Occasionally, small groups of IL-1b
+
aggregates were also detected in chow-fed livers at all time points (insert of A, 6 week chow-fed). bar = 0.075 mm.
Stanton et al. Journal of Inflammation 2011, 8:8
/>Page 12 of 14
type 2 diabetes, the use of Anakinra (IL-1Ra) improved
glycemia and beta-cell secretory function and reduced
markers of systemic inflammation (CRP, IL-6) [19].
Recent positive clinical results from a small trial with
high affinity anti-human IL-1b (XOMA 052) also sup-
port targeting IL-1b mediated inflammatory damage to
pancreatic beta cells as a potential therapeutic
approach for type 2 diabetes [20]. The use of TLDA
technology applied to this mouse model can reveal
further activated or dysregulated gene signals that will
be relevant to human disease.
Excessive pro-inflammatory stimulation enhances the
development of steatosis and NASH. In patients with
acute and chronic liver diseases, production of IL-1
alters as the liver disease shifts in intensity from acute
to chronic cirrhosis [21]. At present, it appears that a
certain mix of cytokines plus a genetic predisposition to
hepatic immune defects may be needed to facilitate pro-
gression of NASH to cirrhosis [22]. Our work demon-
strates that there is very strong and relevant cross-talk
between organ systems of the adipose tissue and the
liver in our HFC mo use model which is also dependent
upon the genot ype of the mouse [23]. Use of the TLDA
technology to track gene changes over a time line will
help to unravel some of this immune conversation and
to identify whether new therapeutics can make these
gene signals quiescent.
Conclusions
In the present study, we utilized the mouse model with
a diet containing 45% fat and 0.12% cholesterol (as
found in the Western diet) to investigate the molecular
signals that trigger insulin resistance, hyperinsulinemia
and progression to liver steatosis and fibrosis in the
diet-induced obesity (DIO) mouse model. We used a
sensitive and high throughput technology, Taqman Low
Density Array (TLDA), to study gene expression profil-
ing of 92 important genes representing macrophage-
ass ociated, inflammation-related and metabolism-driv en
genes in multiple tissues at 6 weeks, 16 weeks and
26 weeks post high fat and cholesterol (HFC) feeding.
We demonstrate from our ana lysis of the gene activa-
tion profiles that macrophage infiltration accompanied
by severe inflammation and metabolic changes occurs in
both adipose and liver tissues with a temporal shift in
the levels of these signals depending upon the duration
of HFC f eeding. This gene ac tivation initiates early at
6 weeks post-HFC feeding in epididymal adipose tissues.
Activation signals then switch to the liver at 16 and
26 weeks post-HFC feeding. These findings of time
dependent development of steatosis in the liver are sup-
ported by immu nohistochemistry. Taken together, the
evidences of gene expression profile, elevated serum ala-
nine aminotransferase, increased liver to body weight
ratio, and histological data support a progression driven
by diet-induced inflammation towards nonalcoholic fatty
liver disease and even nonalcoholic steatohepatitis in
these HFC-fed mice within the time frame of 26 weeks.
Additional material
Additional file 1: Table S1. The table shows a list of 92 genes designed
on the gene card for Taqman Low Density Array. Table S1. The gene
panel for gene expression study by Taqman Low Density Array
Additional file 2: Table S2, S3, and S4. High fat and cholesterol diet
(HFC) induced gene regulation in epididymal adipose tissues, mesenteric
adipose tissues and liver of C57BL/6 mice. These tables contain the gene
expression profile of all genes in this study. Table S2. The gene
expression profile in epididymal adipose tissues of HFC-fed mice Table
S3. The gene expression profile in mesenteric adipose tissues of HFC-
fed mice. Table S4. The gene expression profile in liver of HFC-fed mice
Additional file 3: Table S5 and S6. High fat and cholesterol diet (HFC)
induced gene regulation in blood cell, muscle, spleen, lymph node and
pancreas tissues of C57BL/6 mice. These tables contain the gene
expression profile of all genes in this study, mostly from pooled RNAs
without statistical analyses. Table S5. The gene expression profile in
blood cells, muscle and spleen tissues. Table S6. The gene expression
profile in lymph node and pancreas tissues
Abbreviations
TLDA: taqman low density array; HFC: high fat and cholesterol diet; IL-1β:
interleukin-1β; IL1RN: interleukin 1 receptor antagonist; TNF-α: tumor
necrosis factor-α; TGFβ-1: transforming growth factor β-1; NAFLD:
nonalcoholic fatty liver disease; NASH: nonalcoholic steatohepatitis; GM-CSF:
granulocyte macrophage-colony stimulating factor; MCP-1: monocyte
chemoattractant protein-1; KC: keratinocyte chemoattractant; ALT: alanine
aminotransferase; CCL2: chemokine (C-C motif) ligand 2; CCR2: chemokine
(C-C motif) receptor 2; ICAM1: intercellular adhesion molecule 1; VCAM1:
vascular cell adhesion molecule 1; MMP12: matrix metalloproteinase 12;
CTSS: cathepsin S; TACE: TNF-α converting enzyme; IFN-γ: interferon-γ; SAA:
serum amyloid A.
Acknowledgements
We would like to thank Drs. Daniel Lundell, Timothy Kowalski, Eric Gustafson,
Margaret van Heek, Joyce Hwa, Jean Lachowicz, Marvin Bayne, Hong Lan,
Joseph Hedrick, Chuan-Chu Chou, Denise Manfra, Ethan Grant, and Qing
Zhang for their support and advice. We also like to thank Rui Yu for her
technical support. The study and manuscript preparation is supported by
Schering-Plough Research Institute now Merck Research Laboratories.
Author details
1
Department of Cardiovascular and Metabolic Disease Research, Merck
Research Laboratories (formerly Schering-Plough Research Institute), 2015
Galloping Hill Road, Kenilworth, NJ 07033, USA.
2
Department of
Inflammation, Merck Research Laboratories (formerly Schering-Plough
Research Institute), 2015 Galloping Hill Road, Kenilworth, NJ 07033, USA.
3
Current Address: Hoffmann-La Roche Inc., Nutley, NJ, USA.
Authors’ contributions
MCS isolated RNA from all tissues, carried out Taqman Low Density Array
and data analyses. SCC designed the histologic and immunohistochemical
studies, analyzed the data, drafted part of the manuscript and prepared the
histology and IHC figures. ART and JVJ carried out mouse models and
evaluated serum cytokines and other mediators. DK carried out the histology
and IHC works. LC performed in situ ductal perfusion into the pancreas and
harvested multiple tissues from all mice. JSF participated in the design of
the study and selection of the gene list. SG participated in the design of the
study, data discussion and supported the preparation of the manuscript. LAB
supervised mouse models, participated in the design of the study, analyzed
Stanton et al. Journal of Inflammation 2011, 8:8
/>Page 13 of 14
serum data and drafted part of the manuscript. CHJ designed the gene list,
coordinated the study, performed statistical analyses and wrote the
manuscript. All authors read and approved the final manuscript.
Competing interests
The authors declare that they have no competing interests.
Received: 28 July 2010 Accepted: 16 March 2011
Published: 16 March 2011
References
1. Festi D, Colecchia A, Sacco T, Bondi M, Roda E, Marchesini G: Hepatic
steatosis in obese patients: clinical aspects and prognostic significance.
Obes Rev 2004, 5:27-42.
2. Westerbacka J, Cornér A, Kolak M, Makkonen J, Turpeinen U, Hamsten A,
Fisher RM, Yki-Järvinen H: Insulin regulation of MCP-1 in human adipose
tissue of obese and lean women. Am J Physiol Endocrinol Metab 2008,
294:E841-845.
3. Westerbacka J, Kolak M, Kiviluoto T, Arkkila P, Sirén J, Hamsten A, Fisher RM,
Yki-Järvinen H: Genes involved in fatty acid partitioning and binding,
lipolysis, monocyte/macrophage recruitment, and inflammation are
overexpressed in the human fatty liver of insulin-resistant subjects.
Diabetes 2007, 56:2759-2765.
4. Alessi MC, Bastelica D, Mavri A, Morange P, Berthet B, Grino M, Juhan-
Vague I: Plasma PAI-1 levels are more strongly related to liver steatosis
than to adipose tissue accumulation. Arterioscler Thromb Vasc Biol 2003,
23:1262-1268.
5. Weisberg SP, Hunter D, Huber R, Lemieux J, Slaymaker S, Vaddi K, Charo I,
Leibel RL, Ferrante AW Jr: CCR2 modulates inflammatory and metabolic
effects of high-fat feeding. J Clin Invest 2006, 116:115-124.
6. Tetri LH, Basaranoglu M, Brunt EM, Yerian LM, Neuschwander-Tetri BA:
Severe NAFLD with hepatic necroinflammatory changes in mice fed
transfats and a high-fructose corn syrup equivalent. Am J Physiol
Gastrointestinal Liver Physiol 2008, 295:G987-G995.
7. Morgan K, Uyuni A, Nandgiri G, Mao L, Castaneda L, Kathirvel E, French SW,
Morgan TR: Altered expression of transcription factors and genes
regulating lipogenesis in liver and adipose tissue of mice with high fat
diet-induced obesity and nonalcoholic fatty liver disease. Eur J
Gastroenterol Hepatol 2008, 20:843-854.
8. Zhu M, Ji G, Jin G, Yuan Z: Different responsiveness to a high-fat/
cholesterol diet in two inbred mice and underlying genetic factors: a
whole genome microarray analysis. Nutr Metab (Lond) 2009, 6:43.
9. Cani PD, Amar J, Iglesias MA, Poggi M, Knauf C, Bastelica D, Neyrinck AM,
Fava F, Tuohy KM, Chabo C, Waget A, Delmée E, Cousin B, Sulpice T,
Chamontin B, Ferrières J, Tanti JF, Gibson GR, Casteilla L, Delzenne NM,
Alessi MC, Burcelin R: Metabolic endotoxemia initiates obesity and insulin
resistance. Diabetes 2007, 56:1761-1772.
10. Zheng S, Hoos L, Cook J, Tetzloff G, Davis H Jr, van Heek M, Hwa JJ:
Ezetimibe improves high fat and cholesterol diet-induced non-alcoholic
fatty liver disease in mice. Eur J Pharmacol 2008, 584:118-124.
11. Matthews DR, Hosker JP, Rudenski AS, Naylor BA, Treacher DF, Turner RC:
Homeostasis model assessment: insulin resistance and beta-cell function
from fasting plasma glucose and insulin concentrations in man.
Diabetologia 1985, 28:412-419.
12. Charukian C, Schenk EA: Manual of the Special Stains Laboratory. 5 edition.
Rochester, NY: University of Rochester; 1991, 72-74.
13. Charukian C, Schenk EA: Manual of the Special Stains Laboratory. 5 edition.
Rochester, NY: University of Rochester; 1991, 175-176.
14. Mullin AE, Soukatcheva G, Verchere CB, Chantler JK: Application of in situ
ductal perfusion to facilitate isolation of high-quality RNA from mouse
pancreas. Biotechniques 2006, 40:617-621.
15. Kang K, Reilly SM, Karabacak V, Gangl MR, Fitzgerald K, Hatano B, Lee CH:
Adipocyte-derived Th2 cytokines and myeloid PPARdelta regulate
macrophage polarization and insulin sensitivity. Cell Metab
2008, 7:485-495.
16. Desvergne B: PPARdelta/beta: the lobbyist switching macrophage
allegiance in favor of metabolism. Cell Metab 2008, 7:467-469.
17. Fain JN: Release of inflammatory mediators by human adipose tissue is
enhanced in obesity and primarily by the nonfat cells: a review.
Mediators Inflamm 2010, 513948.
18. Juge-Aubry CE, Somm E, Chicheportiche R, Burger D, Pernin A, Cuénod-
Pittet B, Quinodoz P, Giusti V, Dayer JM, Meier CA: Regulatory effects of
interleukin (IL)-1, interferon-beta, and IL-4 on the production of IL-1
receptor antagonist by human adipose tissue. J Clin Endocrinol Metab
2004, 89:2652-2658.
19. Larsen CM, Faulenbach M, Vaag A, Vølund A, Ehses JA, Seifert B, Mandrup-
Poulsen T, Donath MY: Interleukin-1-receptor antagonist in type 2
diabetes mellitus. N Engl J Med 2007, 356:1517-1526.
20. XOMA. [ />21. Xing T, Li L, Cao H, Huang J: Altered immune function of monocytes in
different stages of patients with acute or chronic liver failure. Brit Soc
Immunol Clin Exp Immunol 2006, 147:184-188.
22. Copaci I, Micu L, Voiculescu M: The role of cytokines in non-alcoholic
steatohepatitis. A systematic review. J Gastrointestin Liver Dis 2006,
15:363-373.
23. Lee DE, Kehlenbrink S, Lee H, Hawkins M, Yudkin JS: Getting the message
across: mechanisms of physiological cross talk by adipose tissue. Am J
Physiol Endocrinol Metab 2009, 296:E1210-1229.
doi:10.1186/1476-9255-8-8
Cite this article as: Stanton et al.: Inflammatory Signals shift from
adipose to liver during high fat feeding and influence the development
of steatohepatitis in mice. Journal of Inflammation 2011 8:8.
Submit your next manuscript to BioMed Central
and take full advantage of:
• Convenient online submission
• Thorough peer review
• No space constraints or color figure charges
• Immediate publication on acceptance
• Inclusion in PubMed, CAS, Scopus and Google Scholar
• Research which is freely available for redistribution
Submit your manuscript at
www.biomedcentral.com/submit
Stanton et al. Journal of Inflammation 2011, 8:8
/>Page 14 of 14