Báo cáo y học: "Are there valid proxy measures of clinical behaviour? a systematic review" ppt
Bạn đang xem bản rút gọn của tài liệu. Xem và tải ngay bản đầy đủ của tài liệu tại đây (535.58 KB, 20 trang )
BioMed Central
Page 1 of 20
(page number not for citation purposes)
Implementation Science
Open Access
Systematic Review
Are there valid proxy measures of clinical behaviour? a systematic
review
Susan Hrisos*
1
, Martin P Eccles
1
, Jill J Francis
2
, Heather O Dickinson
1
,
Eileen FS Kaner
1
, Fiona Beyer
1
and Marie Johnston
3
Address:
1
Institute of Health and Society, Newcastle University, 21 Claremont Place, Newcastle upon Tyne, NE2 4AA, UK,
2
Health Services
Research Unit, University of Aberdeen, Health Sciences Building, Foresterhill, Aberdeen AB25 2ZD, UK and
3
Department of Psychology, University
of Aberdeen, Health Sciences Building, Foresterhill, Aberdeen AB25 2ZD, UK
Email: Susan Hrisos* - ; Martin P Eccles - ; Jill J Francis - ;
Heather O Dickinson - ; Eileen FS Kaner - ; Fiona Beyer - ;
Marie Johnston -
* Corresponding author
Abstract
Background: Accurate measures of health professionals' clinical practice are critically important to guide health policy
decisions, as well as for professional self-evaluation and for research-based investigation of clinical practice and process
of care. It is often not feasible or ethical to measure behaviour through direct observation, and rigorous behavioural
measures are difficult and costly to use. The aim of this review was to identify the current evidence relating to the
relationships between proxy measures and direct measures of clinical behaviour. In particular, the accuracy of medical
record review, clinician self-reported and patient-reported behaviour was assessed relative to directly observed
behaviour.
Methods: We searched: PsycINFO; MEDLINE; EMBASE; CINAHL; Cochrane Central Register of Controlled Trials;
science/social science citation index; Current contents (social & behavioural med/clinical med); ISI conference
proceedings; and Index to Theses. Inclusion criteria: empirical, quantitative studies; and examining clinical behaviours. An
independent, direct measure of behaviour (by standardised patient, other trained observer or by video/audio recording)
was considered the 'gold standard' for comparison. Proxy measures of behaviour included: retrospective self-report;
patient-report; or chart-review. All titles, abstracts, and full text articles retrieved by electronic searching were screened
for inclusion and abstracted independently by two reviewers. Disagreements were resolved by discussion with a third
reviewer where necessary.
Results: Fifteen reports originating from 11 studies met the inclusion criteria. The method of direct measurement was
by standardised patient in six reports, trained observer in three reports, and audio/video recording in six reports.
Multiple proxy measures of behaviour were compared in five of 15 reports. Only four of 15 reports used appropriate
statistical methods to compare measures. Some direct measures failed to meet our validity criteria. The accuracy of
patient report and chart review as proxy measures varied considerably across a wide range of clinical actions. The
evidence for clinician self-report was inconclusive.
Conclusion: Valid measures of clinical behaviour are of fundamental importance to accurately identify gaps in care
delivery, improve quality of care, and ultimately to improve patient care. However, the evidence base for three
commonly used proxy measures of clinicians' behaviour is very limited. Further research is needed to better establish
the methods of development, application, and analysis for a range of both direct and proxy measures of behaviour.
Published: 3 July 2009
Implementation Science 2009, 4:37 doi:10.1186/1748-5908-4-37
Received: 14 January 2009
Accepted: 3 July 2009
This article is available from: />© 2009 Hrisos et al; licensee BioMed Central Ltd.
This is an Open Access article distributed under the terms of the Creative Commons Attribution License ( />),
which permits unrestricted use, distribution, and reproduction in any medium, provided the original work is properly cited.
Implementation Science 2009, 4:37 />Page 2 of 20
(page number not for citation purposes)
Background
The measurement, reporting and improvement of the
quality of health care provision are central to many cur-
rent health care initiatives that aim to increase the delivery
of optimal, evidence-based care to patients (e.g., quality
and outcomes framework (QOF) [1], new GMS contract
[2]). In the UK, the new GMS contract [2] introduced in
2004 represents a growing trend towards pay-for-perform-
ance incentives in primary care, delivered through the
QOF. Accurate measures of health professionals' clinical
practice are therefore critically important not only to pol-
icy makers in guiding health policy decisions but also to
practitioners in the evaluation of their own practice and to
researchers both in identifying deficits and evaluating
changes in the process of care.
Clinical practice can be measured directly – by actual
observation of clinicians while practicing, or indirectly –
by the use of a proxy measure, such as a review of medical
records or interviewing the clinician. Direct measures
include observation by a trained observer, video- or
audio-recording of consultations, and the use of 'stand-
ardised' or 'simulated' patients. These are generally con-
sidered to provide an accurate reflection of the behaviour
under observation, and as such represent a 'gold standard'
measure of performance. However, direct measures are
intrusive, can promote (unrepresentative) socially-desira-
ble behaviour in the individuals being observed, and are
time-consuming and costly to use, placing significant lim-
itations on their use in any context other than small stud-
ies. Thus, they are not always a feasible option.
Measurement of clinical behaviour has therefore com-
monly relied on less costly and more readily available
indirect sources of performance data, including review of
medical records (chart review), clinician self-report, and
patient report. Having effective and less costly proxy
measures of behaviour could expand both the policy and
research agendas to include important clinical behaviours
that might otherwise go unexamined because of measure-
ment difficulties. However, despite their widespread use,
the extent to which these proxy measures of clinical
behaviour accurately reflect a clinician's actual behaviour
is unclear.
The aim of this review was to identify the current evidence
relating to the relationships between direct measures and
proxy measures of clinical behaviour. In order to establish
whether any indirect measures can be used as proxies for
actual clinical behaviour, the accuracy of medical record
review, clinician self-reported and patient-reported behav-
iour were assessed relative to a direct measure of behaviour.
Objective
The objective of the review was to assess whether there is
a relationship between measures of actual clinical behav-
iour and proxy measures of the same behaviour, and how
this relationship can best be described both on average
and for individual clinicians.
Methods
Inclusion and exclusion criteria
We included any study that examined clinical behaviour
(behaviour enacted by a clinician – doctor, nurses and
allied health professionals – with respect to a patient or
their care) within a clinical context. Studies were included
if they reported a quantitative evaluation of the relation-
ship between a direct measure representing actual behav-
iour and an indirect, proxy measure of the same
behaviour. We excluded studies of undergraduate stu-
dents. A direct measure of behaviour was defined as one
based on direct observation of a clinician's actual behav-
iour in a clinical context by either a trained observer or a
simulated patient, or of a video- or audio-recording of it.
A proxy measure of behaviour was defined as one based
on clinician self-report of recent or usual behaviour in a
specified clinical situation, or patient-report of clinicians'
behaviour or medical record review.
Search strategy for identification of studies
The following databases were searched: PsycINFO (1840
to Aug 2004), MEDLINE (1966 to Aug wk 3 2004),
EMBASE (1980 to Aug wk 34), CINAHL (1982 to Aug wk
3 2004), Cochrane central register of controlled trials
(2004 issue 2), science/social science citation index (1970
to Aug 2004), current contents (social and behavioural
med/clinical med) (1998 to Aug 2004), ISI conference
proceedings (1990 to Aug 2004), and Index to Theses
(1716 to Aug 2004). The search terms for behaviour,
health professionals, and scenarios are shown in Table 1.
The search strategy was devised to also identify studies for
a related review that examined the relationship between
intention and clinical behaviour, and hence contained the
additional search term 'intention' [3]. The search domains
were combined as follows: (Intention) AND (Behaviour)
AND (health professionals), (Intention-behaviour) AND
(health professionals), (behaviour) AND (outcomes)
AND (health professionals). The reference lists of all
included papers were checked manually.
Review methods
All titles and abstracts retrieved by electronic searching
were downloaded to a reference management database;
duplicates were removed, the remaining references were
screened independently by two reviewers, and those stud-
ies which did not meet the inclusion criteria were
excluded. Where it was not possible to exclude articles
based on title and abstract, full text versions were
obtained and their eligibility was assessed by two review-
ers. Full text versions of all potentially relevant articles
identified from the reference lists of included articles were
obtained. The eligibility of each full text article was
Implementation Science 2009, 4:37 />Page 3 of 20
(page number not for citation purposes)
assessed independently by two reviewers. Disagreements
were resolved by discussion or were adjudicated by a third
reviewer.
Quality assessment
External validity
External validity relates to the generalisability of study
findings. We assessed this for included studies on the
basis of:
1. whether the target population of clinicians was local,
regional, or national.
2. whether the target population of clinicians was sam-
pled or whether the entire population was approached –
and if the population was sampled, whether it was a valid
random (or systematic) sample – in order to assess the
potential for selection bias.
3. the number of clinicians recruited and the total number
of consultations assessed.
4. the percentage of participants enrolled for whom the
relationship between direct and proxy measures of behav-
iour was analysed (attrition bias).
Internal validity
Internal validity relates to the rigor with which a study was
conducted, and how confident we can be about any infer-
ences that are subsequently made [4]. Important aspects
of internal validity that are particularly relevant to the
included studies are the reliability and validity of the
measurement methods used to assess the performance of
clinical behaviours. We therefore assessed internal validity
on the basis of the psychometric evaluations performed
by each study:
Reliability
1. Measurement of inter-rater and intra-rater reliability for
checklist scoring by trained observers and simulated
patients.
2. Test re-test reliability of either direct or indirect meas-
ures.
Table 1: Keyword combinations for three domains, combined for the database search
Behaviour Health professionals Intention
Thesaurus headings:
• BEHAVIOR
• CHOICE BEHAVIOR
• PLANNED BEHAVIOR
• Behaviour?*
• Clinician performance*
• (Actor or abstainer) near behaviur*
(Intention or intend*) near behaviour?*
Thesaurus headings:
• HEALTH PERSONNEL
• ATTITUDE OF HEALTH PERSONNEL
• CLINICIANS
Clinician*
Counsellor*
Dentist*
Doctor*
Family practition*
General practition*
GP*/FP*
Gynaecologist*
Haematologist*
Health professional*
Internist*
Neurologist*
Nurse*
Obstetrician*
Occupational therapist*
Optometrist*
OT*
Paediatrician*
Paramedic*
Pharmacist*
Physician*
Physiotherapist*
Primary care
Psychiatrist*
Psychologist*
Radiologist*
Social worker*
Surgeon*/surgery
Therapist*
Thesaurus heading:
INTENTION
• Intend* or intention*
• Inclin* or disinclin*
Example thesaurus headings are given for the PsycINFO database and were adjusted and exploded as appropriate for other databases.
Implementation Science 2009, 4:37 />Page 4 of 20
(page number not for citation purposes)
Validity of the scoring checklist
Content and face validity of the scoring checklist: e.g., the
rationale and process for the choice of items included and
for any weights assigned to them;
Validity of the direct measure method
General: The ability of the direct measure to accurately
detect the aspects of behaviour under scrutiny (e.g., the
range of clinical actions on the scoring checklist).
Simulated patients
1. Content validity of simulated cases: the level of corre-
spondence between components of simulated cases and
actual clinical presentations of the condition in question.
2. Face validity: judgments made by individuals other
than the research team that the simulated case 'looks like'
a valid case representation of the clinical condition in
question.
3. Training of simulated patients in the case protocol.
4. Assessment of cueing and reporting of detection of sim-
ulation.
Validity of the Proxy methods
Patient vignettes
Content validity: Correspondence between the operation-
alisation of the simulated case in the standardized patient
protocols and written vignettes.
Patient report and Clinician self-report
Content validity: Correspondence between the content
and wording of items on the scoring checklist and the
items on the questionnaire or interview schedule.
Appropriateness of the statistical methods used
The studies included in the current review used a range of
statistical methods to summarise and compare direct and
proxy measures of behaviour. To help us synthesise the
data from included studies we conducted a companion
review to assess the appropriateness of the different statis-
tical methods they used (Dickinson HO et al. Are there
valid proxy measures of clinical behaviour? Statistical con-
siderations, submitted). Our conclusions are summarized
below.
The included studies were based on recording whether a
clinician performed one or more clinical actions that we
refer to as 'items'. Some studies compared direct and
proxy measures 'item-by-item'; other studies combined
items into summary scores and then compared direct and
proxy summary scores.
Statistical methods used by studies that compared direct
and proxy measures item-by-item included: sensitivity
and specificity; total agreement; total disagreement; and
kappa coefficients. For these studies, we concluded that
sensitivity and specificity were generally the best statistics
to assess the performance of a proxy measure, provided
these statistics were not based on a combination of items
describing different clinical actions.
Statistical methods used by studies that compared sum-
mary scores included: comparisons of means; analysis of
variance (ANOVA); t-tests; and Pearson correlation. For
these studies, we concluded that summary measures
should capture a single underlying aspect of behaviour
and measure that construct using a valid measurement
scale. The average relationship between the direct and
proxy measures should be evaluated over the entire range
of the direct measure, and the variability about this aver-
age relationship should also be reported. Hence, compar-
isons of mean scores are inappropriate. ANOVA and t-
tests are likewise inappropriate because they are essen-
tially methods of testing whether the mean score is the
same in both groups. Correlation is inappropriate because
it cannot assess whether there is systematic bias in the
proxy measure (i.e., whether the proxy measure consist-
ently under- or overestimates performance by a certain
amount). Furthermore, the strength of the estimated cor-
relation depends on the range of scores of the proxy and
direct measures.
Data extraction
For each study, we extracted the: age and professional role
of participants; behaviour assessed; quantitative data
measuring the relationship between the direct and proxy
measures of behaviour; method of measuring behaviour
and psychometric properties of measure; and quality cri-
teria specified above.
Evidence synthesis
For studies that reported single binary (yes/no) items, we
extracted, if possible, the number of consultations for
which: both the direct and proxy measures recorded the
item as performed (true positives); both the direct and the
proxy measures recorded the item as not performed (true
negatives); the direct measure recorded the item as per-
formed but the proxy measure did not (false negatives);
and the direct measure recorded the item as not per-
formed but the proxy measure recorded it as performed
(false positives).
We estimated the mean and 95% confidence intervals
(CI) for the sensitivity, specificity, and positive predictive
value of the item and present these on forest plots. If stud-
ies did not report the above numbers but reported the sen-
sitivity and/or specificity, these statistics were extracted.
For all studies for which their mean values were available,
the sensitivity was plotted against the false positive rate
(1-specificity) because studies which fall in the top left of
Implementation Science 2009, 4:37 />Page 5 of 20
(page number not for citation purposes)
this plot are generally regarded as having better diagnostic
accuracy (high sensitivity and high specificity); however, a
summary ROC curve was not fitted to plots due to the het-
erogeneity between studies in behaviour measured and
methods of measurement. Where possible, we also calcu-
lated the positive and negative predictive values for indi-
vidual items.
For studies that reported aggregated scores summarising
several items, we extracted any statistics presented that
summarised the mean and variance of the direct measure
and/or proxy summary scores and the relationship
between the direct measure and proxy.
Results
Description of included studies
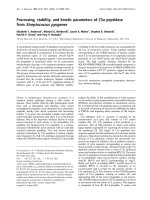
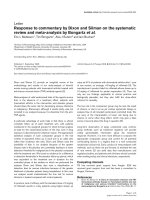
The search strategy identified 5,260 references (Figure 1).
The titles and abstracts of these references were screened
independently by two reviewers. Ten papers were
retrieved for full text review and their reference lists
screened for other potential papers. A further 102 papers
were identified from the reference lists of retrieved papers,
their abstracts were again reviewed independently by two
reviewers, and 41 of these were retrieved for full text
review. Fifteen papers, based on comparisons from eleven
separate source studies, fulfilled the inclusion criteria and
their data were abstracted [5-19]. As papers reporting dif-
ferent findings from the same study [5,6,10,12,14,18]
present different data and, with the exception of two
[10,18], used different methods of analysis, we have con-
sidered them as 15 separate reports for the purpose of this
review.
For the 15 reports, 771 clinicians were enrolled and proxy
measures of the clinical behaviour of 717 (93%) clini-
cians were evaluated relative to a direct measure. A sum-
mary of the characteristics of the 15 included reports is
presented in Table 2, with further detail presented in
Additional File 1. Ten reports originated in the United
States, two in the Netherlands and one each in the United
Kingdom, Australia, and Canada. The aim of 12 of 15
reports was to validate or to assess the 'accuracy' of an
indirect measure of clinician behaviour relative to a spe-
cific direct measure. The aim of the remaining three
reports was to assess the relative validity of different meas-
ures (both indirect and direct) to each other.
Participants in 12 reports were primary care physicians [5-
8,10,12-18]; in other reports participants were nurses
[19], community pharmacists [11], and paediatricians [9].
Clinical behaviours
Five reports considered a range of clinical behaviours (e.g.,
history taking, physical examination, ordering of labora-
Identification of included references (QUORUM diagram)Figure 1
Identification of included references (QUORUM diagram).
Potentially relevant references
identified by search and screened
n = 5,260
References excluded at
electronic screening stage
n = 5,250
References retrieved for full paper
review
n = 80
References excluded at abstract
screening stage
n = 32
References retrieved for more
detailed evaluation
n = 112
(10 identified by original search,
102 identified from reference lists
of retrieved
p
a
p
ers
)
References excluded following
full paper review
n = 65
Number of references identified by
search meeting inclusion criteria
n = 15
Implementation Science 2009, 4:37 />Page 6 of 20
(page number not for citation purposes)
tory tests, referral, diagnosis, treatment, patient education,
and follow-up) in relation to the management of a variety
of common out-patient conditions: urinary tract infection
(UTI) [16]; tension headache, acute diarrhoea, and pain
in the shoulder [17]; coronary artery disease (CAD), low
back pain, and chronic obstructive pulmonary disease
(COPD) [10,14,18]; diabetes [10,17,18]. One report con-
sidered the behaviour of recommending non-prescription
medication or physician visit for common cold and pain
symptoms [11], and one report evaluated medication reg-
imens prescribed for patients with COPD [12]. Six reports
considered health promotion behaviours, e.g., giving
advice about: smoking cessation [5-8,13,15]; alcohol use,
exercise, and diet [5-7]; preventive care in relation to CAD,
low back pain, and COPD [15]; and sun exposure, sub-
stance use, seatbelt use, and sexual health [6]. One report
considered the provision of a wide range of outpatient
services including counselling, screening, and physical
examination [5]; and one evaluated physician communi-
cation in paediatric consultations [9]. One report consid-
ered hand hygiene [19].
With the exception of two studies [8,13], the clinical
behaviours measured were 'necessary' or 'recommended'
clinical actions categorized as such according to either
national guidelines or expert consensus. Four studies also
included actions that were unnecessary or that should not
be performed (e.g., prescribing an antibiotic for a viral
infection) [10,11,16,18].
Methods used for measuring clinical behaviour
In all studies a checklist was used to record the perform-
ance of clinical actions relevant to the clinical area stud-
ied. All clinical actions were discrete activities, that is,
could be coded as 'yes' or 'no' (e.g., the recording of blood
pressure, asking about smoking habits). The number of
possible clinical actions observed in each study ranged
from one [19] to 168 [18].
A summary of the proxy and direct measures used by the
15 included reports is presented in Table 3, with further
detail presented in Additional File 2. The direct measure
of clinical behaviour was based on either: post-encounter
reports from simulated patients, [10,11,15-18]; prospec-
tive reports made by trained observers during direct obser-
vation of actual consultations[5,6,19]; or post-encounter
reports from trained observers rating audio- or video-
recordings of consultations [7-9,12-14].
The proxy measure of clinical behaviour was based on
either: clinician self-report of recent behaviour on self-
completion questionnaire or by exit interview [5,12-
14,19]; clinician self-report of simulated behaviour in a
specified clinical situation using clinical vignettes
[11,15,16,18]; medical record review
[5,7,9,10,12,14,15,17]; patient report on self-completion
questionnaire or by exit interview [5-8,12-14]; or eight
reports evaluated multiple proxy measures [5,7,9,12-
15,19].
Methodological quality of included studies
External validity
The target populations in nine reports were regional
[5,6,8,11,12,14,16,17,19]; all other reports targeted local
populations, such as physicians in two general internal
primary care outpatients clinics [10,15,18], attending
physicians at a university medical centre [9,13], and gen-
eral practitioners in ten general practices [7]. Six reports
approached all participants in their target population
[6,7,9,11,16,17], three randomly sampled a group of cli-
nicians [10,15,18], and six used convenience sampling
[5,8,12-14,19]. The number of clinicians enrolled and
analysed in each report ranged from three [9] to 138 [5,6]
(median 34). Ten reports retained and analysed 100% of
recruited clinicians [7-15,18]. The median number of con-
sultations observed was 160, with a range from 27 [16] to
4,454 [5,6]. For further details see Additional File 2.
Internal validity
Validity of the checklists used
In six reports, the content of the checklist was based on
national guidelines for the behaviour in question
[5,6,10,15,18,19], and for a further six reports content
was derived by expert consensus [11-14,16,17]. Two
reports asked simply whether or not a physician asked
about a particular lifestyle behaviour (e.g., smoking), and
whether or not they offered counselling [7,8]. One report
did not report the rationale for their choice of clinical
actions [9]. Inter-rater reliability for assignment of weights
to individual checklist items was presented in one report
[11] and was 0.73.
An important criterion for validity is that a measure
should be reliable. Inter-rater reliability of scores gener-
ated from checklists using direct measures were reported
for eight of the 15 included reports
[5,7,8,11,14,16,17,19], and ranged from 0.39 [5] to 1.00
[5,16] (Table 2). Five additional reports evaluated the reli-
ability of scoring between raters – stating these to be
'good' – but did not present inter-rater reliability statistics
[6,10,13,15,18]. Two reports presented intra-rater reliabil-
ities which were 0.78 to 0.96 [16] and 0.74 to 1.0 [8]. Two
reports did not discuss the reliability of the scoring proce-
dure [9,12]. One report evaluated the reliability of the
proxy measures used [16].
Validity of the direct methods used
Only one report presented assessment of the ability of the
direct measure to detect the behaviours of interest [14].
They found that videorecording captured a median of
Implementation Science 2009, 4:37 />Page 7 of 20
(page number not for citation purposes)
Table 2: Summary of included study characteristics and clinical behaviours measured
Study Characteristics Behaviour measured
1. Type of participants
2. Target population
3. Sampling strategy
Participants approached & analysed Consultations/sessions/indications
observed/vignettes completed & analysed
1. Clinical area/s
2. Behaviour/s
observed
(No. of clinical actions
scored)
No. of
checklist
items
Summarised
(weighted)
Nn% N n %
Stange [5]
1998
1. Family practice physicians
2. Members of the Ohio
Academy of FPs, practice
within 50 miles radius of
Cleveland & Youngstown
3. Convenience sample
138 128 93 4454 4432
(MR)
3283
(PR)
99
(MR)
74
(PR)
1. Delivery of a range of
outpatient medical
services
2. Counselling (29),
physical examination (16),
screening (5), Lab tests
(10), immunisation (7),
Referral (4)
79
Flocke [6]
2004
1. Family physicians
2. Primary care physicians in
North West Ohio
3. All physicians approached
138 128 93 4454 2,670 60 1. Health promotion
2. Smoking (2), alcohol,
exercise, diet, substance
use, sun exposure,
seatbelt use, HIV & STD
prevention
10
Wilson [7]
1994
1. General practitioners
(GPs)
2. 10 general practices in
Nottinghamshire
3. Selection of GPs not
reported. Minimum of two
non-random consultations
were recorded
16 16 100 3324 516 (MR)
335 (PR)
16 (MR)
10 (PR)
1. Health promotion
2. Asked patient about 4
health behaviours:
smoking (1), alcohol (1),
diet & exercise (1);
measurement of blood
pressure (1)
4
Ward [8]
1996
1. Post-graduate trainees
2. Training general practices
in New South Wales
3. Trainees who were
having their first experience
in supervised general
practice
34 34 100 1500 1075 72 1. Smoking cessation
2. Establish smoking status
& provide smoking
cessation counselling (2)
2
Zuckerman [9]
1975
1. Paediatricians
2. Physicians working in a
university medical centre
serving an inner-city
population
3. All 3 staff physicians
3 3 100 51 51 100 1. Paediatric consultation
2. Diagnosis and
management (8), historical
items (7)
15
Implementation Science 2009, 4:37 />Page 8 of 20
(page number not for citation purposes)
Luck [10]
2000
1. Primary care physicians
2. 2 general internal
medicine primary care
outpatient clinics
3. Random sample of 10
physicians at each site
20 20 100 160 160 100 1. Management of LBP,
DM, COPD, CAD.
2. History, Physical exam,
Tests ordered, Diagnosis
& Treatment/management
(21 for LBP)
NR Ö (w)
Page [11]
1980
1. Community pharmacists
2. Participants on a
continuing education
course in British Columbia,
Canada
3. All participants
30 30 100 58 58 100 1. Management of: Cold,
Pain
2. Recommend either:
non-prescription
medication (cold = 17,
pain = 15) or see physician
(cold = 17, pain = 18)
103 Ö (w)
Gerbert [12]
1988
1. Primary care physicians
2. Primary care physicians
serving 6 counties in
California
3. Convenience sample
63 63 100 197 197 100 1. Medication regimens in
the management of COPD
2. Prescription of
theophyllines (1),
sympathomimetics (2),
oral corticosteroids (1)
4
Pbert [13]
1999
1. Primary care physicians 2.
Attending physicians & their
patients at University
medical centre in
Massachusetts.
3. Convenience sample
12 12 100 154 108 70 1. Smoking cessation
2. Cessation counselling
(15)
15 Ö
Gerbert [14]
1986
1. Primary care physicians
2. NR
3. Convenience sample
63 63 100 214 192 90 1. Management of COPD
2. Symptoms (8), signs (2),
Tests (3), Treatments (3),
Patient education (4)
75 Ö
Dresselhaus
[15]
2000
1. Primary care physicians
2. 2 general internal
medicine primary care
outpatient clinics
3. Random sample of 10
physicians at each site
20 20 100 160 160 100 1. Management of low
back pain, diabetes
mellitus, COPD, CAD.
2. Preventive care:
tobacco screening (1),
smoking cessation advice
(1), prevention measures
(1), alcohol screening (1),
diet evaluation (1),
exercise assessment (1) &
exercise advice (1)
7 Ö
Rethans [16]
1987
1. GPs
2. GPs working in
Maastricht
3. All participants
55 25 46 27 25 93 1. Management of Urinary
Tract Infection
2. History taking (8);
Physical Examination (3);
Instructions to patients
(7); Treatment (2);
Follow-up (4)
24 Ö
Table 2: Summary of included study characteristics and clinical behaviours measured (Continued)
Implementation Science 2009, 4:37 />Page 9 of 20
(page number not for citation purposes)
Rethans [17]
1994
1. GPs
2. Sampling strategy
reported elsewhere.
3. Sampling strategy
reported elsewhere
39 35 90 140 101 72 1. Management of tension
headache; acute diarrhoea;
pain in the shoulder;
check-up for non-insulin
dependent diabetes.
2. History, Physical exam,
Lab exam, Advice,
Medication & follow-up
(range over 4 conditions:
25–36)
25–36 Ö
Peabody [18]
2000
1. Primary care physicians
2. 2 general internal
medicine primary care
outpatient clinics
3. Random sample of 10
physicians at each site
20 20 100 160 160 100 1. Management of low
back pain (LBP), diabetes
mellitus (DM), Chronic
obstructive pulmonary
disease (COPD) oronary
artery disease (CAD).
2. History taking (7),
Physical examination (3),
lab tests (5), Diagnosis(2),
Management (6)
(Averaged 21 actions per
case)
168 Ö (w)
O'Boyle [19]
2001
1. Nurses
2. ICU staff in 4
metropolitan teaching
hospitals in "Mid-West"
USA
3. ICUs with comparable
patient populations
124 120 97 120 120 100 1. Adherence to hand
hygiene recommendations
2. Hand washing (for a
maximum of 10
indications)
1 Ö
Table 2: Summary of included study characteristics and clinical behaviours measured (Continued)
Implementation Science 2009, 4:37 />Page 10 of 20
(page number not for citation purposes)
Table 3: Summary of the measures used by included studies, methods of analysis and results of comparisons
Study Proxy measure Direct Measure (DM) Analysis
Description
1. Method
V = Clinical vignette
(No. of case
simulations)
CI/Q = Clinician
interview/
questionnaire
MR = Medical Record
review
PI/Q = Patient
interview/
questionnaire
2. Timing
Clinician
self report
(SR)
Medical
Record
Review
(MR)
Patient
report
(PR)
Description
1. Method
SP = Simulated
Patients
DO = Direct
Observation
VR = Video
recording
AR = Audio
recording
2. Timing
SP
Training
reported
Psychome
trics (IRR)
Compared
Item by
Item
Compared
Summary
Scores
Agreement between
measures:
Co-efficient r; kappa (k);
Structural equation
modelling (SEM); Sensitivity
(Sens) & Specificity (Spec)
Difference between
mean scores:
ANOVA; T-test
P
Stange [5]
1998
1. MR; PQ
2. At end of
consultation
ÖÖ DO 0.39 to 1.00
(kappa)
Ö MR
Sens = 8% (diet advice) –
92%
(Lab tests)
Spec = 83% (social history)
– 100% (counselling
services, physical exam, lab
tests)
k = 0.12 to 0.92 (79
comparisons)
PR
Sens = 17% (mammogram)
– 89% (Pap test)
Spec = 85% (in-office
referral) – 99%
(immunisation, physical
exam, lab tests)
k = 0.03 to 0.86 (53
comparisons)
NR
Flocke [6]
2004
1. PQ
2. At end of
consultation (24%) or
postal return (76%)
Ö DO NR Ö Sens* = 11% (substance
use) – 76%
(smoking cessation)
NA
Implementation Science 2009, 4:37 />Page 11 of 20
(page number not for citation purposes)
Wilson [7]
1994
1. MR; PQ
2. At end of
consultation
ÖÖ AR 0.79 to 1.00 Ö MR
Sens = 31%, Spec* = 99%
28.6 (Alcohol)
Sens = 29%, Spec* = 100%
83.3 (BP)
Sens = 83%, Spec* = 93%
% agreement between DM
& MR:
45.5 (Smoking)
PR
Sens = 74%, Spec* = 94%
75.0 (Alcohol)
Sens = 75%, Spec* = 94%
100 (BP)
Sens = 100%, Spec* = 90%
% agreement between DM
& PR:
81.8 (Smoking)
NA
Ward [8]
1996
1. PQ
2. Questionnaire
mailed to patient
within 2 days of
consultation
Ö AR 0.74 to 0.94
(kappa)
Ö Sens = 93%
(smoking status)
Spec = 79%
Sens = 92%
(cessation advice)
Spec = 82%
NA
Zuckerman
[9]
1975
1. MR
2. At end of
consultation
Ö AR NR Ö Sens* = 0% (side effects) –
100% (Diagnosis)
Spec* = 9% (Diagnosis) –
100%
(side effects)
NA
Luck [10]
2000
1. MR
2. At end of
consultation
Ö SP (27) each role-
playing 1 of 8
case simulations
Ö NR ÖÖANOVA
(4-way)
Necessary care:
Sens = 70%, Spec = 81%
Unnecessary care:
Sens = 65%' Spec = 64%.
<0.0001
NA
Page [11]
1980
1. V (4)
2. Upto 6 weeks
before or 3 weeks
after SP visit
Ö SP (4) each role-
playing 1 case
simulation
Ö 0.76 ÖÖr = .56 & .68
r = .26 & .37
"Must do" actions
Sens* = 97%, Spec* = 33%
"Must not do" actions
Sens* = 30%, Spec* = 98%
>0.05
<0.05
Gerbert
[12]
1988
1. CI; MR; PI
2. At end of
consultation
ÖÖÖ ÖRNRÖ k = 0.67 (SR)
k = 0.54 (MR)
k = 0.50 (PR)
<0.001
<0.001
<0.001
Pbert [13]
1999
1. CI; PI
2. At end of
consultation
ÖÖAR. NR ÖÖr = 0.77 (SR)
r = 0.67 (PR)
<0.0001
<0.0001
Table 3: Summary of the measures used by included studies, methods of analysis and results of comparisons (Continued)
Implementation Science 2009, 4:37 />Page 12 of 20
(page number not for citation purposes)
Gerbert
[14]
1986
1. CI; MR; PI
2. At end of
consultation
ÖÖÖ ÖR 0.52 to 0.93
(kappa)
Ö Median % agreement (All
categories):
0.84 (SR)
0.88 (MR)
0.86 (PR)
NA
Dresselhaus
[15]
2000
1.V (8); MR
2. NR
ÖÖ SP (4) each role-
playing a simple
and complex case
presentation
Ö NA Ö ANOVA
(3-way)
<0.01
Rethans
[16]
1987
1. V (1).
2. Completed 2
months after SP visit
Ö SP (3) each role-
playing same case
simulation
Ö 0.78 to 1.0
(kappa)
ÖÖT-test:
Overall
"Obligatory"
"Intermediate"
"Superfluous"
ns
<0.005
<0.05
<0.05
Rethans
[17]
1994
1. MR
2. Charts reviewed
two years after SP
visit.
Ö SP (4) each role-
playing 1 of 4
case simulations
Ö 0.93 (kappa) ÖÖr = 0.54 (Overall)
r = 0.17
(History taking)
r = 0.45
(Physical exam)
r = 0.75
(Lab exam)
r = 0.50 (Advice)
r = 0.43 (Medication)
r = -0.04 (Follow-up)
<0.05)
ns
ns
<0.01
<0.05
ns
ns
Peabody
[18]
2000
1. V (8); MR
2. Completed "several
weeks" after SP visit
ÖÖ SP (4) each role-
playing a simple
and complex case
presentation
Ö NA Ö ANOVA
(4-way)
<0.001
O'Boyle
[19]
2001
1. % time practiced
hand hygiene
2. Up to one month
prior to observation
period
Ö DO
Nurses observed
for 2 hours or
until 10
indications for
handwashing had
occurred
0.94 to 0.98 Ö r = 0.21
SEM = 0.201
<0.05
<0.05
* Calculated by authors NA = Not applicable NR = Not reported ns = non-significant
Table 3: Summary of the measures used by included studies, methods of analysis and results of comparisons (Continued)
Implementation Science 2009, 4:37 />Page 13 of 20
(page number not for citation purposes)
48% of the content of the overall consultation observed,
but that the level of capture varied from 10% to 100%
depending on the clinical action.
Of the six reports that used standardised patients as the
direct measure, four assessed the content and face validity
of the patient scripts using expert review [10,15,18]. All
reported that training was provided to standardised
patients, but two reports did not provide detail about the
duration or nature of the training [16,17]. In three studies,
standardised patients were experienced actors, who were
trained according to a published protocol which was
delivered by experienced university-based educators
[10,15,18]. One report used graduate students who were
trained for four hours as standardised patients [11]. The
experience of the trainer was not reported, but standard-
ised patients pilot tested one of their simulated roles with
a community pharmacist, and their checklist ratings were
compared across four videotaped standardised patient
encounters with pharmacists. Three reports reported
detection rates of the standardised patient (i.e., the clini-
cian realised that standardised patients were not genuine
patients), and these were low (3%) [10,15,18].
Validity of the proxy methods used
With the exception of one report [19], the proxy method
was directly related to the study visit; for example, reports
using medical record review as the proxy method
abstracted medical records pertaining only to the study
visit, or patients were asked about a specific consultation.
The proxy measure used by O'Boyle et al. [19] was col-
lected two weeks to four months before the direct meas-
urement.
In four reports that compared performance on the direct
measure with a written vignette [11,15,16,18], all but one
[11] reported these to be identical case matches. In the lat-
ter report, two standardised patient case protocols differed
from the corresponding written vignette in the nature of
the clinical complication presented by the standardised
patient [11]. The correspondence of standardised patient
and vignette case protocols for two reports was not
reported [10,17].
Appropriateness of statistical methods used to summarise
and report the relationship between direct and proxy
measures
Studies comparing items
Thirteen reports compared measures of behaviour item-
by-item [5-17]. Four of these studies estimated the sensi-
tivity of the proxy measure for each clinical action meas-
ured [5-8], two the specificity [5,8] and one [7] the false
positive rate from which we calculated specificity. It was
possible to calculate the sensitivity and specificity for indi-
vidual clinical actions from the raw data presented in a
further report [9]. Three studies grouped clinical actions
into categories: 'necessary' and 'unnecessary' actions [10];
'must do', 'should do', 'must not do' and 'should not do'
actions [11]; and 'essential' and 'intermediate' actions
[17]. Luck et al. [10] then estimated the sensitivity and
specificity within each category, and it was possible to esti-
mate the sensitivity and specificity for each category spec-
ified by Page et al. [11] from the raw data presented.
Rethans et al. [17] also calculated the sensitivity of each
item (referred to by the authors as 'content scores') but
reported only the mean and inter-quartile range of sensi-
tivities within each clinical area. Hence, sensitivities were
available for seven studies and specificities for six studies.
Six reports comparing item-by-item used other statistical
methods to compare their data [12-17]. These studies
assessed 'agreement' and/or 'disagreement' between meas-
ures; five reported agreement as the percentage of recom-
mended behaviours performed as recorded on the direct
and proxy measures [7,12,13,15,16], one also reported
disagreement as the proportion of behaviours not
recorded by the proxy measure that were detected by the
direct measure [12]; and one study estimated the 'total
agreement' and 'total disagreement' between measures,
reporting median 'convergent validity' for 20 individual
items and five clinical categories [14].
Studies comparing summary scores
Seven reports aggregated items into summary scores of cli-
nicians' behaviour [10,11,13,16-19]. Three studies used
ANOVA to compare summary scores [10,13,18]; one
study used paired t-tests [16]; and four studies reported
Pearson correlation coefficients [11,13,17,19].
Relationship between direct and proxy measures
behaviour
Studies comparing items
Patient report
Three reports comparing item-by-item and reporting sen-
sitivity and specificity [5,7,8], and one reporting sensitiv-
ity only [6], examined patient report as a proxy measure
of clinician performance. Measurement techniques used
were either patient questionnaire or patient interview,
which were compared with direct observation [5,6] and
audio-recording [7,8] (Table 2).
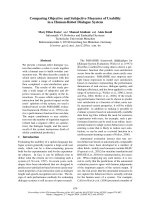
Median sensitivities for clinical actions relating to the pro-
vision of general outpatient services [5] and for health
advice on a range of patient behaviours [6] were 53%
(range 25 to 89) and 43% (range 11 to 76), respectively.
Sensitivities for: the provision of smoking cessation advice
were 74% [7], 93% [8], and 76% [6]; for asking about
alcohol use they were 75% [7] and 29% [6], and 100% for
measuring blood pressure [7] (Figure 2). Median specifi-
city for patient report was 98% (range 83% to 99%)
[5,7,8] across a number of services, 79% [8] and 94% [7]
Implementation Science 2009, 4:37 />Page 14 of 20
(page number not for citation purposes)
for smoking cessation counselling, and 90% for the meas-
urement of blood pressure [7] (Figure 2).
Positive and negative predictive values could be calculated
from the raw data of two reports evaluating the provision
of smoking and alcohol advice and the measurement of
blood pressure [7,8]. The positive predictive values for
patient-report were: 0.49 [7], 0.42, and 0.55 [8] for smok-
ing advice; 0.40 for alcohol advice [8]; and 0.70 for the
measurement of blood pressure [7,8] (Figure 3). The neg-
ative predictive values for patient-report of the same
behaviours were high for both studies (>0.90) [7,8]. This
would suggest that patients accurately reported not receiv-
ing advice and not having their blood pressure measured,
but they are less accurate in reporting that clinicians did
perform these behaviours.
Three further reports compared item-by-item but did not
report sensitivity or specificity for their data [12-14]. Ger-
bert et al. [14] report a median 'total agreement' of 86%
between measures for the performance of clinical actions
relating to the management of COPD. Gerbert et al. [12]
present a kappa coefficient of 0.50 for the level of con-
cordance between patient report and their direct measure
of video-recording and a 'disagreement' between the
measures of 24%. Pbert et al. [13] made comparisons
across measures for the detection of individual items
using Cochrane's Q tests. These comparisons suggested
that patients tended to over-report their clinician's behav-
iour compared to the direct measure of audio-recording.
The accuracy of patient-report
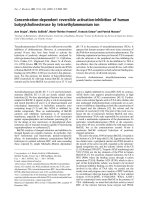
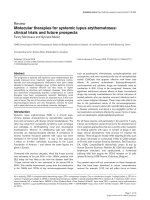
ROC curves were plotted for the three studies where both
sensitivity and specificity were available [5,7,8](Figure
Figure 4). The accuracy of patient report varied according
to the clinical action of interest. Performance of the
behaviours located in the top-left quadrant of this plot
were reported most accurately by patients. These included
the provision of counselling for health behaviours such as
smoking, alcohol use, seat belt use, and breast self-exami-
Sensitivities and specificities for six studiesFigure 2
Sensitivities and specificities for six studies.
Page
Luck
Zuckermann
Wilson
Ward
Flocke
Cold relief: recommend medication - must do
- should do
- should not do
- must not do
Cold relief: physician required - must do
- should do
- should not do
- must not do
Pain relief: recommend medication - must do
- should do
-could do
- should not do
- must not do
Pain relief: physician required - must do
- should do
- should not do
- must not do
Necessary care
Unnecessary care
Diagnosis
Drug name
Drug dosage
Drug action
Side effects
Other therapy
Appointments
Diagnostic studies
Smoking (proxy=notes)
Alcohol use (proxy=notes)
Blood pressure (proxy=notes)
Smoking (proxy=patient questionnaire)
Alcohol use (proxy=patient questionnaire)
Blood pressure (proxy=patient questionnaire)
Ask about smoking
Advise to stop smoking
Smoking cessation
Exercise
Diet
Smoking
Alcohol use
Substance use
Sun exposure
Seatbelt use
HIV prevention
STD prevention
00.5 1
Sensitivity
Specificity
00.5 1
Page
Luck
Zuckermann
Wilson
Ward
Flocke
Page
Luck
Zuckermann
Wilson
Ward
Flocke
Cold relief: recommend medication - must do
- should do
- should not do
- must not do
Cold relief: physician required - must do
- should do
- should not do
- must not do
Pain relief: recommend medication - must do
- should do
-could do
- should not do
- must not do
Pain relief: physician required - must do
- should do
- should not do
- must not do
Necessary care
Unnecessary care
Diagnosis
Drug name
Drug dosage
Drug action
Side effects
Other therapy
Appointments
Diagnostic studies
Smoking (proxy=notes)
Alcohol use (proxy=notes)
Blood pressure (proxy=notes)
Smoking (proxy=patient questionnaire)
Alcohol use (proxy=patient questionnaire)
Blood pressure (proxy=patient questionnaire)
Ask about smoking
Advise to stop smoking
Smoking cessation
Exercise
Diet
Smoking
Alcohol use
Substance use
Sun exposure
Seatbelt use
HIV prevention
STD prevention
00.5 100.5 1
Sensitivity
Specificity
00.5 100.5 1
Implementation Science 2009, 4:37 />Page 15 of 20
(page number not for citation purposes)
nation, which were more accurately reported by patients
than the provision of counselling for accident prevention,
dental health, contraception, and exercise (behaviours
located in the bottom-left quadrant). The accuracy of
patient report for clinical actions relating to physical
examination, laboratory tests, and screening services also
varied with the type of examination, test, or service under-
taken [5].
Medical record review
Four reports comparing item-by-item and reporting sensi-
tivity and specificity compared medical record review with
direct observation in one report [5], with audio-recording
in two reports [7,9], and standardised patient accounts in
one report [10], (Table 2).
Median sensitivity for a range of clinical actions relating to
the provision of general outpatient services was 60%
(range 8% to 92) [5] and 83% (range 0 to 100%) [9] for
clinical actions undertaken during routine patient consul-
tations (Figure 2). For smoking cessation advice, alcohol
counselling and the measurement of blood pressure sen-
sitivities were 31%, 29%, and 83%, respectively [7], and
for 'necessary' and 'unnecessary' actions sensitivities were
70% and 65%, respectively [10] (Figure 2). Median specif-
icity for medical record review across a number of services
was 90% (range 81% to 100%) [5], and 97% (range 9%
to 100%) [9]. Specificities for smoking counselling, alco-
hol counselling, and the measurement of blood pressure
were 99%, 100%, and 93%, respectively [7], and 64% and
81% for 'necessary' and 'unnecessary' actions, respectively
[10] (Figure 2).
As the raw data were available for three reports evaluating
medical record review [7,9,10], it was possible to calculate
a range of positive and negative predictive values for this
proxy method (Figure 3). The positive predictive ability of
medical record review ranged from 0.30 to 0.92 (Median
= 0.86) across different clinical actions, and was highest
for 'necessary' care items (PPV = 0.85) [10], recording of
drug dosage (PPV = 0.88), diagnostic behaviours (PPV =
0.91) [9], and the measurement of blood pressure (PPV =
Positive and Negative Predictive Values for six studiesFigure 3
Positive and Negative Predictive Values for six studies.
Positive Predictive Value
Page
Luck
Zuckermann
Wilson
Ward
Flocke
Cold relief: recommend medication - must do
- should do
- should not do
- must not do
Cold relief: physician required - must do
- should do
- should not do
- must not do
Pain relief: recommend medication - must do
- should do
- could do
- should not do
- must not do
Pain relief: physician required - must do
- should do
- should not do
- must not do
Necessary care
Unnecessary care
Diagnosis
Drug name
Drug dosage
Drug action
Side effects
Other therapy
Appointments
Diagnostic studies
Smoking (proxy=notes)
Alcohol use (proxy=notes)
Blood pressure (proxy=notes)
Smoking (proxy=patient questionnaire)
Alcohol use (proxy=patient questionnaire)
Blood pressure (proxy=patient questionnaire)
Ask about smoking
Advise to stop smoking
Smoking cessation
Exercise
Diet
Smoking
Alcohol use
Substance use
Sun exposure
Seatbelt use
HIV prevention
STD prevention
Negative Predictive Value
0 0.5 1
0 0.5 1
Positive Predictive Value
Page
Luck
Zuckermann
Wilson
Ward
Flocke
Page
Luck
Zuckermann
Wilson
Ward
Flocke
Cold relief: recommend medication - must do
- should do
- should not do
- must not do
Cold relief: physician required - must do
- should do
- should not do
- must not do
Pain relief: recommend medication - must do
- should do
- could do
- should not do
- must not do
Pain relief: physician required - must do
- should do
- should not do
- must not do
Necessary care
Unnecessary care
Diagnosis
Drug name
Drug dosage
Drug action
Side effects
Other therapy
Appointments
Diagnostic studies
Smoking (proxy=notes)
Alcohol use (proxy=notes)
Blood pressure (proxy=notes)
Smoking (proxy=patient questionnaire)
Alcohol use (proxy=patient questionnaire)
Blood pressure (proxy=patient questionnaire)
Ask about smoking
Advise to stop smoking
Smoking cessation
Exercise
Diet
Smoking
Alcohol use
Substance use
Sun exposure
Seatbelt use
HIV prevention
STD prevention
Negative Predictive Value
0 0.5 10 0.5 1
0 0.5 10 0.5 1
Implementation Science 2009, 4:37 />Page 16 of 20
(page number not for citation purposes)
0.84) [7] (Figure 3). The negative predictive ability of
medical record review ranged from 0.39 to 1.00 (Median
= 0.73) across different clinical actions, and was lowest
(<0.50) for the recording of drug dosages and drug action
[9], and highest for advice-giving behaviours and the
measurement of blood pressure [7] (Figure 3).
Four further reports compared item-by-item but used
other statistical methods to do this [12,14,15,17]. Gerbert
et al. (1986) [14] report total agreement of 88% between
medical record review and video-recording for behaviours
relating to the general management of COPD. Gerbert et
al. (1988) [12] present a kappa coefficient of 0.54 for the
level of concordance between medical record review and
video-recording, and a total disagreement between these
measures of 21%. Rethans et al. [17] and Dresselhaus et al.
[15] presented summary percentage scores (65.6%,
54.0%, and 45.8%, respectively) that were consistently
lower than scores reported by a standardised patient
(76.2%, 68.0%, and 61.7%, respectively). Rethans et al.
[17] also reported a correlation coefficient of r = 0.54
between summary scores relating to the management of
commonly presenting outpatient conditions (Table 2).
The accuracy of medical record review
ROC curves were plotted for four studies where both sen-
sitivity and specificity were reported [5] or could be calcu-
lated from the raw data presented [7,9,10] (Figure 4). The
accuracy of medical record review varied according to the
type of clinical behaviour or action that was being meas-
ured. Review of medical records yielded more accurate
estimates of clinician performance for actions relating to
physical examination, blood pressure measurements, lab-
oratory tests, and screening services (which were located
in the top-left quadrant) than for actions relating to the
provision of a wide range of counselling services, includ-
ing smoking cessation advice, and alcohol counselling.
Clinician self-report
The sensitivity and specificity for clinical behaviours cate-
gorised as 'must do' and 'must not do' actions are pre-
sented in Figure 2 for one report that that used clinical
vignettes to elicit clinician self-reported behaviour [11].
ROC plots of sensitivities and specificities for three proxy measuresFigure 4
ROC plots of sensitivities and specificities for three proxy measures. Behaviours/actions in the top left-hand quadrant
have both high sensitivity and specificity. See Stange 1998 [5] for additional sensitivities and specificities for 78 items.
.2 .4
.6
.8
1
Sensitivity
0 .2 .4 .6 .8 1
1 - specificity
Proxy = Patient report
0 .2
.4 .6 .8 1
Sensitivity
0 .2 .4 .6 .8 1
1 - specificity
Proxy = Medical record
0 .2 .4
.6 .8 1
Sensitivity
0 .2 .4 .6 .8 1
1 - specificity
Proxy = Self-report
Luck 2000 Stange 1998
Wilson 1994 Zuckermann 1975
Ward 1996
Page 1980: must do
should do
should not do
must not do
Luck 2000 Stange 1998
Wilson 1994 Zuckermann 1975
Ward 1996
Page 1980: must do
should do
should not do
must not do
.2 .4
.6
.8
1
Sensitivity
0 .2 .4 .6 .8 1
1 - specificity
Proxy = Patient report
0 .2
.4 .6 .8 1
Sensitivity
0 .2 .4 .6 .8 1
1 - specificity
Proxy = Medical record
0 .2 .4
.6 .8 1
Sensitivity
0 .2 .4 .6 .8 1
1 - specificity
Proxy = Self-report
.2 .4
.6
.8
1
Sensitivity
0 .2 .4 .6 .8 1
1 - specificity
Proxy = Patient report
0 .2
.4 .6
.2 .4
.6
.8
1
Sensitivity
0 .2 .4 .6 .8 1
1 - specificity
Proxy = Patient report
0 .2
.4 .6 .8 1
Sensitivity
0 .2 .4 .6 .8 1
1 - specificity
Proxy = Medical record
0 .2 .4
.6 .8 1
Sensitivity
0 .2 .4 .6 .8 1
1 - specificity
Proxy = Self-report
Luck 2000 Stange 1998
Wilson 1994 Zuckermann 1975
Ward 1996
Page 1980: must do
should do
should not do
must not do
Luck 2000 Stange 1998
Wilson 1994 Zuckermann 1975
Ward 1996
Page 1980: must do
should do
should not do
must not do
.2 .4
.6
.8
1
Sensitivity
0 .2 .4 .6 .8 1
1 - specificity
Proxy = Patient report
0 .2
.4 .6 .8 1
Sensitivity
0 .2 .4 .6 .8 1
1 - specificity
Proxy = Medical record
0 .2 .4
.6 .8 1
Sensitivity
0 .2 .4 .6 .8 1
1 - specificity
Proxy = Self-report
.2 .4
.6
.8
1
Sensitivity
0 .2 .4 .6 .8 1
1 - specificity
Proxy = Patient report
0 .2
.4 .6
.2 .4
.6
.8
1
Sensitivity
0 .2 .4 .6 .8 1
1 - specificity
Proxy = Patient report
0 .2
.4 .6 .8 1
Sensitivity
0 .2 .4 .6 .8 1
1 - specificity
Proxy = Medical record
0 .2 .4
.6 .8 1
Sensitivity
0 .2 .4 .6 .8 1
1 - specificity
Proxy = Self-report
Luck 2000 Stange 1998
Wilson 1994 Zuckermann 1975
Ward 1996
Page 1980: must do
should do
should not do
must not do
Luck 2000 Stange 1998
Wilson 1994 Zuckermann 1975
Ward 1996
Page 1980: must do
should do
should not do
must not do
Implementation Science 2009, 4:37 />Page 17 of 20
(page number not for citation purposes)
Sensitivities and specificities ranged from 0.47 to 0.95 and
0.40 to 0.80, respectively, for 'must do' and 'should do'
behaviours, and from 0.20 to 0.70 and 0.45 to 0.90,
respectively, for 'must not do' and 'should not do' behav-
iours (Figure 2). Positive (PPV) and negative (NPV) pre-
dictive values were also calculated for this study [11].
PPVs ranged from 0.17 (cold relief: physician required/
should not do) to 0.89 (cold relief: recommend medica-
tion/should not do (Median = 0.42) (Figure 3). NPVs
ranged from 0.50 (cold relief: physician required/should
do) to 1.00 (cold relief: recommend medication/must not
do), median = 0.80 (Figure 3).
Item-by-item comparisons evaluating clinician self-report
were made by three further reports that used methods
other than sensitivities and specificities [12-14]. Gerbert et
al. (1986) [14] report 84% total agreement between clini-
cian self-report and a video-recording of the consultation.
Gerbert et al. (1988) [12] presented a kappa coefficient of
0.67 for the level of concordance between clinician self-
report during interview and video-recording, and a total
disagreement between these measures of 13%. Pbert et al.
[13] made comparisons across measures for the detection
of individual items using Cochrane's Q tests. These com-
parisons suggest that clinicians tended to over-report their
behaviour on some items compared to audio-recording.
The accuracy of clinician self-report
A ROC curve was plotted for the one study where both
sensitivity and specificity could be calculated for several,
'must do/not do' and 'should do/not do' clinical actions
[11] (Figure 4). Behaviours categorized as 'should not do'
tended to group in the top left quadrant of the plot, tenta-
tively suggesting that clinician's accurately report for such
behaviours (e.g., should not recommend medication for
cold relief). Accuracy was poorer for behaviours catego-
rized as 'must not do' and 'should do' (which tended to
group in the bottom left quadrant of the plot) and behav-
iours categorized as 'must do' (which tended to fall into
the top right quadrant of the plot).
Studies combining items into summary scores
Patient report
One report that evaluated patient report and made item-
by-item comparisons also combined items into summary
scores [13]. Pbert et al. [13] calculated scores that repre-
sented the number of smoking advice intervention steps
taken by a clinician during a patient consultation. The cor-
relation of these scores between patient report and audio-
recording was r = 0.67.
Medical record review
Three reports evaluating medical record review [15,17,18]
presented summary percentage scores (65.6%, 54.0%,
and 45.8%, respectively) that were consistently lower than
scores reported by a standardised patient (76.2%, 68.0%,
and 61.7%, respectively). One report [17] reported an
overall correlation coefficient of r = 0.54 between sum-
mary scores relating to the management of commonly
presenting outpatient conditions (Table 2).
Clinician self-report
Six reports evaluating clinician self-report calculated sum-
mary scores [11,13,15,16,18,19]. Different reports com-
pared these self-reports to different direct measures.
One report [16] presented scores for the mean number of
clinical actions performed by a group of clinicians as
measured by each method in relation to the management
of urinary tract infection (mean (SD) self-report = 9.88
(3.44), standardised patient report = 10.04 (3.37)).
Rethans et al. [16] also presented subgroup means that
suggest clinicians under-report their performance for
'obligatory' actions and over-report for less essential
'Intermediate' and 'superfluous' actions (Table 2). Two
reports calculated the proportions for actions correctly
performed; one in relation to the management of com-
mon outpatient conditions (% (SD) self-report = 71.0
(5.4), standardised patient report = 76.2 (7.2)) [18], and
one in relation to the provision of preventive care advice
(% (SD) self-report = 48.3 (14.4), standardised patient
report = 61.7 (12.9)) [15]. Page et al. [11] present an over-
all total agreement of 66% between self-report and stand-
ardized patient report.
Three reports [11,13,19] present correlation coefficients
of: 0.26 to 0.68 [11] for the relationship between perform-
ance on clinical vignettes and standardized patient
reports; 0.21 for a global self-estimate of performance of
hand hygiene actions with direct observation [19]; and
0.54 for clinician self-reported provision of smoking ces-
sation counselling compared with audio-taped accounts
of the consultation [13].
Discussion
Validity of the direct measures used
A problem in assessing any proxy measure of clinician
performance is the validity of the direct measure itself as a
true reflection of actual behaviour. Simulated patients
(standardised patients) have been widely used in medical
education, and there is an extensive literature to support
their validity as a 'gold standard' method for measuring
clinical behaviour [12,14,18]. Standardised patients
require careful and detailed training in the clinical case
they are to represent [20], and for those studies reviewed
here that provide information about the training of stand-
ardised patients, this appears to have been adequate [20].
Three included studies assessed detection rates by clini-
cians, and reported these to be low. The six studies
[10,11,15-18] that used simulated patients specify very
precisely the characteristics of the cases presented to the
clinicians. The other studies observed the clinicians'
Implementation Science 2009, 4:37 />Page 18 of 20
(page number not for citation purposes)
behaviour with actual patients and therefore had less con-
trol over the clinical situation in which behaviour was
assessed, but are likely to be more generalisable to real-life
clinical situations.
Direct observation using trained observers, audio- or
video-recording are also methods that are commonly used
as direct measures of clinical behaviour. However, one
study [14] using video-recording of consultations found
that relevant clinical detail – for example, assessment of
symptoms and signs – was more frequently reported as
having been done when measured by clinician self-report.
Taken at face value, this may suggest over-reporting on
behalf of clinicians. However, it is feasible that some
aspects of the clinical assessment of symptoms and signs
are performed non-verbally. In another study, the meas-
urement of blood pressure was accurately recorded in the
patient medical record but was not detected by the direct
measure used (audio-recording) [7]. It is also plausible
that, while we can expect that standardized patients may
observe a clinician making an entry in a medical record,
they could not accurately comment on the content of the
entry. A further example of the limits of capture for direct
measures can be seen in one of four reports that compared
the direct measure of audio-recording with the proxy of
medical record review [9]. This report found that while
some clinical actions investigated (for example, the dis-
cussion of a diagnosis or drug name during a consultation
with a patient) were not detected during evaluation of the
audiotape session a diagnosis and the name and dosage of
drugs prescribed had been recorded in medical records by
the physician. As an aim of this report was to evaluate cli-
nician communication with patients, the direct measure
was valid as it gave an accurate account of what the physi-
cian did, and did not, communicate to the patient. How-
ever, audio-recording would lack validity as a direct
measure for the making or documenting of a diagnosis
and some related management decisions.
This suggests that there are very few gold standard, direct
methods for assessing clinical performance – possibly
only standardised patient methodology and participant
observation – that can validly cover an extensive range of
clinical actions, and that none can truly capture all aspects
of behaviour. A direct measure can only be a valid gold
standard for any given behaviour of interest, if it can reli-
ably capture that behaviour.
Validity of the proxy measures used
The accuracy of three proxy measures was reviewed:
patient report, medical record review, and clinician self-
report. These indirect measures were used by the included
reports to estimate the performance of a wide range of
clinical actions. The accuracy of each proxy measure var-
ied across the clinical behaviours measured. Reports eval-
uating clinician self-report and patient-report also used
different techniques to capture the measure of behaviour
(e.g., interview, self-completion questionnaire, patient
vignettes).
Patient report
Patient-report measures demonstrated greater accuracy
than the other two proxy measures for reporting clinician
performance, particularly with respect to counselling
behaviours and routine procedures. A cautionary adjunct
to this, however, is the finding of one study that the pre-
dictive validity of patient-reported information deterio-
rates markedly as the time between patient exposure to
clinician behaviour and the timing of their recall of events
increases [8]. Also, patient recall was found by another
study to be significantly influenced by the duration of the
advice and factors relating to relevancy, i.e., advice pro-
vided during well-care consultations and the presence of a
health behaviour-relevant diagnosis during an illness visit
[6].
Medical record review
Medical record review appeared to underestimate many
aspects of clinician behaviour, particularly in the domain
of patient counselling. Thus, our findings suggest that
medical record review, in the outpatient setting, lacks
validity as a general measure of clinician behaviour. How-
ever, there was evidence to suggest that the predictive abil-
ity of medical record review improves substantially for,
but is restricted to, specific types of clinical action, for
example, physical examination, the recording of drug dos-
ages, and the ordering of laboratory tests. Medical records
may therefore be a relatively low-cost and accessible proxy
measure for these clinical behaviours. Medical records
may also be advantageous in that they can be good 'his-
tory keepers' because they can store information from sev-
eral consultations and a variety of conditions.
Clinician self-report
The accuracy of clinician self-report as a measure of actual
behaviour is harder to establish because different studies
using different methods produced different outcomes.
Also, none of the studies evaluating clinician report used
appropriate statistical methods to summarise and/or
report the relationship between the measures used.
Four reports that calculated summary scores of perform-
ance on vignettes appear to suggest that clinician's self-
reported estimates of their behaviour were, overall, close
to those generated by the direct measure. However, closer
examination of the individual behaviours contributing to
the overall summary scores by one of these studies [16]
revealed that clinicians were overestimating their per-
formance of some clinical actions and underestimating
their performance of others, an observation lost in the
Implementation Science 2009, 4:37 />Page 19 of 20
(page number not for citation purposes)
summary score due to counterbalancing. Over- and
underestimation was also tentatively suggested on the
ROC plot for an additional study [11], albeit in a contrast-
ing direction.
Of these two studies demonstrating over- and underesti-
mation of self-reported behaviour, one provided clini-
cians with a closed-ended checklist of possible behaviours
[11]. The second study used an open-ended response
mode with responses coded later by an independent
observer [16]. This may explain the conflicting outcomes
of these two studies; because closed-ended checklists pro-
vide clinicians with an extensive list of possible actions,
they may produce a cueing effect for them to select addi-
tional actions or act as a prompt to elicit knowledge about
what they could, or should not do [21-23]. Such variation
in the ability of vignettes to predict the occurrence of
important behaviours that clinicians should or should not
do undermines their validity. However, this may be a
problem that can be overcome by careful and rigorous
development of vignette cases and the method of their
presentation [21].
Measures that use vignettes require clinicians to report
their behaviour in the context of what they would do in a
given clinical scenario. The remaining studies evaluating
clinician self-report collected retrospective accounts of
actual behaviour using either interview or questionnaire
methods and report correlation coefficients and measures
of 'total agreement' that suggest good agreement between
measures. However, correlation is a measure of associa-
tion, and a high correlation can effectively disguise impor-
tant disagreement if there is a consistent bias in one
measure [24]. A similar problem exists with the interpre-
tation of 'total' or 'observed' agreement in that a large pro-
portion of the agreement may be for behaviours that were
reported by both measures as not performed, again dis-
guising important deficits in a proxy measure to accurately
detect actual performance [25].
Review limitations
Many references reviewed were sourced from the reference
lists of retrieved articles. We did not find a common ter-
minology for describing written case simulations or proxy
methods, and it is therefore possible that our database
search was subsequently limited by this. A common ter-
minology for measures would greatly facilitate research in
this area. The literature search only covered up to August
2004; an update of this review could provide further use-
ful information. A further limitation of this review is that
we were not able to combine data due to the heterogeneity
of the included reports. We tried to minimise publication
bias by searching not only the peer-reviewed literature but
also abstracts of conferences and unpublished theses. As
we were unable to conduct a formal meta-analysis
because of the heterogeneity in the designs, proxy meas-
ures, and summary statistics used in the included studies,
we could not use conventional methods of assessing pub-
lication bias [26]. Nevertheless, the included studies pre-
sented various results – seven studies [5-7,9,11,14,17]
presented a range of both positive and negative findings,
six studies [8,10,12,13,15,18] presented positive findings
only and one [16] presented only negative or inconclusive
findings – suggesting that there is no apparent systematic
tendency towards publication bias in the current review.
Conclusion
In validating a proxy measure of clinical behaviour it is
imperative that the direct measure for comparison is itself
both reliable and valid. In some of the included reports
the direct measure lacked validity. Only four studies were
found that used appropriate statistical methods to com-
pare measures. The validity of patient report and medical
record review varied widely across a number of clinical
actions but was high for some specific clinical actions. The
evidence for the validity of clinician self-report is incon-
clusive.
Two recent systematic reviews evaluated the efficacy of
social cognitive models of behaviour in explaining clinical
performance [3,27]. Both reviews found that the relation-
ship between clinicians' self-reported intention and their
behaviour is not perfect (maximum R
2
reported was 0.44
[27]), and that the strength of the relationship often var-
ied depending on the method used to measure their
behaviour. The current review supports the notion that at
least some of the discrepancy between intentions and
behaviour can be explained by error originating from
unreliable measures of behaviour.
Valid measures of clinical behaviour are of fundamental
importance to accurately identify gaps in care delivery, to
continuous improvement of quality of care, and ulti-
mately to improved patient care. However, the evidence
base for three commonly used proxy measures of clini-
cians' behaviour is very limited. Further research needs to
establish the scope of capture for a range of both direct
and indirect measures of clinical behaviour and the
potential for using a combination of proxy measures to
obtain an all round picture of clinical behaviour.
Competing interests
The authors declare that they have no competing interests.
Authors' contributions
All authors contributed to the conception and design and
analysis of the study and approved the submitted draft.
MPE, JJF, EK SH and HD reviewed the articles and
abstracted the data.
Publish with Bio Med Central and every
scientist can read your work free of charge
"BioMed Central will be the most significant development for
disseminating the results of biomedical research in our lifetime."
Sir Paul Nurse, Cancer Research UK
Your research papers will be:
available free of charge to the entire biomedical community
peer reviewed and published immediately upon acceptance
cited in PubMed and archived on PubMed Central
yours — you keep the copyright
Submit your manuscript here:
/>BioMedcentral
Implementation Science 2009, 4:37 />Page 20 of 20
(page number not for citation purposes)
Additional material
References
1. The Information Centre: Quality and Outcomes Framework for
GP practices. [ />]. [cited 28.08.2008]
2. Department of Health: New GMS Contract 2003. Investing in
general practice. NHS Confederation and the British Medical
Association. London; 2003.
3. Eccles MP, Hrisos S, Francis J, Kaner EF, Dickinson HO, Beyer F, John-
ston M: Do self-reported intentions predict clinicians' behav-
iour: a systematic review. Implement Sci. 2006, 1:28.
4. Streiner DL, Norman GR: Health Measurement Scales: a practical guide
to their development and use 3rd edition. Oxford: Oxford University
Press; 2003.
5. Stange KC, Zyzanski SJ, Smith TF, Kelly R, Langa DM, Flocke SA, Jaen
CR: How valid are medical records and patient question-
naires for physician profiling and health services research? A
comparison with direct observation of patients visits. Medical
Care 1998, 36:851-867.
6. Flocke SA, Stange KC: Direct observation and patient recall of
health behavior advice. Prev Med 2004, 38:343-349.
7. Wilson A: Comparison of patient questionnaire, medical
record, and audio tape in assessment of health promotion in
general practice consultations. Source. BMJ 1994,
309:1483-1485.
8. Ward J, Sanson-Fisher R: Accuracy of patient recall of oppor-
tunistic smoking cessation advice in general practice. Tobacco
Control 1996, 5(2):110-113.
9. Zuckerman ZE, Starfield B, Hochreiter C, Kovasznay B: Validating
the content of pediatric outpatient medical records by
means of tape-recording doctor-patient encounters. Pediat-
rics 1975, 56(3):407-411.
10. Luck J, Peabody JW, Dresselhaus TR, Lee M, Glassman P: How well
does chart abstraction measure quality? A prospective com-
parison of standardized patients with the medical record.
American Journal of Medicine 2000, 108(8):642-649.
11. Page GG, Fielding DW: Performance on PMPs and perform-
ance in practice: are they related? 1980, 55:529-537.
12. Gerbert B, Stone G, Stulbarg M, Gullion DS, Greenfield S: Agree-
ment among physician assessment methods. Searching for
the truth among fallible methods. Medical Care 1988,
26:519-535.
13. Pbert L, Adams A, Quirk M, Herbert JR, Ockene JK, Luippold RS: The
patient exit interview as an assessment of physician-deliv-
ered smoking intervention: a validation study. Health Psychol
1999, 18:183-188.
14. Gerbert B, Hargreaves WA: Measuring physician behavior. Med-
ical Care 1986, 24:838-847.
15. Dresselhaus TR, Peabody JW, Lee M, Wang MM, Luck J: Measuring
compliance with preventive care guidelines: standardized
patients, clinical vignettes, and the medical record. Journal of
General Internal Medicine 2000, 15(11):782-788.
16. Rethans JJ, van Boven CPA: Simulated patients in general prac-
tice: a different look at the consultation. British Medical Journal
1987, 294:809-812.
17. Rethans JJ, Martin E, Metsemakers J: To what extent do clinical
notes by general practitioners reflect actual medical per-
formance? A study using simulated patients. British Journal of
General Practice 1994, 44(381):153-156.
18. Peabody JW, Luck J, Glassman P, Dresselhaus TR, Lee M: Compari-
son of vignettes, standardized patients, and chart abstrac-
tion: a prospective validation study of 3 methods for
measuring quality. JAMA 2000, 283(13):1715-1722.
19. O'Boyle C, Henly S, Larson E: Understanding adherence to hand
hygiene recommendations: the theory of planned behavior.
Am J Infect Control 2001, 29:352-360.
20. Buellens J, Rethans JJ, Goedhuys J, Buntinx F: The use of standard-
ised patients in research in general practice. Family Practice
1997, 14:58-62.
21. Peabody JW, Luck J, Glassman P, Jain S, Hansen J, Spell M: Measuring
the quality of physician practice by using clinical vignettes: a
prospective validation study. Annals of Internal Medicine 2004,
141:771-780.
22. Spies T, Mokkink H, De Vries Robbe P, Grol R: Which data source
in clinical performance assessment? A pilot study comparing
self-recording with patient records and observation. Interna-
tional Journal for Quality in Health Care 2004, 16(1):65-72.
23. Jones TV, Gerrity MS, Earp J: Written case simulations: do they
predict physicians' behaviour? Journal of Clinical Epidemiology
1990, 43(8):805-815.
24. Chia KS: Association or Agreement? Annals Academy of Medicine
Singapore 2000, 29:263-264.
25. Hripcsak G, Heitjan DF: Measuring agreement in medical infor-
matics reliability studies. Journal of Biomedical Informatics 2002,
35(2):99-110.
26. Egger M, Davey Smith G, Altman DG, (Eds): Investigating and dealing
with publication and other biases. Chapter 11 in Systematic reviews in
health care: meta-analysis in context 2nd edition. London: BMJ books;
2001.
27. Godin G, Belanger-Gravel A, Eccles MP, Grimshaw J: Healthcare
professionals' intentions and behaviours: A systematic
review of studies based on social cognitive theories. Imple-
mentation Science 2008, 3(36):.
Additional file 1
Characteristics of included studies. Detailed description of the charac-
teristics of all studies included in the review.
Click here for file
[ />5908-4-37-S1.doc]
Additional file 2
Results presented by studies included in the review. Detail of the sam-
ples, analyses and outcomes presented by studies included in the review.
Click here for file
[ />5908-4-37-S2.doc]