báo cáo khoa học: "Audit and feedback and clinical practice guideline adherence: Making feedback actionable" docx
Bạn đang xem bản rút gọn của tài liệu. Xem và tải ngay bản đầy đủ của tài liệu tại đây (287.53 KB, 10 trang )
BioMed Central
Page 1 of 10
(page number not for citation purposes)
Implementation Science
Open Access
Research article
Audit and feedback and clinical practice guideline adherence:
Making feedback actionable
Sylvia J Hysong*
1,2
, Richard G Best
3
and Jacqueline A Pugh
4,5
Address:
1
Houston Center for Quality of Care and Utilization Studies, Michael E. DeBakey VA Medical Center, Houston, Texas, USA,
2
Department
of Medicine – Health Services Research Section, Baylor College of Medicine, Houston, Texas, USA,
3
Healthcare Solutions Division, Lockheed
Martin Information Technology, San Antonio, Texas, USA,
4
Veterans Evidence-Based Research Dissemination and Implementation Center, South
Texas Veterans Health Care System, San Antonio, Texas, USA and
5
Department of Medicine, University of Texas Health Science Center at San
Antonio, San Antonio, Texas, USA
Email: Sylvia J Hysong* - ; Richard G Best - ; Jacqueline A Pugh -
* Corresponding author
Abstract
Background: As a strategy for improving clinical practice guideline (CPG) adherence, audit and
feedback (A&F) has been found to be variably effective, yet A&F research has not investigated the
impact of feedback characteristics on its effectiveness. This paper explores how high performing
facilities (HPF) and low performing facilities (LPF) differ in the way they use clinical audit data for
feedback purposes.
Method: Descriptive, qualitative, cross-sectional study of a purposeful sample of six Veterans
Affairs Medical Centers (VAMCs) with high and low adherence to six CPGs, as measured by
external chart review audits.
One-hundred and two employees involved with outpatient CPG implementation across the six
facilities participated in one-hour semi-structured interviews where they discussed strategies,
facilitators and barriers to implementing CPGs. Interviews were analyzed using techniques from the
grounded theory method.
Results: High performers provided timely, individualized, non-punitive feedback to providers,
whereas low performers were more variable in their timeliness and non-punitiveness and relied on
more standardized, facility-level reports. The concept of actionable feedback emerged as the core
category from the data, around which timeliness, individualization, non-punitiveness, and
customizability can be hierarchically ordered.
Conclusion: Facilities with a successful record of guideline adherence tend to deliver more timely,
individualized and non-punitive feedback to providers about their adherence than facilities with a
poor record of guideline adherence. Consistent with findings from organizational research,
feedback intervention characteristics may influence the feedback's effectiveness at changing desired
behaviors.
Published: 28 April 2006
Implementation Science 2006, 1:9 doi:10.1186/1748-5908-1-9
Received: 17 January 2006
Accepted: 28 April 2006
This article is available from: />© 2006 Hysong et al; licensee BioMed Central Ltd.
This is an Open Access article distributed under the terms of the Creative Commons Attribution License ( />),
which permits unrestricted use, distribution, and reproduction in any medium, provided the original work is properly cited.
Implementation Science 2006, 1:9 />Page 2 of 10
(page number not for citation purposes)
Background
Audit and feedback (A&F) has been used for decades as a
strategy for changing the clinical practice behaviors of
health care personnel. In clinical practice guideline (CPG)
implementation, A&F has been used to attempt to
increase guideline adherence across a wide variety of set-
tings and conditions, such as inpatient management of
chronic obstructive pulmonary disease (COPD)[1], test
ordering in primary care[2,3], and angiotensin-converting
enzyme (ACE) inhibitor and beta-blocker usage in cardiac
patients[4]. Recent reviews, however, indicate that the
effectiveness of A&F as a strategy for behavior change is
quite variable. Grimshaw and colleagues[5] reported a
median effect size of A&F of +7% compared to no inter-
vention using dichotomous process measures, with effect
sizes ranging from 1.3% to 16%; however, that same
review reported non-significant effects of A&F when con-
tinuous process measures were used. Along similar lines,
Jamtvedt and colleagues [6] reported a median adjusted
relative risk of non-compliance of .84 (interquartile range
(IQR): .76–1.0), suggesting a performance increase of
16% (IQR: no increase to 24% increase). Such studies
attribute much of the variability in effect of the interven-
tions to (often unrecognized) differences in the character-
istics of the feedback used in the intervention and/or to
the conditions under which A&F is more likely to be effec-
tive [6-9].
Earlier A&F research has suggested that the timing of feed-
back delivery can influence the resulting behavior
change[10], as can the credibility of the feedback source
[11-13]. Research from the organizational literature sug-
gests a host of other potential explanatory phenomena as
potentially affecting the effectiveness of feedback, such as
its format (e.g., verbal vs. written), its valence (i.e.,
whether it is positive or negative)[14], and its content
(e.g., whether it is task-focused or person-focused, indi-
vidual or group based, normative or ipsative)[15]. Our
own research has noted that facilities with higher CPG
adherence (i.e., high performing facilities, or HPF) relied
more heavily on chart data as a source of feedback and
placed greater value on educational feedback approaches
than facilities with lower guideline adherence (low per-
forming facilities, or LPF)[16]. Taken together, these
research findings indicate a need to further explore the
characteristics of A&F and their impact on the desired
behavioral change. Building on our previous work on bar-
riers and facilitators of clinical practice guideline imple-
mentation, the purpose of the analyses reported here is to
address this need in the A&F literature by exploring how
HPF and LPF differ in the way they use clinical audit data
for feedback purposes.
Methods
Measurement of clinical practice guideline adherence
Guideline adherence was measured via External Peer
Review Program (EPRP) rankings. EPRP is a random chart
abstraction process conducted by an external contractor to
audit performance at all VA facilities on numerous quality
of care indicators, including those related to compliance
with clinical practice guidelines. We obtained data for fis-
cal year 2001 reflecting facility-specific adherence to
guideline recommendations for six chronic conditions
usually treated in outpatient settings: diabetes, depres-
sion, tobacco use cessation, ischemic heart disease, cardi-
opulmonary disease, and hypertension. Each condition is
monitored via multiple performance indicators; in total,
20 performance indicators were used to describe compli-
ance across the six conditions. Facilities were rank ordered
from 1–15 (15 being the highest performer) on each per-
formance indicator. HPF tended to rank consistently high
across most disease conditions, and LPF tended to consist-
ently rank low across most disease conditions; conse-
quently, all 20 performance indicator ranks were summed
to create an indicator rank sum (IRSUM) score [higher
IRSUM scores indicate higher performance]. Facilities
then were rank-ordered according to their IRSUM score to
identify the three highest and the three lowest performing
facilities, which were used for sample selection.
Site selection
The data herein were part of a larger data collection effort
at 15 VA facilities designed to examine barriers and facili-
tators to CPG implementation[17]. These facilities were
selected from four geographically diverse regional net-
works using stratified purposive sampling. To be invited
to participate, facilities had to be sufficiently large to
accommodate at least two primary care teams, each con-
taining at least three MD providers. In order to address the
present paper's specific research question, only the highest
and lowest performing facilities (based on their IRSUM
score described above) were included in the sample. Thus,
the final sample for this paper consisted of employees at
three HPF and three LPF.
Participants
One-hundred and two employees across six facilities were
interviewed. Within each facility, personnel at three differ-
ent organizational levels participated: Facility leadership
(e.g., facility director, chief of staff), middle management
and support management (e.g., quality assurance man-
ager, primary care chief, information technology man-
ager), and outpatient clinic personnel (e.g., physicians,
nurses, and physicians' assistants). All three levels were
adequately represented in the sample (see Table 1). No
significant differences in the distribution of participants
were found by facility or organizational level (χ
2
10
= 17.4,
n.s.). Local contacts at each facility assisted in identifying
Implementation Science 2006, 1:9 />Page 3 of 10
(page number not for citation purposes)
clinical and managerial personnel with the requisite
knowledge, experience, and involvement in guideline
implementation to serve as potential participants. The
study was locally approved by each facility's institutional
review board (IRB), and participation at each facility was
voluntary. An average of nine interviews occurred at each
facility, for a total of 54 interviews at the six facilities
(Table 1).
Procedure
Three pairs of interviewers were deployed into the partici-
pating sites during the spring of 2001. The interviewers
were research investigators of various backgrounds (e.g.,
medicine, nursing, organizational psychology, clinical
psychology, and sociology), with in-depth knowledge of
the project, and most were involved with the project since
its inception. None of the interviewers was affiliated with
any of the participating facilities.
Each pair travelled to a given site for two days, where
together the interviewers conducted one-hour, semi-struc-
tured interviews either individually or in small groups,
depending on the participants' schedule and availability
(see appendix for interview guide and protocol). Inter-
viewers took turns leading the interview, while the sec-
ondary interviewer concentrated on active listening, note-
taking, and asking clarifying questions. Interviewers dis-
cussed their own observations after each interview, and
compiled field notes for each facility based on these
observations and discussions. To minimize interviewer
bias, interviewer pairs were (a) blinded to the facility's
performance category, and (b) split and paired with differ-
ent partners for their following site visit. All interviewers
were trained a priori on interviewing and field note proto-
col.
Participants were asked how CPGs were currently imple-
mented at their facility, including strategies, barriers and
facilitators. Although interviewers used prepared ques-
tions to guide the interview process, participants were
invited to (and often did) offer additional relevant infor-
mation not explicitly solicited by the interview questions.
The interviews were audio recorded with the participants'
consent for transcription and analysis.
Data analysis
Interview transcripts were analyzed using a grounded the-
ory approach[18,19]. Grounded theory consists of three
analytic coding phases: open, axial, and selective coding –
each is discussed below. Transcripts were analyzed using
Atlas.ti 4.2, a commonly used qualitative data analysis
software program[20].
Open coding
Automated searches were conducted on the interview
transcripts for instances of the following terms: "feed-
back," "fed back," "feeding back," "report" and its varia-
tions (e.g., reporting, reports, reported), "perform" and its
variations (e.g., performing, performed, performance),
"audit" and its variations (e.g., auditing, audited, audits),
and "EPRP". All word variations were captured via a trun-
cated word search. The results were then manually
reviewed for relevance, and only passages that specifically
discussed feedback on individuals' adherence to clinical
practice guidelines were included. Examples of excluded
feedback references included feedback about the compu-
ter interface to information technology personnel, or
anecdotal comments received from patients about pro-
vider adherence. This review resulted in 122 coded pas-
sages across the 54 interviews in the six facilities, for an
average of 20 coded passages per facility.
Table 1: Number of participants by facility and hierarchical level
Facility Hierarchical Level Total # of
Participants
Total # of
Interviews
Primary Care
Personnel
Middle/Support
Management
Facility
Leadership
High Performers 1 14 2 3 19 8
26 10 7 23 14
37 4 3 14 9
Low Performers 4 4 8 4 16 8
53 4 4 11 7
67 10 2 19 8
Total 41 38 23 102 54
Note: Facilities are listed in decreasing order of performance. No significant differences in the distributions of participants were found by facility or
hierarchical level (χ
2
10
= 17.4, n.s.).
Implementation Science 2006, 1:9 />Page 4 of 10
(page number not for citation purposes)
Axial coding
In this phase of analysis, the passages identified during
open coding are compared and thematically organized
and related. This process resulted in identification of four
characteristics of feedback from the data: timeliness, indi-
vidualization, customizability and punitiveness. Each is
discussed in more detail in the results section. Passages
identified during open coding were categorized among
these four properties and were organized by facility
according to each of these properties. To ensure coding
quality and rigor, code definitions were explicitly docu-
mented as soon as they emerged, and were continuously
referred to throughout the coding process. Code assign-
ment justifications were written for each passage as it was
categorized, and coded passages were re-examined to
insure that code assignments were consistent with code
definitions. Patterns in the high performing facilities were
compared among each other, searching for potential com-
monalities, as were patterns in the low-performing facili-
ties. Once patterns were identified we relied on the corpus
of field notes and informal observations from interview-
ers to provide interpretive context.
Selective coding
This phase of analysis involves integrating and refining
the ordered categories from the axial coding phase into a
coherent model or theory, usually based on a core or cen-
tral category from the data. Based on the pattern of pas-
sages examined during axial coding, the "customizability"
category emerged as the critical phenomenon around
which a model grounded in the data was constructed,
centering on the concept of actionable feedback. This is
discussed in more detail in the results section.
Results
Feedback characteristic patterns in high and low
performing facilities
Four characteristics emerged from the data that described
the nature of feedback received by clinicians at VA outpa-
tient facilities. Table 2 summarizes the patterns of feed-
back use across the six facilities. Each characteristic is
discussed in more detail below.
Timeliness
This refers to the frequency with which providers receive
feedback. Monthly or more frequent feedback reports
were considered timely; quarterly or less frequent reports
were considered untimely. We chose monthly feedback as
the timeliness threshold because, given usual time inter-
vals between appointments within VA, quarterly or less
frequent feedback may not give the provider sufficient
time to change his/her behavior in time for a patient's
next appointment.
All facilities reported delivering feedback in a timely man-
ner. However, as seen in Table 2, the evidence for timeli-
ness of feedback is more mixed in the low-performing
facilities than in the high-performing facilities. Conflict-
ing reports of timely and untimely feedback delivery were
observed in the low-performing facilities, whereas timely
feedback delivery was clearly the dominant practice in
high-performing facilities (all names and initials in quo-
tations are fictitious, to protect participant confidential-
ity):
And then we also do what's basically called, excuse me, provider
score cards for the VISN's, and it will show exactly in which
areas they were found lacking throughout the entire process for
all the CPG's, for all the PI's [performance indicators]. Q:
And that's how often? A: About once a month.
R.R., a support management employee in a HPF.
Individualization
This refers to the degree to which providers receive feed-
back about their own individual performance, as opposed
to aggregated data at the team, clinic or facility level. As
can be seen from the table, none of the low-performing
facilities provided individualized feedback to their pro-
viders. In most cases, individual providers received facility
level data from the EPRP report.
To be honest, most of the monitoring has really been done
through the EPRP data collection. If one looks at some of the
other guidelines, such as our COPD guideline, there we really
don't have a formal system set up for monitoring that. So if one
really looks at performance and outcomes, EPRP remains prob-
ably our primary source of those types of data.
B.F., An executive level employee in a LPF.
In contrast, all three high-performing facilities reported
providing individual level data to their providers:
Table 2: Patterns of feedback properties by facility
High Performers Low Performers
PROPERTY 123456
Timely EEEECC
Individualized E E C N N N
Non-Punitive E E I I N I
Customizable I I I N N I
Note: E = Evidence was observed that the property in question was
present at that facility; C = conflicting evidence; I = insufficient
evidence; and N = negative evidence, i.e., evidence that the opposite
property was present (e.g., an N for facility 4 on individualized means
that there is evidence that the feedback is not individualized).
Implementation Science 2006, 1:9 />Page 5 of 10
(page number not for citation purposes)
Feeding it back, the individual reports go back to the practition-
ers and providers so they would see for a specific patient that
was reviewed for where actual outcomes were. And many of
them take that information to heart and would actually look, go
back to the medical records and say, "Oh yeah! You're right! I
missed this," or "Oh no! You guys didn't pick up this." And
they'd go back and show us where they documented it and that
would allow us to have the dialogue.
M.M., a support management employee in a HPF.
Punitiveness
This concerns the tone with which the feedback is deliv-
ered. Two out of the three HPF explicitly reported that
they approached underperforming providers in a non-
punitive way to help them achieve better adherence rates.
It's a little more than that. She [the chief of staff] sends out pos-
itive letters. She sends out suggestions for improvement letters.
But at the same time the people on the provider fields know that
Tom and I both do this review, and I've offered many, many
times to say if you've got a case that you don't understand why
this didn't meet criteria, call me and we'll look at it together.
And I think that's been a real positive for this place because if I
can go over that particular case that applies to you, it's much
more beneficial
G.D., a support management employee in a HPF.
Oh yeah, by provider, by clinic, we track them by clinic. We can
tell who, and we don't use it punitively. We just say, we had one
provider in particular that was not doing very well. And we just
showed him data, and "this is your comparative data" and all
your other providers in the clinic are getting this done. And why
are you not? And he's like, "thank you for telling me," and he
jumped up there and is doing as well as everybody else.
M.B., a support management employee in a HPF.
In contrast, employees at one LPF made explicit mention
of the punitive atmosphere associated with low guideline
adherence rates.
Sometimes I almost thought that it was in the overall presenta-
tion. If it wasn't so threatening and if it was interactive, and if
it was, you can show me and we're going to work with you
then you can get a better buy-in than you can if just saying, this
is it. Do it! Heads will roll! We'll chop off one finger and then
we'll go for a hand and a foot, kind of thing!
C.C., a clinician in a LPF.
We're down here in the trenches and if something goes wrong,
somebody pounds on our head. Otherwise, they leave us alone.
A.B., a clinician in a HPF.
For the rest of the facilities, however, there were insuffi-
cient reports in either direction to indicate the presence of
a punitive or non-punitive approach to delivering feed-
back.
Customizability
This referred to the ability to view performance data in a
way that was meaningful to the individual provider. No
facilities reported having customizable reports or tools
that allowed individual providers to customize their per-
formance information to their needs. Some facilities,
however, did report having some capability to customize
(even though that capability was not being employed), as
expressed by this respondent:
Yes, we could pull out, let's say, I could pull out all of the
patients that have a reminder due with the diabetic foot that's
a diabetic. And then I could see that two [providers] have 500
[patients with a reminder due]. You only have 100. Guess
who's doing much better. My reminder program can do that.
H.S., a support management employee in a HPF.
I've got my computer setup where I can just plug in the num-
bers, get a new set of numbers, and then update my overall
cumulative scores within 10, 15 minutes. And that's what gets
fed back very, very quickly.
S.M., a clinician in a HPF.
These reports came exclusively from high-performing
facilities; however, there were several reports, both from
HPF and LPF, about the utility and desirability of having
such information.
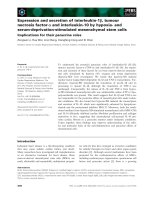
A model of actionable feedback
From the pattern of the feedback properties, a hierarchical
ordering can be postulated to arrive at a model of action-
able feedback (see Figure 1). At a minimum, feedback
must be timely in order to be useful or actionable – one
can easily imagine situations where the most thoughtful,
personalized information would be useless if it were
delivered too late. Next, feedback information must be
about the right target. In this case, since clinical practice
guideline adherence is measured at an individual level
(i.e., the data from which adherence measures are con-
structed concern individual level behaviors such as order-
ing a test or performing an exam), clinician feedback
should be about their individual performance rather than
aggregated at a clinic or facility level to maximize its effec-
tiveness[21,22]. Third is non-punitiveness – feedback
delivered in a non-punitive way is less likely to be resisted
by the recipient regardless of content [15,23,24], thus
Implementation Science 2006, 1:9 />Page 6 of 10
(page number not for citation purposes)
making it more actionable. Finally, customizability
engages the individual with the data, making him/her an
active participant in the sense-making process, rather than
a passive recipient of information. The proposed hierar-
chical ordering is reflected in the data. As seen in table 2,
four out of six facilities reported using EPRP data to
deliver timely feedback to their providers. The HPF pro-
vided individualized feedback to their providers, whereas
the LPF indicated that they used facility level, rather than
provider-specific reports as a feedback source. Only the
top two performing facilities specifically indicated that
they approached feedback delivery non-punitively,
whereas no evidence of this existed either way in the other
facilities (save for one LPF which reported explicit
instances of punitive feedback delivery). No facilities
reported providing their clinicians with the ability to cus-
tomize their own individual performance data, although
all facilities expressed a desire for this capability. Thus, as
we move up the facility rankings from the lowest to the
highest performer, more of the properties appear to be
present. This hierarchical ordering thus leads us to postu-
late the underlying dimension of "actionable feedback."
Discussion
We employed a qualitative approach to study differences
in how high- and low-performing facilities used clinical
audit data as a source of feedback. HPF delivered feedback
in a timely, individualized, and non-punitive manner,
whereas LPF were more variable in their timeliness, and
relied on more standardized facility-level reports as a
source of feedback, with one facility reporting a punitive
atmosphere. The concept of actionable feedback emerged
as the core category in these data, around which timeli-
ness, individualization, non-punitiveness, and customiz-
ability can be hierarchically ordered.
The emergent model described above is consistent with
existing individual feedback theories and research. Feed-
back intervention theory (FIT)[15] posits that in order to
have a positive impact on performance, feedback should
be timely, focused on the details of the task, particularly
on information that helps the recipient see how his/her
behavior should change to improve performance (correct
solution information), and delivered in a goal-setting
context. These propositions are consistent with empirical
A Model of Actionable FeedbackFigure 1
A Model of Actionable Feedback. *The use of the term optimal to describe the effect on performance is relative – by this we
mean optimal, given the variables in the emergent model. There are certainly other factors which could affect performance,
although they are not exhibited here.
Implementation Science 2006, 1:9 />Page 7 of 10
(page number not for citation purposes)
research. Timely feedback has long been positively associ-
ated with feedback effectiveness in the organizational lit-
erature,[13] as has the need for individualized
feedback[21,22]. Feedback delivered in a non-punitive
way has been empirically linked to increased likelihood of
feedback acceptance[25], a critical moderator of the rela-
tionship between feedback and performance[26]. Finally,
although the effect of customizable feedback on feedback
acceptance and subsequent performance has not been
directly examined in the literature, this relationship can
be inferred from related research and theory. Research
indicates that clinicians want to access and interact with
computerized clinical data more naturally and intuitively
than is currently offered by EMR systems[27]. FIT pro-
poses that feedback interventions that direct attention
toward task details tend to improve performance. The
ability of the provider to customize his or her specific per-
formance data into something that is meaningful to him/
her is likely to direct attention to the details of the per-
formance measure in question, thereby increasing the
likelihood of subsequent performance improvements.
This research has implications for both research and prac-
tice. First, it suggests that A&F is not an all-or-nothing
intervention: how feedback is delivered plays an impor-
tant role in its effectiveness. Thus, some of the mixed find-
ings in the A&F literature[5,6] could be partially explained
by differences in feedback characteristics. Future research
should consider such characteristics when designing A&F
interventions.
Second, from a practice perspective, this research reminds
administrators that A&F, whether for administrative or
developmental purposes, is more than simple reporting of
performance data. Feedback needs to be meaningful in
order for recipients to act on it appropriately. Electronic
tools such as VA's Computerized Patient Records System
(CPRS) can help provide clinicians timely, individualized
and customizable feedback – if used correctly. For exam-
ple, CPRS is capable of generating individualized, custom-
ized reports, however, this capacity is not widely known,
and thus remains underused. VA is already taking steps to
make this capability better understood, with a re-engi-
neering of CPRS to make template creation and report
generation a simpler task for the user, and by offering
training on the use of these tools system-wide[28]. How-
ever, whether feedback is punitively delivered is strictly a
human matter; administrators should take care to adopt
an educational, developmental perspective to feedback
delivery. All of this, of course, assumes that the data fed
back to the clinician are valid and reliable. Issues of sam-
ple size (whether sufficient cases of a given indicator exist
to calculate a stable estimate for an individual provider),
reliability, and appropriateness of behaviours and out-
comes as indicators of quality (e.g., Does the clinician
really have the power to control a patient's blood pressure
level if the patient consistently refuses to follow his/her
plan of care?) should be carefully considered when devel-
oping and selecting behaviours and outcomes as indica-
tors of clinician performance for feedback purposes.
Limitations
First, the study's relatively small sample size of six facili-
ties, three in each performance condition, potentially lim-
its the transferability of our results. VA facilities tend to be
highly variable across multiple dimensions, and thus this
study's findings might not apply to other VA facilities, or
to outpatient settings outside the VA. However, two fea-
tures of this research make us guardedly optimistic about
the transferability of the findings. The six sites varied sig-
nificantly by size, geography, facility type (i.e., tertiary vs.
general medicine and surgery), and primary care capabili-
ties; this variation did not significantly differ between HPF
and LPF. The presence of a pattern of feedback character-
istics, despite the variability in site characteristics, sup-
ports the idea that this pattern may be transferable to
other facilities. Additionally, the feedback characteristics
emergent from the data are consistent with existing
research and theory on feedback characteristics, which
suggests that our model could be transferable not only to
other VA clinics, but potentially to other outpatient set-
tings as well.
Second, the density of reports (20 passages per facility) is
somewhat low, which potentially limits the credibility of
the findings. However, participants were not explicitly
interviewed on the subject of performance feedback, but
rather on more general strategies and facilitators of clini-
cal practice guideline implementation. Given the large
domain of other available strategies and facilitators that
participants mentioned[29], the consistency with which
the feedback theme repeats itself across the six facilities
strengthens the credibility of these findings, despite the
low report density.
Finally, although the emergent feedback characteristics
were consistent with previous research, we did not review
or validate our findings with the study participants, as
data collection and analysis did not occur concurrently.
This is an inherent limitation of secondary data analysis
and of our reliance on data collected to gain insight into
the facilities' CPG implementation strategies and barriers
rather than feedback characteristics. Future research
should consider both qualitative and quantitative replica-
tion of the model.
Conclusion and future directions
We conclude that facilities with a record of successful
guideline adherence tend to deliver more timely, individ-
ualized, and non-punitive feedback to providers about
their individual guideline adherence than facilities with a
Implementation Science 2006, 1:9 />Page 8 of 10
(page number not for citation purposes)
Table 3: Interview Guide
CONCEPT TAPPED PRIMARY QUESTION POSSIBLE PROBES
Quality of Care in General 1. How do you or your staff identify quality of care
issues in need of improvement for your
OUTPATIENT primary care clinics?
Probe for explicit processes (e.g., strategic planning, balanced
score cards, data that is monitored, etc.)
a. Who would be responsible for initiating and carrying
out such efforts?
b. Who would be responsible for monitoring such
efforts?
Mental Models of Clinical
Practice Guidelines (CPG)
2. What does the term "Clinical Practice Guidelines"
mean to you?
a. What role do you see for clinical practice guideline use
as a method for improving quality of care?
b. Do you believe clinical practice guidelines are effective
for improving quality of care? Please explain.
If no, follow up with, "Despite your beliefs, what is
your experience?
3. How do guidelines help you improve the quality of
care you provide your patients?
a. As a source of data feedback?
b. How is data collected and utilized in your facility to
improve the quality of patient care (e.g., administrative
"scorekeeping" or as feedback for improving the quality
of care)?
c. Was EPRP data or other data on performance
distributed?
d. Did EPRP results affect individual performance
evaluations?
e. Does the facility collect clinical outcome data
(mortality, readmission, functional status) related to the
guideline?
CPG Success Story 4. Could you tell us the story of a time you and your
team successfully implemented a clinical practice
guideline (e.g., smoking cessation, depression
screening, diabetes mellitus, hypertension, etc.)?
Probe for the Who, What, When, Where, & How of the story.
a. What were the steps?
b. Who was involved? To what extent are clinicians
involved in determining how to implement guidelines?
c. How was this guideline effort brought to the attention
of clinicians and managers in your facility? (e.g., formal
meetings, guideline champions, grand rounds, e-mail
distributions, web sites, etc)?
d. To what extent were committees (one steering
committee for all guidelines or guideline specific
committees) used to implement guidelines?
e. What made it a success?
CPG Training
Development
5. Please describe the training (i.e., professional
development) that clinicians have received for
implementing guidelines.
a. Would clinicians say they have been provided adequate
support for professional development with respect to
CPG implementation?
b. Any training in the use of technology (e.g., CPRS,
clinical reminders, etc.)?
c. CME credit?
Facilitators 6. What are the most important factors that facilitate
guideline implementation?
a. Technology (CPRS, clinical reminders)?
b. Targeted educational or training programs, patient
specific reminder systems, workshops, retreats?
c. Incentives (e.g., monetary, extra time off from work,
gift certificates, etc.)?
d. Mentoring or coaching?
e. Additional resources (e.g., equipment, staff, etc.)?
f. Social Factors such as teamwork or networks?
g. Representation from a diversity of service lines?
h. Presence of a guideline champion?
i. Supportive leadership (i.e., VISN and/or facility)?
j. Pocket cards or "lite" versions of the guidelines?
Barriers 7. What are the most important factors that hinder
guideline implementation?
a. Lack of resources or staff?
¾
Implementation Science 2006, 1:9 />Page 9 of 10
(page number not for citation purposes)
poor record of guideline adherence. Consistent with
organizational research, feedback characteristics may
influence the feedback's effectiveness at changing desired
behaviors. Future research should more fully explore the
nature and effects of feedback characteristics on their
effectiveness in clinical settings, the utility of customizing
clinical audit data so that it is meaningful to individual
providers, and the effects of meaningful feedback on sub-
sequent performance, especially in comparison to or con-
junction with a financial incentive or similar pay-for-
performance arrangement. Meanwhile, administrators
should take steps to improve the timeliness of individual
provider feedback, and deliver feedback from a perspec-
tive of improvement and professional development rather
than one of accountability and punishment for failure.
Abbreviations
CPG – Clinical Practice Guidelines
CPRS – Computerized Patient Records System
EPRP – External Peer Review Program
FIT – Feedback Intervention Theory
HPF – High-Performing Facilities
IQR – Inter-quartile Range
LPF – Low-Performing Facilities
OQP – Office of Quality and Performance
VA – Veterans Affairs
VAMC – Veterans Affairs Medical Center
Competing interests
The research reported here was supported by the Depart-
ment of Veterans Affairs, Veterans Health Administration,
Health Services Research and Development Service
(HSR&D) (CPI #99–129). All three authors' salaries are
supported, in part, by the Department of Veterans Affairs.
The authors declare they have no other competing inter-
ests, financial or non-financial.
Authors' contributions
SH interviewed participants, coded interview transcripts,
and was principally responsible for the research idea,
design, analyses, and drafts of this manuscript. RB was
involved in all aspects of the study, including project man-
agement, participant interviews, coding interview tran-
scripts, and editing of manuscript drafts. JP is the principal
investigator of the grant that funded the work presented in
this manuscript; she was principally responsible for the
research design and project management of the research
grant that made this manuscript possible. She also partic-
ipated in conducting interviews and editing drafts of this
manuscript. All authors read and approved the final man-
uscript.
Appendix: Interview guide and protocol notes
Notes on interview protocol
Interviewers used the guide presented in Table 3 to con-
duct participant interviews, using a semi-structured for-
mat. Interviewers were not required to use the probes
listed; these were provided as aids to facilitate the inter-
viewer's task by illustrating the type of information for
which the interviewers were to probe. Similarly, although
the questions are listed in the suggested order, interview-
ers were free to change the order of the questions to better
fit the flow of the interview.
b. Time (i.e., patient interactions are targeted for 20
minutes)?
c. Lack of training?
d. Not enough support?
e. Financial?
Innovations 8. Were there any changes or redesigns in the clinical
practices or equipment that supported the use of
CPGs.
a. How were forms/procedures or reports changed to
support adherence to guidelines?
b. How were the responsibilities of nurses, aides, other
personnel changed to support adherence?
c. How were resources allocated/reallocated to support
adherence?
Structural, logistic, and
organizational factors
9. Please describe any other conditions that may
influence CPG implementation?
a. Size of the facility?
b. Academic affiliation?
c. Competition with other QI initiatives?
d. Location (e.g., remote vs. main facility)?
Table 3: Interview Guide (Continued)
Implementation Science 2006, 1:9 />Page 10 of 10
(page number not for citation purposes)
Interviews were scheduled to be one hour in length, with
one half-hour between interviews for interviewers to com-
pile notes on the completed interview and conduct
administrative tasks (e.g., labeling the interviews on the
memory card, recording interviewee information in a par-
ticipant record). In some cases, the interviews went some-
what over the one-hour mark, but never more than
approximately 10 minutes. In a very few instances, the
participants' comments were concise enough that the
interview ended before the one-hour mark. However,
most interviews lasted approximately one hour.
Acknowledgements
The research reported here was supported by the Department of Veterans
Affairs, Veterans Health Administration, Health Services Research and
Development Service (VA HSR&D) (CPI #99–129). Dr. Hysong is a health
services researcher at the Houston Center for Quality of Care and Utiliza-
tion Studies, a VA HSR&D Center of Excellence, and she is an Instructor of
Medicine at Baylor College of Medicine in Houston. This research was con-
ducted during her tenure at the Veterans Evidence-Based Research Dis-
semination and Implementation Center (VERDICT), a VA HSR&D
Research Enhancement Award Program. Dr. Best is a Senior Healthcare
Consultant at Lockheed Martin Information Systems; this research was
conducted during his tenure at VERDICT. Dr. Pugh is the director of VER-
DICT, a Professor of Internal Medicine at the University of Texas Health
Science Center at San Antonio, TX, and a staff physician at the South Texas
Veterans Health Care System, where VERDICT is housed. All three
authors' salaries were supported, in part, by the Department of Veterans
Affairs. The views expressed in this article are solely those of the authors
and do not necessarily reflect the position or policy of the Department of
Veterans Affairs, Baylor College of Medicine, Lockheed Corporation, or
the University of Texas.
References
1. Harvey PA, Murphy MC, Dornom E, Berlowitz DJ, Lim WK, Jackson
B: Implementing evidence-based guidelines:inpatient man-
agement of chronic obstructive pulmonary disease. Internal
medicine journal 2005, 35:151-155.
2. Baker R, Falconer Smith J, Lambert PC: Randomised controlled
trial of the effectiveness of feedback in improving test order-
ing in general practice. Scandinavian Journal of Primary Health Care
2003, 21:219-223.
3. Eccles M, Steen N, Grimshaw J, Thomas L, McNamee P, Soutter J,
Wilsdon J, Matowe L, Needham G, Gilbert F, Bond S: Effect of audit
and feedback, and reminder messages on primary-care radi-
ology referrals: a randomised trial. Lancet 2001, 357:1406-1409.
4. Goff DC Jr, Massing MW, Bertoni AG, Davis J, Ambrosius WT, McAr-
dle J, Duren-Winfield V, Sueta CA, Croft JB: Enhancing quality of
heart failure care in managed Medicare and Medicaid in
North Carolina: results of the North Carolina Achieving
Cardiac Excellence (NC ACE) Project. American Heart Journal
2005, 150:717-724.
5. Grimshaw JM, Thomas RE, MacLennan G, Fraser C, Ramsay CR, Vale
L, Whitty P, Eccles MP, Matowe L, Shirran L, Wensing M, Dijkstra R,
Donaldson C: Effectiveness and efficiency of guideline dissem-
ination and implementation strategies. Health Technology
Assessment (Winchester, England) 2004, 8:iii-iiv.
6. Jamtvedt G, Young JM, Kristoffersen DT, Thomson O'Brien MA,
Oxman AD: Audit and feedback: effects on professional prac-
tice and health care outcomes. Cochrane Database Syst Rev 2003.
7. Bordley WC, Chelminski A, Margolis PA, Kraus R, Szilagyi PG, Vann
JJ: The effect of audit and feedback on immunization delivery:
a systematic review. American Journal of Preventive Medicine 2000,
18:343.
8. Foy R, Eccles MP, Jamtvedt G, Young J, Grimshaw JM, Baker R: What
do we know about how to do audit and feedback? Pitfalls in
applying evidence from a systematic review. BMC health serv-
ices research 2005, 5:50.
9. Jamtvedt G, Young JM, Kristoffersen DT, O'Brien MA, Oxman AD:
Audit and feedback versus alternative strategies: effects on
professional practice and health care outcomes. Cochrane
Database Syst Rev 2006:CD000259.
10. Robinson MB: Evaluation of medical audit. J Epidemiol Community
Health 1994, 48:435-440.
11. Stull MK: Performance feedback: a question of source credi-
bility. The Journal of nursing administration 1986, 16:17.
12. Exworthy M, Wilkinson EK, McColl A, Moore M, Roderick P, Smith
H, Gabbay J: The role of performance indicators in changing
the autonomy of the general practice profession in the UK.
Soc sci med 2003, 56:1493-504.
13. Bradley EH, Holmboe ES, Mattera JA, Roumanis SA, Radford MJ,
Krumholz HM: Data feedback efforts in quality improvement:
lessons learned from US hospitals. Quality & Safety in Health Care
2004, 13:26-31.
14. Vancouver JB, Tischner EC: The Effect of Feedback Sign on Task
Performance Depends on Self-Concept Discrepancies. Jour-
nal of Applied Psychology 2004, 89:1092-1098.
15. Kluger AN, DeNisi A: The effects of feedback interventions on
performance: A historical review, a meta-analysis, and a pre-
liminary feedback intervention theory. Psychological Bulletin
1996, 119:254-284.
16. Hysong S, Best R, Pugh J, Moore F: Not of One Mind: Mental Mod-
els of Clinical Practice Guidelines in the VA. Health Serv Res
2005, 40:829-847.
17. Pugh JA: Knowledge management and clinical practice guideline implemen-
tation. [Final Report]. CPI 99129-1 San Antonio, TX, Veterans Evidence-
Based Implementation Dissemination Center; 2001.
18. Strauss AL, Corbin J: Basics of qualitative research : techniques and pro-
cedures for developing grounded theory 2nd edition. Thousand Oaks,
CA: Sage Publications; 1998.
19. Glaser BG, Strauss AL: The Discovery of Grounded Theory Chicago:
Aldine Publishing Co; 1967.
20. Muhr T: Atlas. ti – Short User's Manual. [4.2 Build 061] Berlin, Germany,
Scientific Software Development; 2001.
21. Deshon RP, Kozlowski SWJ, Schmidt AM, Milner KR, Wiechmann D:
A multiple-goal, multilevel model of feedback effects on the
regulation of individual and team performance. Journal of
Applied Psychology 2004, 89:1035-1056.
22. Archer-Kath J, Johnson DW, Johnson RJ: Individual Versus Group
Feedback in Cooperative Groups. Journal of Social Psychology
1994, 134:681-694.
23. Hauenstein NMA: Training Raters to Increase the Accuracy of
Appraisals and the Usefulness of Feedback. In Performance
Appraisal: State of the Art in Practice Edited by: Smither J. San Francisco:
JOSSEY-BASS; 1998.
24. Nease AA, Mudgett B, Quinones MA: Relationships among feed-
back sign, self-efficacy, and acceptance of performance feed-
back. Journal of Applied Psychology 1999, 84:806-814.
25. Leung K, Su S, Morris MW: When is criticism not constructive?
The roles of fairness perceptions and dispositional attribu-
tions in employee acceptance of critical supervisory feed-
back. Hum Relat 2001, 54:1155-1187.
26. Kinicki AJ, Prussia GE, Wu B, Kee-Ryan FM: A covariance struc-
ture analysis of employees' response to performance feed-
back. Journal of Applied Psychology 2004, 89:1057-1069.
27. Lyons SS, Tripp-Reimer T, Sorofman BA, Dewitt JE, BootsMiller BJ,
Vaughn TE, Doebbeling BN: VA QUERI Informatics Paper:
Informatics technology for clinical guideline implementa-
tion: Perceptions of multiple stakeholders. J Am Med Inform
Assoc 2005, 12:64-71.
28. VHA 2005 eHealth University: Veterans Health Administration.
2005 [ />]. 6-20-
2005. 1-4-2006.
29. Hysong SJ, Pugh JA, Best RG: Clinical Practice Guideline Imple-
mentation Patterns In VHA Outpatient Clinics. Health Services
Research 2006 in press.