báo cáo khoa học: " A pragmatic cluster randomised controlled trial of a Diabetes REcall And Management system: the DREAM trial" docx
Bạn đang xem bản rút gọn của tài liệu. Xem và tải ngay bản đầy đủ của tài liệu tại đây (285.9 KB, 12 trang )
BioMed Central
Page 1 of 12
(page number not for citation purposes)
Implementation Science
Open Access
Research article
A pragmatic cluster randomised controlled trial of a Diabetes
REcall And Management system: the DREAM trial
Martin P Eccles
1
, PaulaMWhitty*
1
, Chris Speed
1
, Ian N Steen
1
,
Alessandra Vanoli
1
, Gillian C Hawthorne
2
, Jeremy M Grimshaw
3
,
Linda J Wood
4
and David McDowell
5
Address:
1
Centre for Health Services Research, University of Newcastle, Newcastle upon Tyne, UK,
2
Diabetes Centre, Newcastle Primary Care Trust,
Newcastle upon Tyne, UK,
3
Clinical Epidemiology Program, Ottawa Health Research Institute, and Department of Medicine, University of Ottawa,
Ottawa, Canada,
4
Northern and Yorkshire Regional Office, Diabetes UK, Darlington, UK and
5
c/o ProWellness UK Ltd, Centre 500, 500 Chiswick
High Road, London W4 5RG, UK
Email: Martin P Eccles - ; Paula M Whitty* - ; Chris Speed - ;
Ian N Steen - ; Alessandra Vanoli - ; Gillian C Hawthorne - gillian.hawthorne@newcastle-
pct.nhs.uk; Jeremy M Grimshaw - ; Linda J Wood - ;
David McDowell -
* Corresponding author
Abstract
Background: Following the introduction of a computerised diabetes register in part of the northeast of England, care
initially improved but then plateaued. We therefore enhanced the existing diabetes register to address these problems.
The aim of the trial was to evaluate the effectiveness and efficiency of an area wide 'extended,' computerised diabetes
register incorporating a full structured recall and management system, including individualised patient management prompts
to primary care clinicians based on locally-adapted, evidence-based guidelines.
Methods: The study design was a pragmatic, cluster randomised controlled trial, with the general practice as the unit of
randomisation. Set in 58 general practices in three Primary Care Trusts in the northeast of England, the study outcomes
were the clinical process and outcome variables held on the diabetes register, patient-reported outcomes, and service and
patient costs. The effect of the intervention was estimated using generalised linear models with an appropriate error
structure. To allow for the clustering of patients within practices, population averaged models were estimated using
generalized estimating equations.
Results: Patients in intervention practices were more likely to have at least one diabetes appointment recorded (OR 2.00,
95% CI 1.02, 3.91), to have a recording of a foot check (OR 1.87, 95% CI 1.09, 3.21), have a recording of receiving dietary
advice (OR 2.77, 95% CI 1.22, 6.29), and have a recording of blood pressure (BP) (OR 2.14, 95% CI 1.06, 4.36). There was
no difference in mean HbA1c or BP levels, but the mean cholesterol level in patients from intervention practices was
significantly lower (-0.15 mmol/l, 95% CI -0.25, -0.06). There were no differences in patient-reported outcomes or in
patient-reported use of drugs, or uptake of health services. The average cost per patient was not significantly different
between the intervention and control groups. Costs incurred in administering the system at the register and in general
practice were in addition to these.
Conclusion: This study has shown benefits from an area-wide, computerised diabetes register incorporating a full
structured recall and individualised patient management system. However, these benefits were achieved at a cost. In future,
these costs may fall as electronic data exchange becomes a reliable reality.
Trial registration: International Standard Randomised Controlled Trial Number (ISRCTN) Register, ISRCTN32042030.
Published: 16 February 2007
Implementation Science 2007, 2:6 doi:10.1186/1748-5908-2-6
Received: 18 May 2006
Accepted: 16 February 2007
This article is available from: />© 2007 Eccles et al; licensee BioMed Central Ltd.
This is an Open Access article distributed under the terms of the Creative Commons Attribution License ( />),
which permits unrestricted use, distribution, and reproduction in any medium, provided the original work is properly cited.
Implementation Science 2007, 2:6 />Page 2 of 12
(page number not for citation purposes)
Background
There is broad, international agreement over what consti-
tutes high-quality health care for people with diabetes
[1,2]. In the United Kingdom (UK), this has been cap-
tured in a National Service Framework for people with
diabetes [3]. At the time of setting up the Diabetes REcall
And Management system (DREAM) trial, computerised
central recall systems for patients and their family doctors
had been supported by the evidence from a 1999 system-
atic review [4]. However, the evidence base on which
these conclusions were based was limited to that from
patient- rather than practice-randomised trials, in selected
practice samples, and without economic evaluation. Thus
the effectiveness of an area-wide, patient-focussed, struc-
tured recall and management system (in terms of process
of care, patient outcome, and economic impact) remained
unknown. A recent systematic review of quality improve-
ment interventions to improve the quality of care in
patients with diabetes showed that a range of different
interventions resulted in small to modest improvements
in glycemic control and in provider adherence to optimal
care [5]. Across 59 studies (only five from the UK), they
reported a median absolute reduction in serum HbA
1c
of
0.48 and a median absolute increase in provider adher-
ence of 4.9%. However, they also identified important
methodological concerns, with larger studies and ran-
domised studies showing smaller benefits than smaller or
non-randomised ones, which strongly suggest the pres-
ence of publication bias. Studies in the highest quartile of
sample size reported a median reduction in serum HbA
1c
of only 0.10%.
Within their taxonomy of interventions the categories of
"provider reminders" and "audit and feedback" most
closely approximate to the intervention in this study.
Across 14 trials examining one or both of these interven-
tions, they found median improvements in provider
adherence of between 4% and 8%, and improvements in
HbA1c of around 0.1%[5]. They also examined 38 com-
parisons involving some form of clinical information sys-
tem to deliver the intervention, finding no incremental
benefit for any particular informatics function (i.e., deci-
sion support, auditing clinical performance, reminder sys-
tems), over and above delivering the function without an
informatics system.
Following the introduction of a computerised diabetes
management system in three (then) Primary Care Group
areas, in the northeast of England, care initially improved
but then plateaued, a phenomenon also reported by oth-
ers [6,7]. At the point this assessment of care was per-
formed, the measures of care were restricted to
documenting the performance of various actions (e.g.
measurement of BP) rather than documenting the values.
We postulated that the platueauing was due to clinicians
failing to deliver appropriate clinical interventions due to
a lack of coordination (i.e., patients being lost to follow-
up), and either a lack of awareness of appropriate care or
forgetting to deliver all that was required when patients
were seen. Therefore, we developed the diabetes register
system to address these problems.
This study aimed to evaluate, within a pragmatic, cluster
randomised controlled trial design, the effectiveness and
efficiency of an area-wide, 'extended' computerised diabe-
tes register incorporating a full-structured recall and man-
agement system, actively involving patients, and
including individualised patient-management prompts to
primary care clinicians based on locally-adapted, evi-
dence-based guidelines.
Methods
The study methods described here are reported in detail
elsewhere [8].
Study general practices and registers
The study general practices were those in three Primary
Care Trusts (PCTs) served by two district hospital-based
diabetes registers, both using the same register software.
When the study was designed, it was based in three PCTs
(all agreed to participate in the study) served by a single
register. However, the withdrawal of one of these PCTs
necessitated the recruitment of a replacement PCT served
by a second register. Several factors led to the withdrawal
of this PCT. Despite our having appropriate administra-
tive approval, when the trial began it became apparent
that the administrative authority did not have the cooper-
ation necessary for all of the GPs to participate in the trial.
Consequently we had to enrol individual practices
directly (rather than via the PCT), which resulted in fewer
practices enrolling and our being at risk of not achieving
our required sample size. We recruited a further PCT to
address this problem, however, the original PCT then sus-
pended involvement with the diabetes register and their
practices had to be excluded from the study. This was a
deviation from the published protocol.
Study patients
Study patients were those people with type 2 diabetes
appearing on the registers, aged over 35 years and receiv-
ing diabetes care exclusively from study general practices
or shared between study general practices (GPs) and hos-
pital. At the time of the study, approximately 20% of
patients received both GP and specialist care, though there
was no formal shared-care scheme in operation in the
PCTs studied.
Study design, outcomes and power
The study was a pragmatic two-arm cluster randomised
controlled trial with the general practice as the unit of ran-
Implementation Science 2007, 2:6 />Page 3 of 12
(page number not for citation purposes)
domisation. Randomisation was performed using elec-
tronically-generated random numbers by the study
statistician and was stratified by PCT and practice size.
The study outcomes were: the clinical process and out-
come variables held on the diabetes registers; patient
reported outcomes (the SF36 health status profile [9-11],
the Newcastle Diabetes Symptoms Questionnaire [12],
and the Diabetes Clinic Satisfaction Questionnaire [13]);
and service and patient costs. Patients have been shown to
be able to report cost data reliably [14].
As this was a quality of care study interested in a range of
measures of care, it was important to use as study out-
comes the routinely available process and outcome meas-
ures on which clinicians alter patients' care. Our power
calculation was based on indicative process and outcome
variables. The intra-cluster correlation coefficient (ICC)
for measures of process calculated from local data was
0.14, whether a blood pressure measurement or an HbA1c
measurement has been recorded in a 12-month period.
Therefore, to detect a difference of 15% (42.5% v 57.5%)
in a binary variable with 80% power, assuming a signifi-
cance level of 5%, required 60 practices each contributing
30 patients [15]. The sample size for the outcome of care
variables was based on the SF-36. Previous work had
shown that where this type of intervention produces an
effect, it was likely to produce an effect size of approxi-
mately 0.25 in such measures [16] – and that the ICCs for
such measures would be approximately 0.07 [17]. A final
sample of 27 patients from each of 61 practices would
give 85% power to detect an effect size of 0.25, assuming
a significance level of 5%. Assuming a response rate of
70%, the starting sample size was 2379 patients (approx-
imately 39 patients per practice).
Data collection
We collected process data for the 12 months preceding the
start of the intervention and for the 15 months of the
intervention period (1
st
April 2002 to 30
th
June 2003). All
data were extracted from the registers at the end of the
intervention period. Prescription data were similarly col-
lected, but, because of problems reliably determining the
date of initiation of prescriptions, we collected drug data
back to the point at which a study patient first appeared
on the register. We gathered data on patient reported out-
comes by postal questionnaire at the end of the interven-
tion period. Questions on the costs incurred by patients
were developed by the study health economist and were
included in the questionnaire. These questions included
the self-reported use of medication. Non-responders to
the initial posting received a reminder letter after two
weeks; non-responders to this received a second reminder
letter and a copy of the questionnaire after a further two
weeks.
We gathered information on workload and other resource
impacts of the intervention in general practice, with a
semi-structured telephone interview survey of key inform-
ants within a random sample of 10 intervention and 12
control practices. Similar information on the impact on
the registers was collected by the register staff, logging
time spent on intervention-related activities.
Analysis
The following analytic strategies were adopted. For the
process of care and intermediate outcome variables col-
lected directly from the register, the dependent variable
took the form of an observation for an individual patient
in the period after implementation of the intervention.
We had data on these variables both before and after the
intervention, and, for each variable considered, the post
intervention measure was specified as the dependent var-
iable and the corresponding pre-intervention measure
was specified as a covariate. The effect of the intervention
was estimated using generalised linear models with an
appropriate error structure (binomial for binary data, nor-
mal for continuous data, and negative binomial for count
data) and link function (logit for binary data, identity for
continuous data, and log for count data). To allow for the
clustering of patients within practices, population aver-
aged models were estimated using generalized estimating
equations (GEEs). Baseline variables (pre-intervention
data) were included in the model as a covariate.
Examination of the drug therapy data suggested that the
variable that was recorded most reliably on the register
was the date that the medication was started. In general,
patients who started on a particular medication prior to
the intervention period also were taking that medication
during the intervention period. For each type of medica-
tion, the total number of patients prescribed that medica-
tion in each practice was determined. This variable was
analysed using negative binomial regression with the total
number of relevant patients in the practice included as an
exposure variable; the number of patients prescribed that
medication prior to the intervention was included as a
covariate.
Questionnaire data were only available following the
intervention. Patient-reported outcome measures were
analysed using population averaged models as described
for the process data above, except that, as we had no pre-
intervention measure, no adjustment for differences at
baseline was possible, thus no baseline covariate was
included in the model. Patient reported medication data
were analysed for the register medication data, except that,
again, there were no baseline data to include as a covari-
ate.
Implementation Science 2007, 2:6 />Page 4 of 12
(page number not for citation purposes)
In addition to the above analyses that were pre-specified,
because of large systematic differences between the two
registers that became apparent once the data had been col-
lected, a further model was fitted which included a register
effect. This was not pre-specified, but the differences were
so large it was felt that it would be inappropriate to ignore
them during the main analysis. All analyses were under-
taken using Stata version 8.
The economic evaluation adopted a 'cost consequences'
approach [18]. All costs were expressed in 2002/2003 val-
ues. Two main sources were used to assign costs to health
care resources [19,20] supplemented when necessary with
unit cost data from other official sources [21] and local
surveys. Drug costs were taken from the British National
Formulary [22]. Patients reported on the use of NHS
(National Health Service) services, medications, travel
costs, costs for the purchase of special items, private treat-
ments/consultations and time off work, sick leave and
related pay loss, as well as time off work and related pay
loss to their companions over a twelve-month period. No
discounting was applicable. A simplifying assumption
was made that the use of all costs and resources occurred
at the beginning of this period.
Intervention
The development and implementation of the intervention
have been described in detail elsewhere [23]. In summary
the pre-existing diabetes register functioned as a central
register of patients with diabetes. A structured dataset was
completed on paper forms and returned to the central reg-
ister; the hospital laboratory provided a monthly down-
load of laboratory test results (e.g. HbA1c) for patients on
the register. From this data both patient-specific and
aggregated data were provided annually to patients and
clinicians. The pre-existing system was passive, in that it
did not request data for patients, rather it summarised the
data it received. We postulated that the platueauing of per-
formance that had been documented was due to clinicians
failing to deliver appropriate clinical interventions due to
a lack of co-ordination (patients being lost to follow up)
and either a lack of awareness of appropriate care, or for-
getting to deliver all that was required when patients were
seen.
In the enhanced structured and recall management sys-
tem, a 'circle of information exchange' was established
between the participating general practices and the data-
base. The central database system identified when patients
were due for review and generated a letter to the patients
asking them to make an appointment for a review consul-
tation. The rules for generation of review letters were
adapted for each PCT area. In one PCT, the system acted
as a prompting system for annual review, and patients
were identified 11 months after their last diabetes
appointment. In the other two PCTs, patients who had
missed annual reviews were identified by searching for
patients who had not had a diabetes appointment for 14
months or more. At the same time, the central database
generated a letter to the practice stating that the patient
should be making a review appointment in the near
future. The letter to the practice included a 'structured
management sheet' (to be held in the patient's record) to
capture an agreed minimum data set that would be col-
lected during the consultation. This management sheet
also contained relevant prompts tailored to a patient's
known clinical or biochemical values, derived from
locally adapted, national evidence-based guidelines [see
Additional file 1].
When the patient was seen in the practice, the primary
care professional (often the practice nurse) completed the
management sheet and returned a copy for entry into the
central register within a designated period of time. This
circle of information was broken if the patient did not
visit the general practice as planned or the general practice
did not return the management sheet to the central regis-
ter. If this happened, the central register would print
reminder letters and further structured management
sheets at the next routine database search by the diabetes
register facilitator, which occurred at least weekly.
In addition to this cycle based on annual reviews, routine
ongoing structured management sheets were produced
every time a patient in an intervention practice was iden-
tified by the diabetes register facilitator on the register
database. For example, when data were inputted on the
database for any reason, the system would print a struc-
tured management sheet updated for any new data and
relevant management prompts, and this would be sent to
the relevant practice.
The trial intervention ran for 15 months, commencing on
1 April 2002 and ending on 30 June 2003. The letters to
patients inviting them for annual review commenced in
October 2002 – delayed to overcome concerns about the
accuracy of patient details on the database up to this
point. The enhanced system also was capable of produc-
ing patient letters to accompany routine ongoing struc-
tured management sheets for practices, but because of
difficulties operating this element of the software it was
not possible to run this feature during the lifetime of the
trial. This was a deviation from the published protocol.
Ethics
The study was approved by the South Tyneside, Southwest
Durham, Hartlepool, and North Tees Local Research Eth-
ics Committees (LRECs).
Implementation Science 2007, 2:6 />Page 5 of 12
(page number not for citation purposes)
Results
Figure 1 shows the number of practices and patients at
each stage of the study. It was not possible to provide the
number of patients within the 90 practices assessed for eli-
gibility, as we did not have ethical approval to access data
on the patient inclusion criteria for practices that had not
agreed to participate in the study. As a condition of ethical
approval in one of the PCTs, individual opt-out consent
had to be sought from patients whose practices had agreed
to participate: 477 out of 4577 (10.4%) patients invited to
participate opted out of the trial. [The considerably higher
number of patients written to as compared to the number
of patients included in the trial reflected the need to get
permission before being able to access the diabetes regis-
ter – and then apply the inclusion criteria.] Table 1 shows
the baseline characteristics of control and intervention
practices and patients. None of the differences in these
variables between the intervention and control group are
statistically significant. Unfortunately, we were unable to
compare the clinical characteristics of respondents and
non-respondents to the patient survey, as we were subject
to the requirement of the ethics/research governance
organisations that we should not hold any patient-identi-
fiable data within our academic institution. We were sup-
plied with a list of names and addresses of patients to
whom we could send out a patient survey, but were not
allowed access to link that information with individual
patient records on the registers.
The findings from analysis of the process of care clinical
variables and drug data from the register-derived dataset
are shown in Table 2. This analysis is adjusted for differ-
ences at baseline and a systematic difference between reg-
isters. Analyses allowing for baseline data only and register
effect only are presented alongside this analysis in Addi-
tional file 2 [see Additional file 2]. Nineteen subjects (7 in
control group, 12 in intervention group) had no valid
date in their medication record and were excluded from
the medication analysis. With the exception of serum cre-
atinine, a variable that we anticipated that the interven-
tion would not influence, all of the variables measured
showed a direction of effect in favour of the intervention.
For 10 of the 26 variables measured, this difference
achieved statistical significance.
Patient reported outcome data
We surveyed a random sample of 3056 patients, receiving
usable responses from 1433. With 241 exclusions, this
gave an overall response rate of 51% (number of eligible
subjects who responded divided by the number of people
sampled, minus those known to be ineligible) (Figure 1).
There were no statistically significant differences in
response rate between intervention and control group
respondents, or on any sociodemographic variables. Anal-
yses of the patient-reported medication data are summa-
rised in Table 3. The differences between intervention and
control groups were not statistically significant. There
were no differences between the two registers, so the
adjusted values differ little from the unadjusted ones. The
patient-reported outcome data from the questionnaire
survey are summarised in Table 4. The ICC for the diabe-
tes symptom score was 0.03, and the ICCs for the SF 36
physical and mental health component scores were 0.03
and 0.02, respectively. There were no statistically signifi-
cant differences in scores on any of the measures in Table
4, or on any of the items of the DCSQ.
Economic data
The economic data relating to service use and patient
expenditure are summarised in Table 5, and were not sig-
nificantly different between intervention and control
groups. The intervention costs were: UK£11,443 for devel-
oping the local guidelines, UK£14,034 for software devel-
opment, and UK£2,408 for educational activities. This
gave a total one-off cost of initiating the system across the
two register areas of UK£27,885. The additional annual
cost of running the system for the two registers was
UK£11,170. Based on the interviews with practice-based
informants, the mean maximum annual cost per patient
that the practices had to meet when using the system
(including staff time and consumables) was estimated at
£76.46 per patient; the minimum annual costs were zero.
However, because of the semi-structured nature of the
interviews, it was not possible to accurately estimate the
distribution of costs within this range.
Discussion
We have evaluated an area-wide computerised diabetes
register incorporating a full structured recall and individ-
ualised patient management system – one of the largest
trials of its kind in terms of the number of provider units,
and the largest in terms of patient numbers. The interven-
tion produced improvements in patient attendance,
improvement in four of the nine measured areas of pro-
vider adherence to recommended care (the recording of
foot examination, dietary advice, blood pressure, and
smoking status), and improvement in one measure of
clinical control (serum cholesterol). These benefits
incurred costs.
Although we showed significant improvements in the
recording of drugs in the database, there were problems
with the dating of the drug data. The patient reported data
on drug use showed no significant differences in usage
between the two groups. Given this discrepancy and the
potential for inaccuracy in both data sets, the impact of
the intervention on prescribing has to be regarded as
unclear.
Implementation Science 2007, 2:6 />Page 6 of 12
(page number not for citation purposes)
In our study which utilised provider reminders and audit
and feedback within an information system, we found
changes in provider adherence that were considerably
larger than those identified in the review by Shojania et
al., and four of our nine were statistically significant
improvements [5]. However, because our data was com-
ing from a routine register it is important to consider the
possibility that, for the provider adherence variables,
some of the effect was due to a recording phenomenon,
and the same actions were being performed as frequently
in control practices but were just not being recorded. Set-
ting aside the fact that the recording of care, particularly in
chronic disease management, is a central part of good care
[24], all of the provider adherence and all of the clinical
variables showed a direction of effect in favour of the
intervention. In addition, four of the provider adherence
variables (recording of HbA1c, cholesterol, serum creati-
nine, and urinary albumin:creatinine ratio) were not reli-
ant on recording within general practices; they were
routinely transferred into the diabetes databases directly
from the laboratory information systems, and so would
not be subject to any recording effect. Whilst these were
not statistically significantly different between interven-
tion and control groups, many clinicians would regard
changes of this size as clinically significant (16% increase
in HbA1c recording and 21% increase in cholesterol
recording).
There is some suggestion of under-recording of data on
the registers, with an apparently low proportion of people
on aspirin and insulin (mirrored by an apparently high
proportion of people on diet alone). This is almost cer-
tainly due to a combination of factors of which a degree
of under-recording is only one. Low aspirin prescription
rates could be due to patients buying aspirin directly from
pharmacies rather than receiving it via prescription (com-
mon in the UK). This is supported by the figures for self-
reported aspirin use being higher than those on the regis-
ters. Excluded from the study were people being treated
for their diabetes solely by hospital, who are more likely
to be treated on insulin and less likely to be on diet alone.
However, while we have the same rates for patients treated
with diet alone from the register and from self-report, self-
report of insulin use was considerably higher than on the
registers. This suggests that insulin use was under-
recorded on the registers, but equally so for both interven-
tion and control groups.
Unlike the studies in the review, we found no significant
effect on levels of HbA1c. This may reflect the overall lev-
els of control in our study population with baseline
HbA1c of 7.7, and both groups improving to 7.3. The
studies in the review were conducted in more poorly con-
trolled populations, with median baseline HbA1c values
of over 8 (and in one case over 10). Our findings also may
reflect the relatively short period for which the interven-
tion ran as fully intended. While the intervention was in
place for the planned 15 months, the full intervention ran
for only 9 months, and the intended patient intervention
was never fully operational.
We did, however, show a modest and statistically signifi-
cant lowering of serum cholesterol of 0.15 mmol/l in the
intervention group compared to the control group. As the
impact of the intervention on medication, including lipid-
lowering therapy, was unclear from the register-derived
data and negative from the patient-reported data, it is pos-
sible that this effect may be due to the increased delivery
Table 1: Baseline characteristics of control and intervention practices and patients.
Control group (n 28) Intervention group (n 30)
Practice factors at baseline
Number of partners:
Single-handed 910
2 to 4 partners 15 16
5 to 7 partners 42
>7 partners 02
Number of practices with a Practice nurse 28 30
Patient factors at baseline*
Number 1934 1674
Mean (sd) age (years) 66.6 (11.3) 65.7 (11.8)
No (%) men 1001 (52%) 901 (54%)
No (%) on diet only 947 (49.1%) 980 (59.0%)
No (%) on oral hypoglycaemics (sulphonylureas, biguanides, thiazols) but not on insulin 923 (47.9%) 628 (37.8%)
No (%) on insulin 57 (3.0%) 54 (3.2%)
* Data from Diabetes Register. (No data were available from the diabetes register on ethnicity, however, the proportion of people from ethnic
minority groups in the study PCTs is very low.
21
)
Implementation Science 2007, 2:6 />Page 7 of 12
(page number not for citation purposes)
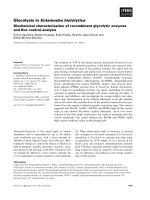
Flow of clusters and individual participants through each stage of recruitment, randomisation and analysisFigure 1
Flow of clusters and individual participants through each stage of recruitment, randomisation and analysis.
A
ssessed for eli
g
ibilit
y
: 90
p
ractices
Randomised: 58 practices
(
3608 patients; mean = 62.2 patients per cluster
)
Excluded: 32 practices:
Refused to participate: 25
PCT withdrew from register: 7
Allocated to intervention: 30 practices
Received intervention: 30 practices
(1674 patients; mean = 55.8 patients per
cluste
r
)
Allocated to control: 28 practices
Received control: 28 practices
(1934 patients; mean = 69.1 patients per
cluster
)
Lost to follow u
p
: 0
p
ractices Lost to follow u
p
: 0
p
ractices
Analysed: 30 practices (1674 patients;
mean = 55.8 patients per cluster)
Analysed: 28 practices (1934 patients;
mean = 69.1 patients per cluster)
Participated in questionnaire survey:
29 practices (1537 patients [53.0
patients per cluster] surveyed; 813
[28.0 patients per cluster] returned)
Participated in questionnaire survey:
28 practices (1519 patients [54.3
patients per cluster] surveyed; 861
[30.8 patients per cluster] returned)
1 practice
withdrew
from
survey on
grounds of
workload
713 patients [24.6 patients per
cluster] included in questionnaire
survey analysis
720 patients [25.7 patients per
cluster] included in questionnaire
survey analysis
241 (I:100, C:
141) patients
excluded: 137
hospital care
only (I:64, C:73);
57 < 35 years
old (I:31, C:26);
2 type 1
diabetes (C:2);
45 IGT or not
diabetic (I:5,
C:40)
Implementation Science 2007, 2:6 />Page 8 of 12
(page number not for citation purposes)
Table 2: Adjusted register-derived process and clinical outcome data results for intervention and control groups. Odds ratios are
estimates of the difference between intervention and control practices at follow-up, adjusting for differences at baseline and a
systematic difference between registers.
Control Practices Intervention Practices
Measures Baseline Follow-up Baseline Follow-up
Attendance Odds Ratio (95% CI)
Proportion of patients with at least one appointment 73.4% 67.7% 74.3% 81.7% 2.00* (1.02, 3.91)
Mean number of appointments 1.23 1.35 1.29 2.02 Relative Risk 1.26 (0.87, 1.81)
Process of care
Fundoscopy recorded 49.5% 50.5% 43.1% 60.6% 1.45 (0.88, 2.40)
Feet examination recorded 46.1% 48.8% 48.0% 67.3% 1.87*(1.09, 3.21)
Dietary advice recorded 19.9% 29.2% 25.3% 46.3% 2.77*(1.22, 6.29)
Smoking status recorded 34.2% 48.0% 36.9% 66.0% 2.43*(1.18, 5.00)
Was subject a smoker? 19.3% 19.6% 20.7% 21.4% 0.72 (0.38, 1.37)
BP recorded 59.3% 48.3% 55.3% 71.4% 2.14*(1.06, 4.36)
HbA1c recorded 64.0% 66.0% 60.9% 79.0% 1.58 (0.81, 3.08)
Cholesterol recorded 57.0% 61.1% 53.3% 78.0% 1.66 (0.89, 3.12)
Creatinine recorded 48.0% 60.4% 53.0% 73.4% 1.36 (0.72, 2.52)
Albumin:creatinine ratio recorded 26.8% 29.7% 30.2% 40.4% 1.60(0.98, 2.60)
Clinical Difference
Mean most recent systolic blood pressure 144.5 144.6 145.8 144.2 -1.56 (-4.54, 1.42)
Mean most recent diastolic blood pressure 80.2 78.1 79.2 77.8 -0.40 (-1.78, 0.97)
Mean most recent HbA1c
#
7.56 7.35 7.75 7.32 -0.04 (-0.18, 0.10)
Mean most recent cholesterol
#
5.27 5.06 5.23 4.94 -0.15**(-0.25, -0.06)
Mean most recent creatinine
#
93.1 96.1 91.8 95.7 0.21 (-1.27, 1.70)
Mean most recent albumin:creatinine ratio
#
8.99 8.45 8.48 8.05 -1.6 (-4.4, 1.2)
Diabetes medication Relative risk (95% CI)
Biguanide, Sulphonylurea or Thiazol 944 (49.0%) 1128 (58.5%) 646 (38.9%) 923 (55.5%) 1.06 (0.94, 1.19)
Metformin 424 (22.0%) 573 (29.7%)) 343 (20.6% 530 (31.9) 1.07 (0.81, 1.41)
Insulin 57 (3.0%) 75 (3.9%) 54 (3.2%) 75 (4.5%) 1.15 (0.83, 1.58)
Cardiovascular risk factor drugs
Aspirin 10 (0.5%) 164 (8.5%) 34 (2.0%) 308 (18.5%) 2.08* (1.00, 4.32)
Ace Inhibitor 17 (0.9%) 103 (5.3%) 31 (1.9%) 185 (11.1%) 2.03* (1.08, 3.78)
ACE inhibitor or Angiotensin-II receptor antagonist 21 (1.1%) 109 (5.7%) 38 (2.3%) 192 (11.6%) 1.86* (1.03, 3.38)
Any antihypertensive 118 (6.1%) 274 (14.2%) 131 (7.9%) 415 (25.0%) 1.89*(1.16, 3.08)
Lipid-lowering 110 (5.7%) 290 (15.0%) 79 (4.8%) 418 (25.2%) 1.66 (0.99, 2.79)
Any medication 1674 (86.9%) 1838 (95.4%) 1283 (77.2%) 1549 (93.2%) 1.01 (0.94, 1.08)
*p < 0.05, **p < 0.01, *** p < 0.001
# Data downloaded into register database directly from hospital laboratory information system.
Implementation Science 2007, 2:6 />Page 9 of 12
(page number not for citation purposes)
Table 4: Patient-reported outcomes
Raw data: mean scores (SD) Estimated effect
of intervention
Estimated effect of intervention adjusted for
a difference between registers
Measure Control Intervention Mean (95% CI) Mean (95% CI)
Diabetes symptom score 2.18 (0.71) 2.20 (0.71) 0.02 (-0.08, 0.12) 0.02 (-0.08, 0.12)
SF-36
Physical function 48.8 (32.7) 48.9 (32.6) -0.19 (-4.88, 4.50) -0.17 (-4.87, 4.52)
Role physical 39.2 (43.8) 39.1 (44.5) -0.40 (-6.85, 6.04) -0.42 (-6.88, 6.03)
Bodily pain 52.9 (29.5) 52.8 (30.3) -0.22 (-4.25, 3.82) -0.18 (-4.24, 3.89)
General health 45.2 (23.1) 45.2 (23.7) -0.09 (3.58, 3.41) -0.05 (-3.52, 3.42)
Vitality 44.0 (23.0) 42.9 (23.8) -1.53 (-4.52, 1.45) -1.53 (-4.55, 1.48)
Social Function 66.4 (29.6) 64.0 (30.4) -2.71 (-7.00, 1.56) -2.71 (-7.03, 1.61)
Role emotional 54.1 (46.0) 52.9 (46.5) -1.15 (-7.17, 4.87) -1.22 (-7.21, 4.76)
Mental health 68.0 (20.4) 67.8 (20.3) -0.13 (-3.14, 2.88) -0.11 (-3.13, 2.91)
Physical health component score 30.1 (15.3) 29.7 (15.6) -0.50 (-2.80, 1.80) -0.50 (-2.82, 1.82)
Mental health component score 46.2 (11.8) 45.8 (12.1) -0.35 (-1.96, 1.27) -0.36 (-1.98, 1.26)
Table 3: Self-reported medication data from the patient questionnaire survey.
Drug category % of subjects taking
drug by group
Effect of
intervention
Effect of intervention adjusted for a
difference between registers
Control Intervention RR 95% CI RR 95% CI
Diabetes medication
Diet alone 46.4 47.0 1.01 0.87, 1.18 1.02 0.89, 1.17
Any oral hypoglycaemic (biguanide, sulphonylurea or
thiazolidinediones)
34.0 32.7 0.96 0.81, 1.14 0.96 0.81, 1.14
Sulphonylurea 19.7 18.6 0.94 0.75, 1.18 0.93 0.75, 1.16
Metformin 25.3 24.4 0.96 0.76, 1.22 0.97 0.77, 1.22
Insulin 24.4 26.8 1.10 0.84, 1.43 1.09 0.82, 1.37
Cardiovascular disease and risk factor
management
Any cardiovascular drug 49.6 45.9 0.92 0.84, 1.01 0.93 0.85, 1.01
Any anti-platelet drug 25.4 22.9 0.90 0.74, 1.10 0.90 0.75, 1.10
Aspirin 31.6 28.5 0.90 0.75, 1.08 0.90 0.75, 1.08
ACE inhibitor 25.0 22.1 0.89 0.75, 1.05 0.89 0.76, 1.05
Drugs primarily used as
a
antihypertensives (including
ACE/A-G inhibitors)
33.1 30.4 0.92 0.82, 1.03 0.92 0.83, 1.03
Any lipid-lowering 27.4 25.9 0.94 0.78, 1.14 0.95 0.78, 1.15
Statins 27.0 25.0 0.92 0.76, 1.12 0.93 0.77, 1.12
Fibrates 1.0 1.6 1.61 0.61, 4.27 1.59 0.60, 4.18
a. Categories of cardiovascular drugs can be prescribed for more than one purpose (e.g., beta-blockers may be used to treat hypertension but also
treat angina), whereas individual drugs within categories (e.g., atenolol) may be better known to be used for a specific purpose. The drugs in this
category were known to be used primarily as antihypertensives.
Implementation Science 2007, 2:6 />Page 10 of 12
(page number not for citation purposes)
of dietary advice – one of the four areas of improvement
in provider adherence to recommended care.
We showed no significant difference in patient-reported
outcomes between intervention and control groups. The
observed clustering in the outcome scores was smaller
than that assumed in the sample size calculation, and, as
we achieved the desired sample size, the lack of significant
changes in patient outcomes is unlikely to be due to a lack
of power. However, we do have to consider the possibility
of non-response bias for all the self-reported data with a
response rate of 51%, even though there was no difference
between intervention and control group response rates, or
on sociodemographic variables.
It is very unusual for implementation trials to include a
rigorous economic evaluation [25]. Given that implemen-
tation trials do not produce a single estimate of overall
effect, we have expressed the economic evaluation in
terms of the profile of incurred costs. Our assessment of
costs incurred by the practices was limited, and so we have
only suggested a hypothetical illustration of the likely
costs for an average Primary Care Trust as shown in Table
6. Whilst we could not precisely define the distribution of
the costs for general practices, assuming an average cost of
25% of the range shows that the practice incurred costs
would still be the single largest cost element incurred by
introducing a system such as this. Whilst for any individ-
ual practice the figures would be proportionately lower, in
a demand-led system such as UK general practice, coping
with such innovations should be accompanied by com-
mensurate resources. This is particularly important when,
as in this case, an innovation can reside in specialist serv-
ices or hospital care that has no responsibility for expend-
Table 6: Hypothetical example of the estimated costs of the intervention applied to an average PCT (Costs expressed in 2002/03
UK£).
Estimated costs Estimated costs for an average PCT
1
1. Adapting the guidelines £11443 £11443
2. Developing/modifying the software £14034 £14034
3. Local educational meetings £1204 £1204
4. Register running costs £5585 £5,585/year
5. General practice running costs
2
£19.11/patient/year £72,236/year
1 Average PCT: 40 general practices, practice size 3.5 FTE doctors, list size 1800/doctor, prevalence of type 2 diabetes 1.5%. This gives 3780
patients.
2. Average cost incurred by practices assumed to be 25% of the range of £0.00 to £76.52. Includes staff time and consumables.
Table 5: Economic analysis profile (Costs expressed in 2002/03 UK£).
Type of service/resource Mean (SD) per patient Effect of intervention adjusted for a
difference between registers
Control Intervention p-value Mean (95% CI)
NHS Costs
Primary care visits/consultations (n = 965) 135.61 (43.40) 136.67 (40.40) 0.96 0.50 (-21.5; 22.5)
Secondary care visits/consultations (n = 1091) 189.03 (55.40) 186.45 (68.73) 0.62 -7.41 (-37.58; 22.77)
All tests/investigations (n = 1046) 65.71 (26.28) 72.06 (28.05) 0.68 2.75 (-10.77; 16.28)
NHS pre-booked transport service (n = 1259) 19.34 (33.04) 17 (44.78) 0.49 -7.24 (-28.34; 13.85)
All drugs except insulin (n = 1330) 22.07(6.46) 20.81(6.68) 0.72 -0.55 (-3.6; 2.49)
Insulin (n = 1388) 6.13 (3.72) 6.18 (4.38) 0.83 0.20 (-1.65; 2.06)
Cardiovascular drugs (all categories) (n = 1341) 18.3 (5.38) 17.05(5.25) 0.60 -0.66 (-3.15; 1.84)
Private costs/time use
All private special items/equipment* (n = 1285) 20.80 (11.05) 26.98 (12.13) 0.10 4.89 (-0.97; 10.75)
All private consultations(n = 1348) 3.21 (3.92) 2.45 (2.56) 0.49 -0.60 (-2.32; 1.12)
Costs-All private modes of transport (n = 1240) 7.43 (4.97) 6.86 (6.02) 0.47 -0.10 (-3.77; 1.78)
Patient-Pay loss because of time off (n = 1295) 1.10 (2.64) 3.73 (7.59) 0.06 3.01 (-0.15; 6.16)
Patient-Pay loss because of sick leave (n = 1195) 4.12 (12.33) 36.76 (103.08) 0.12 27.67 (-7.28; 62.63)
Patient-Hours off other activities (n = 1120) 1.67 (1.87) 0.86 (0.98) 0.07 -0.77 (-1.6; 0.07)
Patient-Days off other activities (n = 1034) 0.18 (0.29) 0.20 (0.34) 0.77 2.488E-02 (-0.15; 0.19)
Companion-Pay loss (n = 1233) 1.66 (6.62) 2.89 (9.08) 0.65 0.85 (-2.96; 4.67)
Companion-Days off (n = 734) 0.62 (0.86) 0.82 (1.11) 0.66 0.10 (-0.37; 0.58)
Companion – Hours off (n = 858) 2.50 (3.48) 2.11 (1.90) 0.74 -0.23 (-1.65; 1.19)
* Special items/equipment include: spectacles, special shoes, glucose tablets, monitoring equipment, books or videos.
Implementation Science 2007, 2:6 />Page 11 of 12
(page number not for citation purposes)
iture incurred in family or general practice. In any future
study, a more detailed costing study in general practice
would be important.
Conclusion
This study has shown benefits from an area-wide, compu-
terised diabetes register incorporating a full structured
recall and individualised patient management system.
However, these benefits were achieved at a cost. In future,
these costs may fall as electronic data exchange becomes a
reliable reality. However, as performance steadily rises it
will become ever more difficult to demonstrate smaller
and smaller incremental improvements. Considering our
findings alongside those of Shojania's review, such devel-
opments should only be evaluated in large-scale, ran-
domised controlled trials incorporating a full economic
evaluation.
Declaration of competing interests
DM was senior partner of Westman Medical Software,
who developed the software. The company was taken over
by ProWellness UK Ltd, who continue to maintain the
software used in this study. The remaining authors declare
that they have no competing interests.
Authors' contributions
The study was conceived by ME, GH and JG. It was
designed by ME, GH, PW, JG, NS, AV, DM and LW. It was
run by PW, CS, GH, AV and ME. DM developed and mod-
ified the software. Senior clinicians and diabetes register
staff in the two sites ran and maintained the intervention.
NS supervised the analysis. AV conducted the economic
evaluation. All authors commented on successive drafts of
the paper. ME is the guarantor of the paper.
Additional material
Acknowledgements
This study was funded by Diabetes UK, and Northern and Yorkshire
Regional NHS R&D Office. The study was independent of the funding bod-
ies, and the views expressed here are those of the authors and do not nec-
essarily reflect the views of the funding bodies. The study funders had no
involvement in the study design, collection, analysis, interpretation of the
data, writing of the report or paper, or in the decision to submit the paper
for publication.
We are grateful to our collaborators at North Tees and Hartlepool NHS
Trust, particularly Dr Carr, Dr MacLeod, Joanne Clayton and John Fitzsim-
mons; at Easington Primary Care Trust and North Tees Primary Care
Trust; and at South Tyneside Primary Care Trust and South Tyneside
Healthcare NHS Trust, particularly Professor C Bradshaw and Dr J Parr,
Wynn Schembri and Clare Beard. Jeremy Grimshaw holds a Canada
Research Chair in Health Knowledge Uptake and Transfer. The Diabetes
Clinic Satisfaction Questionnaire was supplied by Prof C Bradley.
References
1. The Acropolis Affirmation: Diabetes care - St Vincent in
progress [Statement from St Vincent Declaration Meeting,
Athens, Greece, March 1995]. Diabetic Med 1995, 12:636.
2. UK Prospective Diabetes Study (UKPDS) Group: Intensive blood-
glucose control with sulphonylureas or insulin compared to
conventional treatment and risk of complications in patients
with type 2 diabetes (UKPDS 33). Lancet 1998, 352:837-853.
3. Department of Health: National Service Framework for Diabetes: Delivery
Strategy London, Department of Health; 2003.
4. Griffin S, Kinmonth AL: Diabetes care: the effectiveness of sys-
tems for routine surveillance for people with diabetes
[Cochrane Review]. In The Cochrane Library Issue 4 edition.
Oxford, Update Software; 1999.
5. Shojania KG, Ranji SR, Shaw LK, Charo LN, Lai JC, Rushakoff RJ,
McDonald KM, Owens DK: Diabetes Mellitus Care. In Closing the
quality gap: a critical analysis of quality improvement strategies. Technical
Review 9 2nd edition. Edited by: Shojania KG, McDonald KM, Wachter
RM and Owens DK. Rockville, Agency for Healthcare Research and
Quality; 2004.
6. New JP, Hollis S, Campbell F, McDowell D, Burns E, Dornan TL,
Young RJ: Measuring clinical performance and outcomes from
diabetes information systems: an observational study. Diabe-
tologia 2000, 43:836-843.
7. Masding MG, Adams A, Dawson A, Gatling W: A countywide pri-
mary care annual audit fails to demonstrate an improve-
ment in diabetes care between 1996 and 2001. Pract Diabetes
Int 2003, 20:129-134.
8. Eccles M, Hawthorne G, Whitty P, Steen N, Vanoli A, Grimshaw J,
Wood L: A randomised controlled trial of a patient based Dia-
betes Recall and Management System: the DREAM Trial: A
study protocol [ISRCTN32042030] (21 March 2002). BMC
Health Services Research 2002, 2:5:.
9. Ware J: SF-36 Health Survey: Manual and Interpretation Guide Boston,
MA, The Health Institute, New England Medical Center; 1993.
10. Ware JE Jr., Kosinski M, Bayliss MS, McHorney CA, Rogers WH, Rac-
zek A: Comparison of methods for the scoring and statistical
analysis of SF-36 health profile and summary measures: sum-
mary of results from the Medical Outcomes Study. Med Care
1995, 33(4):264-279.
11. Jenkinson C, Stewart-Brown S, Petersen S, Paice C: Assessment of
the SF-36 version 2 in the United Kingdom. J Epidemiol Comm
Health 1999, 53:46-50.
12. McColl E, Steen IN, Meadows KA, Eccles MP, Hewison J, Fowler P,
Blades SM: Developing outcome measures for ambulatory
care: an application to asthma and diabetes. Social Science &
Medicine 1995, 41:1339-1348.
13. Bradley C: Handbook of psychology and diabetes: A guide to
psychological measurement in diabetes research and prac-
tice. Edited by: Bradley C. Chur, Switzerland, Harwood Academic
Publishers; 1994:392-393.
14. Thompson S, Wordsworth S, on behalf of the UK Working Party on
Patient Costs: An annotated cost questionnaire for completion by patients
Additional File 1
Example of a structured management sheet. The file provides an ano-
nymised example of a structured management sheet from the enhanced
diabetes register.
Click here for file
[ />5908-2-6-S1.pdf]
Additional File 2
Table 2 (expanded). Unadjusted and adjusted register-derived process
and clinical outcome data results for intervention and control groups. This
table reproduces the data provided in Table 2 and also includes analyses
allowing for baseline data only and register effect only.
Click here for file
[ />5908-2-6-S2.doc]
Publish with BioMed Central and every
scientist can read your work free of charge
"BioMed Central will be the most significant development for
disseminating the results of biomedical research in our lifetime."
Sir Paul Nurse, Cancer Research UK
Your research papers will be:
available free of charge to the entire biomedical community
peer reviewed and published immediately upon acceptance
cited in PubMed and archived on PubMed Central
yours — you keep the copyright
Submit your manuscript here:
/>BioMedcentral
Implementation Science 2007, 2:6 />Page 12 of 12
(page number not for citation purposes)
[HERU Discussion Paper 13/01] University of Aberdeen, Health Eco-
nomics Research Unit; 2001.
15. Donner A, Birkett N, Buck C: Randomization by cluster, sample
size requirements and analysis. Am J Epidemiol 1981,
114:906-915.
16. Jenkinson C, Layte R, Wright L, Coulter A: The UK SF-36: an analysis
and interpretation manual Oxford, Health Services Research Unit, Uni-
versity of Oxford; 1996.
17. Eccles M, McColl E, Steen N, Rousseau N, Grimshaw J, Parkin D,
Purves I: Effect of computerised evidence based guidelines on
management of asthma and angina in adults in primary care:
cluster randomised controlled trial. BMJ 2002, 325:941-944.
18. Drummond MF, Schulpher M, O'Brien BJ, Stoddart GL, Torrance
GW: Methods of economic evaluation in health care 3rd edition. Oxford,
Oxford University Press; 2005.
19. Netten A, Curtis L: Unit costs of health and social care 2003 Kent, Uni-
versity of Canterbury; 2003.
20. Department of Health: The new NHS: Reference costs London, Depart-
ment of Health; 2002.
21. Report by the Comptroller and Auditor General: NHS Direct in Eng-
land HC 505, Session 2001-2002: 25 January 2002 edition. London,
The Stationery Office; 2002.
22. British Medical Association: BNF 45, MeReC [electronic version] Lon-
don, The British Medical Association and the Royal Pharmaceutical
Society of Great Britain; 2003.
23. Whitty P, Eccles MP, Hawthorne G, Steen N, Vanoli A, Grimshaw JM,
Wood L, Speed C, McDowell D: Improving services for people
with diabetes: lessons from setting up the DREAM Trial.
Pract Diabetes Int 2004, 21:323-328.
24. General Medical Council: Good Medical Practice 3rd Ed May edition.
London; 2001.
25. Grimshaw JM, Thomas RE, MacLennan G, Fraser C, Ramsay CR, Vale
L, Whitty P, Eccles MP, Matowe L, Shirran L, Wensing M, Dijkstra R,
Donaldson C: Effectiveness and efficiency of guidline dissemi-
nation and implementation strategies. Health Technol Assess
2004, 8:1-84.