Pediatric PET Imaging - part 6 pptx
Bạn đang xem bản rút gọn của tài liệu. Xem và tải ngay bản đầy đủ của tài liệu tại đây (827.34 KB, 59 trang )
correlation with tumor grade in a series of 42 patients with soft tissue
and bone sarcoma. Specific types of bone tumor were not detailed. The
same group reported that the median SUV
max
was significantly differ-
ent for each histologic grade of tumor when divided into high-, inter-
mediate-, and low-grade tumors. Looking at other markers of tumor
aggressiveness, such as increased tumor cellularity, mitosis, and level
of Ki-67 (proliferation of a specific nuclear antigen detected by immu-
nohistochemical staining which correlates with growth fraction of
tumors) proliferative index, there was also a significant correlation
found with SUV
max
. These researchers and others have also found mod-
erate correlation with tissue levels of the cell growth regulation product
p53 (31,32). These parameters have been correlated with a poorer
outcome for higher tumor grades, shorter survival, and development
of distant metastatic disease.
278 Chapter 15 Primary Bone Tumors
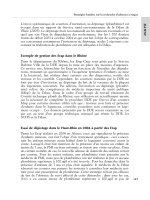
Figure 15.3. Apoor response to treatment. Osteogenic sarcoma of the proxi-
mal left humerus in a 14-year-old girl. Top row shows pretherapy MRI (T1 post-
gadolinium) and
18
F-FDG study. The MRI shows marked destruction of the
proximal humerus with tumor crossing the growth plate, central bone necro-
sis, and extensive soft tissue tumor mass. The PET study shows marked het-
erogeneous distribution of FDG in the proximal humerus with focal increased
metabolism seen peripherally and central necrosis. This scan indicates more
specific biopsy sites in the most metabolic areas. This patient was a poor
responder to
neoadjuvant therapy (bottom row), with the MRI showing sig-
nificant enhancement and the PET study persisting increased uptake. The post-
surgical resection specimen showed <5% necrosis confirming poor response.
Subsequently, this patie
nt developed pulmonary metastases.
Table 15.1. Summary of studies of histologic grading or tumor aggressiveness and measures of fluorodeoxyglucose uptake
OverlapMit
No. of Histologic malignant cell Survival
patients and grade vs SUV SUV SUV Ki- SUV
Study tumor type good benign T/NT malignant benign 67 Sensitivity Specificy Accuracy high
Eary et al. (12) 70 ST and BSYes Yes
Schulte et al. (33) 202; 44 OS, Yes Yes T/NT T/BG 3.3–73* T/BG 3.0–35.0 93% 67% 82%
14 ES >3.0 T/BG 1.4–31.0**
Feldman et al. (34) 45 ST and Yes Yes SUV
max
SUV
max
SUV
max
92% 100% 92%
BS, 24 BS, >2.0 3.74–9.23 0.81–1.74
3 OS, 1 ES
Dimitrakopoulou- 83; 9 OS, Yes SUV + SUV
max
3.7 SUV
max
1.1 SUV 54% 91%75%
Strauss et al. 8 ES dynamic (0.4–12.3) (0.4–3.5) SUV + 97% 88%
(35) indices dynamic
76%
Aoki et al. (36) 52; 6 OS, Yes Yes SUV
mean
SUV 4.34 ± 3.19 SUV
mean
2 ES 2.18 ±1.52
Kole et al. (38) 26; 5 OS, No Yes SUV
av
SUV
av
3.2 SUV
av
0.53
2 ES largeMRFDG (0.74–7.64) (0.22–1.07)
SUV
max
SUV
max
7.07
(2.23–16.06)
Eary et al. (31) 209; 52 BS Yes SUV
max
1.4–60.0 Yes Poor
Franzius et al. (39) 29 OS Yes T/NT
avg
4.5 T/NT
max
T/NT
max
poor
12.6
Folpe et al. (32) 89 ST and BS Yes Yes Poor
*High grade sarcoma
**Low grade sarcoma
BS = Bone sarcoma; ES = Ewing sarcoma; Mit Cell Ki67 = correlation SUV with indices of tumor aggressiveness (i.e. mitotic activity, cellularity, Ki67); OS = ost
eogenic sarcoma;
Overlap = between malignant and benign. Some benign may have high uptake; ST = soft tissue; SUV
av
= SuVaverage; T/NT = Tumor uptake/Nontumor uptake.
279
Schulte et al. (33) used T/BG ratios in their series of 202 patients,
including 44 patients with OS and 14 with ES. Among the bone sarco-
mas, OS had a tendency to higher T/BG ratios than did ES. Glucose
metabolism was greater for high-grade malignant lesions than for low-
grade tumors. Using a T/BG ratio of >3.0 for malignancy, the sensitiv-
ity was 93%, specificity 66.7%, and accuracy 81.7%. Other authors have
used cutoff values of SUV to help differentiate between malignant and
benign bone lesions. Feldman et al. (34) reported using a SUV
max
cutoff
of 2.0 for differentiating malignant from benign osseous and
nonosseous lesions. They reported a sensitivity of 91.7%, specificity of
100%, and accuracy of 91.7%. All aggressive lesions had a SUV
max
of
>2.0. The differentiation was significant statistically. Dimitrakopoulou-
Strauss et al. (35) reported dynamic quantitative FDG-PET in 9 OS
and 8 ES patients in a group of 83 patients. Malignant tumors
showed enhanced uptake, but there was visually an overlap with some
benign lesions. The mean SUV was 3.7 (range 0.4–12.3) for malignant
tumors compared to 1.1 (range 0.4–3.5) for benign lesions. Two grade
I OS, one grade I ES, and a neuroectodermal tumor did not show
enhanced FDG uptake. The authors used other parameters that also
showed higher values in malignant tumors compared to benign
lesions, but there was some overlap. They reported a sensitivity of 76%,
specificity of 97%, and accuracy of 88%. Aoki et al. (36) in 52 patients
showed a significant difference in the mean SUV between benign and
malignant bone conditions. Although OS had high SUV, there were
several other conditions, in particular giant cell tumors, fibrous dys-
plasia, sarcoidosis, and Langerhans cell histiocytosis, that also had high
values. A cutoff level for differentiating OS could not be applied. Other
benign or nonmalignant conditions that may have high FDG uptake
and high SUV values are infective or inflammatory conditions such as
osteomyelitis. Watanabe et al. (37) could not differentiate between
osteomyelitis and malignant bone tumors. Also of note in their group
of patients was that skeletal metastases tended to have higher SUV
values than primary OS.
Only one publication reported no correlation between metabolic rate
of glucose metabolism and biologic aggressiveness of bone tumors.
Kole et al. (38) described 19 malignant and seven benign tumors. All
lesions were clearly visualized by FDG-PET except for an infarct in a
humerus. When SUV and Patlak derived metabolic rates were used to
try to differentiate between benign and malignant tumors, there was a
wide overlap between patients. The authors also commented that
patients with low metabolic rates had a poor response to chemother-
apy, and one patient with high rate responded well. They also observed
that malignant fibrous histiocytoma and lymphoma had high rates
compared to OS.
Indication of Prognosis
The prognostic value of PET may be even more important than its
ability to define histopathologic grade. Eary et al. (31) analyzed SUV
max
for the ability to predict patient survival and disease-free survival. In
280 Chapter 15 Primary Bone Tumors
a retrospective analysis of 209 patients with sarcoma (52 primary bone
tumors) who had FDG-PET, a multivariate Cox regression analysis was
applied to SUV
max
in predicting time to death or disease progression.
The authors stated that SUV
max
is a significant independent predic-
tor of patient survival and disease progression. Tumors with higher
SUV
max
had a significantly poorer prognosis. Also, SUV
max
had better
correlation for histologic tumor grades with a higher significance of
baseline SUV for prediction of outcome compared to conventional
tumor imaging. Franzius et al. (39) evaluated 29 patients with primary
OS. Using the average and maximum tumor-to-nontumor ratios
(T/NT), they determined there were prognostic implications for OS
based on the degree of FDG uptake. After chemotherapy, the patients
underwent surgery, and response was determined histologically. Both
overall and event-free survival were significantly better in patients
with low T/NT
max
than in patients with high T/NT
max
. It was con-
cluded that the initial glucose metabolism of primary OS, as measured
by FDG T/NT
max
, clearly discriminated between those patients with a
high probability of overall and event-free survival versus OS patients
with a poor prognosis. Of note was the fact that no significant dif-
ference was found between the various OS histology subtypes or
the different regression grades. There was also no significant differ-
ence between the size of the primary tumor and uptake values. The
fact that high FDG uptake correlates strongly with a poor outcome
despite imperfect correlation with other known prognostic factors
suggests that it may reflect a number of disparate adverse biologic
characteristics.
Local Extent of Primary Tumor
Conventional cross-sectional radiographic imaging, that is, MRI and
CT, are routinely used to define both the intraosseous and extraosseous
extent of the primary tumor (Figs. 15.1 and 15.2). However, PET adds
further information to these cross-sectional techniques, particularly
with respect to intramedullary extension and skip lesions. Magnetic
resonance imaging may overestimate tumor extension due to signal
abnormalities of peritumoral edema. Also changes within the marrow
cavity may be considered abnormal in children but may be due to phys-
iologic red blood marrow distribution (40). Other changes such as
necrosis or fibrosis within the tumor can be characterized better
with PET.
Biopsy and Sampling Error
Histopathologic classification is a vital step in the management of
suspected sarcomas. Tumor grade determined from biopsy has signif-
icant prognostic and management implications. The ability of PET to
determine the biologic aggressiveness of tumors is very useful in indi-
cating which sites in a tumor should be biopsied. There is usually
marked heterogeneity of FDG uptake in sarcomatous tumors, and the
accuracy of tumor diagnosis and the histologic grading may suffer
from poor sampling. The areas of high metabolic activity are often seen
R. Howman-Giles et al. 281
in the peripheral regions of the tumor mass, particularly in large het-
erogeneous tumors within which there may be large areas of necrosis.
False tumor grading, particularly an erroneous assessment of low
grade, could have a significant impact on appropriate chemotherapeu-
tic options. Folpe et al. (32) reported a good differentiation between
levels of tumor grading by PET but could not distinguish between
grade II and grade III tumors. Also, other tumors and some benign
tumors may have high SUV values. Currently the published data do
not support the idea that biopsy can be avoided as there are different
histologic types of bone tumors that will determine specific treatments
and there can be an overlap of some benign conditions. As the higher
grades of tumor determine the overall histologic tumor grade and
therefore predict outcome, the application of PET to indicate the most
metabolically active sites of the tumor (Fig. 15.3) should allow better
and more accurate sampling of the tumor (13,18).
False Positives
Fluorodeoxyglucose-PET has been reported to show increased accu-
mulation in other malignant tumors, and in benign, inflammatory, and
infective lesions. These include giant cell tumor, fibrous dysplasia,
Langerhans cell histiocytosis, chondroblastoma, chondromyxoid
fibroma, desmoplastic fibroma, aneurysmal bone cyst, nonossifying
fibroma, fracture (Fig. 15.4), simple bone cyst with fracture, acute and
chronic osteomyelitis, and renal osteopathy (13,33). These conditions
generally require a positive diagnosis, if only for purposes of reassur-
282 Chapter 15 Primary Bone Tumors
CT Scout View PET Coronal PET Transaxial
CT Transaxial
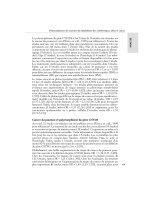
Figure 15.4. False-positive PET from a pathologic fracture. Although not a pediatric case, this figure
illustrates the difficulty that can arise in differentiating between a pathologic fracture and primary
osteosarcoma of bone. Based on clinical presentation and a biopsy taken at the time of internal fixa-
tion, this patient was believed to have an osteosarcoma of the right humerus. A staging PET scan
demonstrated focal uptake in the prostate, and metastatic prostate cancer was subsequently confirmed
on further immunohistochemistry of the initial biopsy specimen.
ance, and may have specific treatment that can be delivered once a
diagnosis has been reached. Accordingly, these false-positive results
need to be considered in the clinical context in which they occur. Cer-
tainly, if they were to lead to unnecessary or inappropriate surgery or
chemotherapy, these results would be considered undesirable, but if
they help to guide biopsy or exclude additional sites of disease, they
can make a valuable contribution to patient management.
Metastatic Disease
In approximately 20% of cases there are clinically detectable metastases
at diagnosis.
Pulmonary
As the main metastatic spread is to the lungs initially, high-resolution
spiral CT (HRCT) is the recommended investigation. Since the imple-
mentation of the HRCT technique, there has been a doubling of detec-
tion of pulmonary metastases (10,13). Localized areas of pulmonary
metastatic disease may be amenable to surgical removal. Positron emis-
sion tomography scans are useful to exclude additional macroscopic
disease beyond the lungs. In some cases PET can also reliably identify
false-positive results on CT and thereby spare patients unnecessary
thoracotomy.
Schulte et al. (41) performed a comparison of CT and PET in detect-
ing pulmonary metastases but did not show any significant difference
for the number of lesions. Other studies have reported similar findings
in soft tissue sarcoma. However, Franzius et al. (42) reported a com-
parison of CT and PET for pulmonary metastases in 32 patients who
had 49 PET scans. The sensitivity, specificity, and accuracy of FDG-PET
were 50%, 100%, and 92%, respectively. The metastases missed by PET
were small (<9mm). However, additional lesions were detected that
were not seen by CT. Lucas et al. (43) also reported, in soft tissue sar-
comas, metastatic spread outside the lungs, which was not seen by CT
or MRI.
In summary, HRCT is the recommended modality for the detection
of pulmonary metastases, particularly for <1 cm lesions; however, PET
may add further information on whether these are malignant and may
detect extrapulmonary metastases. Because benign pulmonary nodules
are relatively common, particularly with newer helical CT scanners, not
all lesions seen in the lungs in the context of primary osseous tumors
are malignant. In the clinical situation where no previous investigations
are available to determine the appearance or growth of lung nodules,
PET can provide complementary information regarding the likelihood
of malignancy. Those nodules that have intense FDG uptake are highly
likely to represent metastases. Less intense FDG uptake should also be
considered suspicious if the size of the nodule in question is less than
twice the reconstructed spatial resolution of the PET scanner being
used, because partial-volume effects significantly degrade count recov-
ery for small lesions (44). For most modern PET scanners, this would
R. Howman-Giles et al. 283
equate to lesions less than 10mm in diameter. Respiratory excursion
can also lead to partial volume effects, and one would generally expect
somewhat lower FDG uptake in basal than apical lung nodules of com-
parable size due to greater respiratory blurring in the former. Finally,
the avidity of the primary tumor is usually reflected in the intensity of
uptake in metastatic sites. Accordingly, absence of FDG uptake in a
lesion of 10 mm in the apex of the lung of a patient with an OS with a
SUV
max
of 25 is much more likely benign than malignant, whereas
a lesion of the same size in the lung base of a patient with an ES with
a SUV
max
of 3.5 has a higher likelihood of malignancy on technical con-
siderations alone. Of course, the radiologic features of the nodule, other
clinical details, and the prevalence of benign lung nodules in the
general population of the case in question also influence the likelihood
of malignancy (Fig. 15.5).
Skeleton
The second most common area of metastatic disease is the skeleton,
which occurs in 10% to 20% of patients with metastatic disease.
Franzius et al. (45) looked at 70 patients with primary bone tumors (32
OS, 38 ES) for metastatic disease. The reference methods for imaging
modalities were histopathologic analysis and conventional imaging
with follow-up for 6 to 64 months. In 21 examinations, 54 osseous
metastases were detected (5 OS, 49 ES). Fluorodeoxyglucose-PET had
sensitivity, specificity, and accuracy of 90%, 96%, and 95%, respectively,
compared to the radionuclide bone scan using technetium-99m (
99m
Tc)-
MDP[methylene diposphonate], which had 71%, 92%, and 88%,
respectively. Interestingly, when the OS and ES were compared, the
performance of PET relative to bone scanning differed. For ES, the
284 Chapter 15 Primary Bone Tumors
Figure 15.5. Pulmonary metastases. This patient with multifocal local recurrence related to osteosar-
coma of the right lower leg (not shown) had multiple new lung nodules on CT scanning. Only the
largest of these, a 9-mm left upper lobe lesion was clearly abnormal on FDG-PET (right coronal plane
image). Nevertheless, the presence of metabolic abnormality in any nodules that are sufficiently large
to be relatively unaffected by partial volume effects increases the likelihood that any other nonvisual-
ized but smaller nodules are also malignant.
sensitivity, specificity, and accuracy of PET were 100%, 96%, and 97%,
respectively, compared to bone scintigraphy of 68%, 87%, and 82%,
respectively. However, none of the five OS osseous metastases were
detected by FDG but were true positive on the bone scan. In a more
recent publication by the same group, the authors reported 100% detec-
tion by FDG-PET in six sites of bony metastatic disease from OS (46).
These differences may relate to the contrast resolution of the respective
modalities. Very high osteoblastic activity in metastatic OS sites may
improve lesion sensitivity even though the spatial resolution of planar
and SPECT bone scanning is less than that of PET. Conversely,
improvements in PET instrumentation including improved scanner
resolution and better attenuation correction methods could also
improve lesion sensitivity.
Daldrup-Link et al. (47) compared FDG-PET, bone scintigraphy, and
whole-body MRI for detection of bone metastases from multiple types
of malignancies. They looked at 39 children and young adults with
various metastases including 20 patients with ES and three with OS.
Of 51 bone metastases, the overall sensitivity for FDG-PET, whole-body
MRI, and bone scintigraphy were 90%, 82%, and 71%, respectively.
False-negative sites were different for the three modalities. In one
patient with osteogenic sarcoma, a single metastasis was diagnosed
with bone scintigraphy and MRI but was negative on FDG-PET. Most
false-negative findings for PET were in the skull; for MRI in flat and
small bones, the skull, carpal bones, and radius; and for bone scintig-
raphy in the spine. The number of skeletal metastases was inversely
related to lesion size. Large lesions >5cm were correctly diagnosed
with FDG-PET and MRI in 100% of patients, but skeletal scintigraphy
had a sensitivity of 93%. Sensitivity for smaller lesions of 1 to 5 cm for
FDG-PET was 86%, MRI 79%, and skeletal scintigraphy 62%. For bone
metastases <1 cm, FDG-PET showed a sensitivity of 86%, MRI 57%, and
skeletal scintigraphy 57%. More false positives, however, were found
with PET; they were, in this series, a simple bone cyst, an enchondroma,
and an osteoma. The latter two were diagnosed with plain radiogra-
phy. Increased sensitivities for detection of lesions were found by com-
bining the modalities: for skeletal scintigraphy and MRI, 90%; for
skeletal scintigraphy and FDG-PET, 96%; and for MRI and FDG-PET,
96%. Thus the sensitivities of skeletal scintigraphy and MRI alone were
significantly increased either in combination with each other or with
PET. But the sensitivity of PET was not increased significantly by com-
bining with one of the other modalities. In clinical practice, as opposed
to technical validation studies, PET should always be interpreted in the
clinical context and with careful correlation of all the imaging results
available in a given patient. The choice and order in which imaging
studies are performed will also likely be determined by a multitude of
factors including cost, convenience, and availability. Although bone
scanning is relatively inexpensive and widely available, it is probably
worthwhile in most cases of OS, but its role in ES and other sarcomas
must be questioned if PET is available.
In the future there may be a role for
18
F-PET scans. Initial evaluation
indicates a high detection rate for skeletal metastases. Accordingly, this
R. Howman-Giles et al. 285
may enhance the sensitivity for metastases in OS compared to FDG-
PET by virtue of higher lesion avidity and compared to bone scintig-
raphy by virtue of superior spatial resolution (13).
Other Secondary Sites
Metastases to other areas, for example, lymph nodes, brain, and soft
tissue, are uncommon but can be detected by PET. There are no data
comparing conventional radiology techniques with PET for this role.
The ability of PET, however, to screen the whole body is a significant
advantage (13,41,43).
Assessment of Response to Treatment
Response to preoperative adjuvant chemotherapy has been shown to
be the most important prognostic factor in the management of OS and
ES, as the degree of tumor necrosis from the therapy is highly corre-
lated with disease-free survival after therapy (8,21,22). Due to the sur-
gical and prognostic implications relating to an adequate response to
neoadjuvant therapy, a noninvasive marker for assessing histologic
response would be very clinically useful. Tumor necrosis can exist in
the primary tumor and is itself a manifestation of large or aggressive
tumors. It can be difficult to know on the basis of a small pretreatment
biopsy the proportion of viable and nonviable tumor and therefore
compare relative change in this parameter when confronted by a large
excisional specimen posttreatment. Evaluation of early response to
chemotherapy in primary bone tumors after 3 to 6 weeks of therapy
may be highly predictive of tumor necrosis; whether PET is valid for
this purpose requires further study. In this way, noninvasive assess-
ment of chemotherapy response by PET may significantly alter patient
management (Figs. 15.2 and 15.3). For instance, limb-sparing surgery
is more likely to be considered if there is a favorable response to
chemotherapy. There may be an alteration in surgical approach. Also
if there is an unfavorable response several investigators recommend a
change in chemotherapeutic regimen. The earlier that this can be
detected, the earlier the change can be made (4,5,8,13).
Radiologic methods such as radiography, CT, and MRI are poorly
suited for discriminating adequately between responding and nonre-
sponding osseous tumors. The tumors frequently do not change in size,
or there may be some minor change in the soft tissue mass around the
osseous component. The response of the tumor detected by using these
conventional methods does not reflect the quantity of residual viable
tumor. New techniques using dynamic contrast-enhanced MRI have
been shown to improve the differentiation of viable sarcoma tissue
from tumor necrosis as an early indicator of recurrence. This technique
is promising and needs further evaluation (18,48,49).
Functional nuclear medicine biological methods such as thallium 201
(
201
Tl),
99m
Tc sestamibi, and FDG-PET have been shown to be effective
response markers for chemotherapy assessment in primary bone
tumors (17).
201
TI and
99m
Tc sestamibi have been used to determine
286 Chapter 15 Primary Bone Tumors
grade and response to chemotherapy. A negative
201
Tl or
99m
Tc sestamibi
scan after therapy reflected a grade III to IV response with >90% necro-
sis of tumor cells. Kostakoglu et al. (50) reported for
201
Tl a sensitivity
of 100%, specificity of 87.5%, and accuracy of 96.5% compared to sen-
sitivities of 95%, 50%, and 82.7%, respectively, for CT, MRI, and angiog-
raphy in bone and soft tissue sarcomas. However, FDG-PET with its
uptake quantifiable by using SUV or T/BG ratios adds further infor-
mation and is recommended if available.
Jones et al. (51) were one of the first groups to report the impact of
FDG-PET in the monitoring of treatment in patients with muscu-
loskeletal sarcoma, 3 of whom had OS. The authors observed a 25%
to 50% reduction of the peak and average SUV, 1 to 3 weeks after
chemotherapy was instituted; this correlated with >90% tumor cell
necrosis. They also reported that there was increased FDG uptake seen
in granulation tissue and in the pseudofibrous capsule in treated
cancers. This indicates that there is FDG uptake in both the viable
tumor and some benign reactive tissues (Fig. 15.2C). This has the poten-
tial to overestimate the presence of OS. Other groups have reported
changes in response to treatment in a significant number of patients
with primary bone tumors by using PET and showed good corre-
lation with histopathologic changes after treatment (Table 15.2) (41,
52, 53).
Franzius et al. (52) reported good correlation in 17 patients between
T/NT ratios and primary bone tumors (11 OS, 6 ES). The mean T/NT
was 5.2 (range 2.2–13.6) for all 17 patients with posttherapy values of
2.3 (0.9–11.9). For OS pretherapy T/NT was 5.5 (2.3–13.6) and post-
therapy 2.8 (0.9–11.9); for ES the pretherapy was 5.3 (2.2–11.9) and post-
therapy 1.4 (1.0–1.9). There was good correlation with tumor necrosis
on histopathology in 15 of 17 overall, in 9 of 11 patients with OS, and
in all 6 of the patients with ES. The authors found that a threshold of
a 30% decrease in the ratio represented good responders (<10% viable
tumor cells) and could distinguish these patients from poor responders
in all cases.
Hawkins et al. (53) looked at SUV values of FDG-PET uptake in 14
OS and 14 ES patients. They used SUV
max
values in tumors pre-(SUV1)
and post-(SUV2) chemotherapy. They demonstrated that a reduction
in tumor FDG uptake, measured by SUV2
max
and the ratio of
SUV2/SUV1, correlated with chemotherapy response as quantified by
percent necrosis after surgical resection. In OS SUV1 was 8.2 (2.5–24.1)
and decreased to SUV2 of 3.3 (1.6–12.8) after chemotherapy; SUV2 was
particularly accurate in identifying OS patients with unfavorable
response. In the ES group, the SUV1 was 5.3 (range 2.3–11.8) and
decreased to SUV2 of 1.5 (0–2.4) posttherapy. The mean percent necro-
sis of the OS group was lower than the ES group; only 28% of OS
tumors responded adequately with a mean percent necrosis of >90%.
However, the authors report that both the SUV2 and SUV2/SUV1 ratio
are imperfect at distinguishing favorable from unfavorable responses.
Using a cutoff point of <2 for SUV2 to predict favorable response was
incorrect in 16% and using a cutoff point of <0.5 for SUV2/SUV1 for a
favorable response was incorrect in 27% of patients. The most likely
R. Howman-Giles et al. 287
explanation was due to increased FDG uptake in inflammatory infil-
trates or reactive fibrosis within the tumor as a response to chemo-
therapy. Other reasons are that the histopathologic evaluation averages
the percentage of necrosis across the entire resected tumor specimen,
whereas the SUV technique is based on the maximum value within the
tumor. Stated another way, a specimen that is extensively necrotic
but with isolated foci of viable tumor would be classified as favorable,
but the maximum SUV may remain elevated reflecting the focal
viable tumor. A method similar to that proposed by Larson et al. (54)
288 Chapter 15 Primary Bone Tumors
Table 15.2.Changes in response to treatment in patients with primary bone tumors
Pretherapy Posttherapy
SUV1, SUV2, Correlation
T/NT1, T/NT2, with
Study PathologyT/BG1,T/BG2 Response necrosis
Franzius et 17 BS T/NT T/NT mean 15/17Yes
al. (52)mean 5.22.3 (0.9–11.9) good
(2.2–13.6)
11 OS T/NT 5.5 T/NT 2.8 9/11 Yes
(2.3–13.6) (0.9–11.9) good
6 ES T/NT 5.3 T/NT 1.4 6/6 good Yes
(2.2–11.9) (1.0–1.9)
Hawkins et 18 OS SUV
mean
SUV
mean
3.3 Yes Mean 66%
al. (53) 8.2 (2.5–24.1)(1.6–12.8) (0–98%)
15 ES SUV 5.3 SUV
mean
(0–2.4) Yes Mean 98%
(2.3–11.8) (90–100%)
OS
SUV2/SUV1
0.55 (0.12–1.1)
ES
SUV2/SUV1
0.35 (0.16–0.73)
Schulte et al. 27 OS T/BG 10.3
(41) (3.3–33.2)
Responder T/BGT/BG 2.27 Good Yes
10.34 (0.32–17.5)
(3.89–33.2)
Nonresponder T/BG 9.64 T/BG 6.37 Poor Yes
(3.26–22.2)(2.24–20.33)
Jones et al. 9 ST and BS SUV
max
SUV
max
3.3 3 OS Yes >90% Yes
(51) 5.8 (2.0– (2.3–4.3) 2/9
12.0) 6/9
high grade
SUV
mean
SUV
mean
2.1
3.6 (1.7–6.1)(1.8–2.3) 2/9
BS = Bone sarcoma; ES = Ewing sarcoma; OS = steogenic sarcoma; ST = Soft Tissue Sarcoma; SUVm = SUVmean;
T/BG = Tumor/Background; T/NT = Tumor/Nontumor.
that integrates the extent and intensity of metabolic activity may be
useful in such situations. The methodology to define the volume of
abnormal voxels—whether single or multiple voxels should be used—
for determination of the degree of SUV abnormality remains to be
established (18).
Schulte et al. (41), studying 27 patients with OS using T/BG ratios,
found a reduction in T/BG of >40% represented responders to
chemotherapy with an accuracy of 92.6%. The T/BG before therapy in
all patients ranged from 3.3 to 33.2 (median 10.3). In the responder
group, the pretherapy T/BG was 10.34 (3.89–33.2) and in nonrespon-
ders 9.64 (3.26–22.2). The posttherapy T/BG was for responders 2.27
(0.32–17.5) and nonresponders 6.37 (2.24–20.33). The posttherapeutic
values differed significantly between the responders and nonrespon-
ders. The extent of T/BG reduction, however, did not precisely predict
the quantitative amount of tumor necrosis. They did not report any
false-positive cases where they classified a responder as a nonrespon-
der due to benign reactive uptake as described by Jones et al. (51).
Serial assessments to monitor chemotherapeutic response were also
discussed by Nair et al. (55). They looked at 16 patients with OS. The
percentage change in tumor to background ratio (T/BR) did not predict
a 90% or higher rate of tumor necrosis. Visual assessment and T/BR
values, however, were predictive in 15 of 16 patients.
Further evaluation of the optimal quantitative method to assess
response should be undertaken, but the present data indicate that FDG-
PET is a relatively accurate indicator of tumor response to neoadjuvant
therapy.
Local Tumor Recurrence
The ability to detect residual viable tumor after therapy and to detect
local recurrence of tumor as early as possible is vital for improvement
in survival. It is also one of the most difficult areas of management.
Conventional imaging has significant limitations because of changes in
normal anatomy, distortion of tissue planes, and lack of distinction
between tumor and postoperative tissue, and image artifacts from
metallic limb prostheses. Differentiation from fibrosis, posttherapeutic
changes, and inflammatory tissue changes can be extremely difficult.
Magnetic resonance imaging with gadolinium enhancement may also
show increased enhancement in immature scar tissue and nonmalig-
nant reactive tissue (56). Most of the comparisons of MRI and FDG-
PET for the assessment of residual viable tumor and local recurrence
relate to soft tissue sarcomas, presumably due to the inherent difficul-
ties in evaluating periprosthetic sites. Garcia et al. (57) reported FDG
was helpful in differentiating active musculoskeletal sarcomas from
posttreatment changes in 48 patients. There were 18 patients with OS.
The diagnosis was confirmed by histology, and the sensitivity and
specificity were 98% and 90%, respectively. Similar results were found
by el-Zeftawy et al. (58) in 20 patients with both bone and soft tissue
tumors. The authors’ conclusion was that FDG added important infor-
R. Howman-Giles et al. 289
mation to CT and MRI to help differentiate postoperative change from
local recurrence (Fig. 15.6). Franzius et al. (46) also reported detection
of local recurrence in 6 patients with OS but had 1 false-negative study.
In the same group of patients, the MRI detected all 6 recurrences, but
there were 2 false-positive studies. In another group, Lucas et al. (43)
found that MRI had a higher sensitivity of 88.2% compared to PET of
73.7% for the detection of local recurrence of soft tissue sarcomas after
amputation. There are, however, significant difficulties with CT and
MRI in patients with implantation of metallic prostheses (59). Hains et
al. (60) described the limitations of FDG-PET in detecting local recur-
rence in amputation stumps. In their study, focal areas of FDG were
seen in known pressure areas and skin breakdown for up to 18 months
after surgery. However, in the absence of localized clinical changes in
the stump, any uptake may represent recurrence and should be biop-
sied (Fig. 15.7). The co-registration of PET with CT or MRI should help
significantly in these cases.
290 Chapter 15 Primary Bone Tumors
Post-CTx
Follow-up
at 4 mths
C
HEAD
RIGHT LEFT
1
FOOT
214–226 1 230–242 246-2581
C
HEAD
RIGHT LEFT
1
FOOT
166-182 1 182-198 198-2141
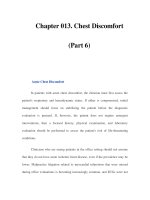
Figure 15.6. Recurrence. This patient had undergone chemotherapy for a distal right femoral Ewing
sarcoma. The posttherapy PET scan demonstrated a very good but partial metabolic response with
mildly increased activity inferomedially in the femur. A follow-up scan (below) performed 4 months
later demonstrates extensive local recurrence. Note normal thymic uptake in an adolescent.
Other PET Radiopharmaceutical Agents
Fluorine-18 Fluoride
Unchelated fluorine-18 fluoride (
18
F) was introduced as a bone imaging
agent in 1962 (61). It became the standard for bone scanning until the
introduction of
99m
Tc–labeled diphosphonates. It has a similar mecha-
nism of uptake to the latter, depending on local blood flow for tracer
delivery, diffusion through extracellular fluid to the bone mineral inter-
face, and adsorption to the hydroxyapatite crystal to form fluoroapatite
(62). Therefore, uptake reflects osteoblastic activity.
Inevitable comparisons have been made with
99m
Tc diphosphonate
bone scans. One cited advantage of
18
F is superior pharmacokinetics.
18
F has a higher extraction rate and faster blood clearance, allowing
imaging to commence as early as 1 hour after intravenous administra-
tion (63). Other advantages arise in combination with current genera-
tion PET or PET-CT scanners, allowing dynamic quantitation and
superior spatial and contrast resolution. One main drawback is the
R. Howman-Giles et al. 291
Figure 15.7. Recurrence of osteogenic sarcoma in amputation stump and
development of skeletal metastases. This patient had a primary osteogenic
sarcoma (OS) of the left femur removed 2 years previously. The PET study
shows recurrence in the amputation stump and a metastatic deposit in the
proximal right humerus. The patient developed multiple skeletal metastases
over the following 6 months and died.
higher cost of
18
F compared to the more widely available diphospho-
nate radiopharmaceuticals. However, as FDG production increases,
18
F
fluoride production as a by-product could become more efficient and
decrease radiotracer costs.
To date there has been little published experience with
18
F-PET in
primary bone tumors and even less for the pediatric population. One
early series was from Hoh et al. (63), who reported their experience in
19 adult patients with a mix of benign and malignant bone patholo-
gies. Using visual and a semiquantitative assessment (uptake ratio of
lesion-to-contralateral bone), it was not possible to differentiate benign
from malignant lesions. Of interest, there were 4 patients with OS in
the group. The three patients who had no prior treatment had primary
tumors with the highest uptake ratios in the study. The other patient’s
scan followed systemic therapy; the uptake here was lower than the
other three, suggesting a potential role for
18
F-PET in therapeutic mon-
itoring. Three of these 4 patients had multiple scan lesions, indicating
that metastases were also visualized, both skeletal and pulmonary. One
patient was specifically mentioned with uptake in multiple pulmonary
nodules.
Going further than the above study, would formal dynamic
18
F-PET
quantitation with blood sampling improve either the differentiation
between benign and malignant lesions or be incorporated into thera-
peutic monitoring of primary bone tumors? As yet no studies have
addressed this question. However, we can look at the experience with
99m
Tc diphosphonates where there is a similar mechanism of uptake.
Just as reactive bone formation or turnover often accounts for more
bone tracer localization than uptake by viable tumor, it is predicted that
18
F-PET would be similarly unsuccessful (64).
There are more studies of
18
F-PET for metastatic surveys. Although
these have again been mostly adult patients with unselected cancers,
many of the observations should be relevant here. Conventional
bone scans have a lower resolution, and almost all are planar images,
with single photon emission computed tomography (SPECT) limited
to a localized region of the body. The higher resolution and whole-
body tomography intrinsic to
18
F-PET predicts superior diagnostic
performance. Schirrmeister et al. (65–67) found this to be the case in
series of patients with breast, lung, prostate, and thyroid cancer. Supe-
rior resolution in the spine allowed more specific diagnosis over con-
ventional planar bone scans (67). This observation was taken a step
further with the more recent study of
18
F-PET-CT vs.
18
F-PET from
Even-Sapir et al. (68). One would expect that the improved lesion
localization from PET/CT would improve diagnostic accuracy, and
this was the case. Their study population ranged in age from 15 to 81
years old. There were three cases of ES, one chondrosarcoma, and one
giant cell tumor. In a patient-based analysis for the detection of
metastatic disease,
18
F-PET-CT was superior to
18
F-PET alone in sensi-
tivity (100% vs. 88%, p < .05) and specificity (88% vs. 56%, not signifi-
cant). Therefore, this is the most promising area for
18
F-PET; more
studies of specific tumor types, including pediatric primary bone
tumors, are awaited. The feasibility of acquiring
18
F-PET and
18
F-FDG-
292 Chapter 15 Primary Bone Tumors
PET scans at one clinic attendance is another interesting area for
study.
18
F-a-Methyltyrosine
After promising initial studies with iodine-123–labeled methyltyrosine
(69), fluorine-18 a-methyltyrosine (
18
FMT) was developed for PET
imaging (70). It is a tracer for the increased amino acid utilization by
tumors, as is carbon-11 (
11
C) methionine (see below), but it has a sig-
nificant advantage by virtue of its tumor-specific transport. Watanabe
et al. (71) reported a comparison between
18
FMT and
18
F-FDG in base-
line pretreatment musculoskeletal tumors. The study group comprised
75 patients with benign and malignant tumors and included three
patients (ages 14 to 34 years) with OS, a 12-year-old patient with ES,
and adult patients with chondrosarcoma and giant cell tumor. All
malignant bone tumors showed
18
FMT uptake. Of note, there was also
uptake within a pulmonary metastasis from OS. There was higher
uptake in malignant lesions than benign, and there was good correla-
tion with
18
F-FDG uptake. Using
18
FMT mean SUV cutoff of 1.2 to dif-
ferentiate benign vs. malignant lesions, the diagnostic accuracy was
81.3%, which was higher than the respective analysis for
18
F-FDG. Thir-
teen of 18 lesions that were false positive on
18
F-FDG were found to
have an
18
FMT mean SUV lower than the cutoff and would have been
correctly classified as benign. However,
18
FMT was found to be inferior
for grading of malignancy. It was suggested that the lower absolute
values and ranges of its mean SUV were responsible. In summary,
another promising alternative to
18
F-FDG and more studies are
awaited.
Fluorine-18 fluoro-3¢-deoxy-3¢-L-fluorothymidine
Fluorine-18 fluoro-3¢-deoxy-3¢-L-fluorothymidine (FLT) has been
developed as a proliferative tracer to provide a noninvasive staging
tool and to measure response to anticancer therapy (72). Proliferating
cells synthesize DNA during the S phase of the cell cycle. FLT is a
pyrimidine analogue and uses the salvage pathway of DNA synthesis
for imaging proliferation. The ability to image cell proliferation may
offer the possibility to differentiate between benign and malignant
disease. FLT is taken up by the cell via passive diffusion and facilitated
transport by Na
+
-dependent carriers. FLT is then phosphorylated by
thymidine kinase (TK) into FLT monophosphate, after which it is
trapped in the cell. Preliminary comparisons with FDG show that FLT
can visualize malignant cancers but at a lower sensitivity than FDG.
Some tumors metabolically rely on the de novo synthesis of DNA pre-
cursors, resulting in little or no uptake of thymidine and FLT. As a pro-
liferative marker, because FLT is phosphorylated by TK, which has
high activity in the S phase of cell synthesis. There are higher concen-
trations of FLT in malignant cells compared to normal cells. There have
been several reports of strong correlation of FLT with other prolifera-
tive markers (Ki-67 index). As tumor mass heterogeneity is visualized,
there is the potential for determining optimal biopsy sites (Fig. 15.8).
R. Howman-Giles et al. 293
294 Chapter 15 Primary Bone Tumors
13 14
12 13
Figure 15.8. Fluorine-18 fluoro-3¢-deoxy-3¢-L-fluorothymidine (FLT) in sar-
coma. Following radiotherapy for a synovial sarcoma of the left hip, this ado-
lescent boy developed progressive right lung metastases and bilateral pleural
effusions.
18
F-FLT-PET scanning demonstrates heterogeneous uptake in the
opacified right hemithorax with very low uptake in the bilateral basal pleural
effusions and in areas of necrotic tumor but relatively high uptake at the
periphery of solid tumoral deposits indicating active proliferation. Note the
high uptake in the bone marrow with the exception of the irradiated left hip,
where there is no uptake consistent with local marrow ablation. High uptake
in the kidneys and liver reflect normal excretion but limit detection of metasta-
tic disease in these organs. The spleen is also visualized, displaced inferiorly
and medially by the left basal pleural effusion. In our experience, the spleen
is not normally visualized in adults except in cases of extramedullary
hematopoiesis or malignant infiltration.
In the initial data on assessment of response to anticancer therapy, FLT
uptake has been shown to decrease after some therapy but may
increase after other types. This would most likely be due to the various
metabolic actions of the different chemotherapeutic agents. Prelimi-
nary studies using FLT have been reported in various tumors, includ-
ing soft tissue sarcoma. Cobben et al. (73) found correlations among
SUV and T/NT and mitotic score, Ki-67, and the French and Japanese
grading systems. Visualization of the tumors was good, and FLT was
able to differentiate between low- and high-grade tumors. However, no
differentiation could be made between benign and low-grade tumors.
This agent appears promising and potentially may be useful in primary
bone tumors. However, further research is needed to clarify the value
of FLT in cancer management. High uptake of FLT in normal prolifer-
ating marrow may limit sensitivity for detection of bone metastases
and for evaluating the extent of marrow spread in marrow-containing
regions of the skeleton. This poses a potential limitation, particularly
in pediatric patients, because of more extensive appendicular marrow
than seen in adults (72,73).
Carbon-11–Based Tracers
Carbon-11–labeled methionine (
11
C-Met) was developed as a tracer
for the increased amino acid metabolism in tumors. There are few
studies on extracranial tumors, in part because of its participation in
too many metabolic pathways to allow kinetic modeling (74). Of the
published studies of
11
C-Met, only a few relate to primary bone tumors.
Inoue et al. (75) studied 24 adult patients with clinically suspected
recurrent or residual tumors, using
11
C-Met and
18
F-FDG-PET. Their
group included one case of proven recurrent pelvic ES where
11
C-Met
was false negative but was detected by
18
F-FDG. Both PET agents were
false negative in one case of recurrent pelvic chondrosarcoma, but both
were true positive in two cases of recurrent giant cell tumor. Therefore,
the early report card for
11
C-Met is mixed; it is not clearly superior to
18
F-FDG.
Methyl-C-11 choline (
11
C-choline) takes advantage of increased
tumor requirements for choline, which is phosphorylated, integrated
within lecithin, and finally becomes a component of the phospholipid
cell membrane (76). After injection, tumor uptake equilibrates at 5
minutes, allowing earlier image acquisition than is the case with
18
F-
FDG. Another potential advantage of
11
C-choline is that it does not
accumulate in the bladder compared with the usual urinary excretion
of FDG, a consideration when evaluating pelvic lesions. The applica-
tion to bone and soft tissue tumors has been published in two articles
from the Gunma University group comparing
11
C-choline and
18
F-FDG-
PET scans, with what appears to be some overlap of both study
samples (77,78). Yanagawa et al. (77) reported only patients at pre-
treatment baseline. Their first group included 5 ranging in age from 11
to 20 years with OS. Zhang et al. (78) appear to have included some
patients undergoing therapy, but the 2 scans were acquired within 2
weeks of each other with no change in therapy. This second group
R. Howman-Giles et al. 295
included 2 older patients with OS and 2 patients (17 and 24 years old)
with ES. Both studies included other benign and malignant tumors. All
malignant tumors showed
11
C-choline uptake, and their mean tumor
SUV was higher than benign tumors.
11
C-choline uptake showed good
correlation with
18
F-FDG uptake. However, significant
11
C-choline
uptake was also seen in some benign tumors in both study groups, viz.
giant cell tumor, desmoid tumor, fibroma, neurofibroma, inflammatory
granulation tissue, and pigmented villonodular synovitis. When ana-
lyzing the ability of
11
C-choline to differentiate benign from malignant
lesions, both groups used different mean SUV cutoff values—2.7 for a
diagnostic accuracy of 90.9% (77) and 2.59 for a diagnostic accuracy of
75.6% (78). The differing result was attributed to the inclusion of more
benign lesions in the latter analysis. However, when compared with
the respective
18
F-FDG mean SUV cutoffs in a receiver operating char-
acteristic analysis, both studies found that
11
C-choline had a higher
diagnostic accuracy. In summary, if
11
C-choline becomes more widely
available, it may be a useful alternative to
18
F-FDG. It may have a
problem-solving role in tumors located near the urinary bladder and
possibly in cases where there is uncertainty about benign vs. malignant
pathology. Newer fluorinated choline analogues (79) are of interest and
may be more practical for clinical use due to a longer physical half-life.
Technical Issues
In oncology, radiation dosimetry from diagnostic imaging tests is a
more important consideration for pediatric than for adult patients
because of a generally higher survival rate and a longer potential
period of life to manifest adverse consequences of radiation exposure
in children, as well as issues of differential susceptibility to the effects
of radiation. Accordingly, minimization of radiation dose is an impor-
tant consideration in the pediatric population. Although PET utilizes
isotopes with relatively high gamma photon energy (511keV) and with
a particulate (positron) emission, the short half-life of
18
F and other PET
tracers offer significant advantages compared to other competing
tracers used for oncologic imaging, such as
201
Tl and
67
Ga. The high
sensitivity of PET generally allows administration of relatively small
doses of radiotracer to pediatric patients, particularly if three-
dimensional (3D) imaging is performed. Although 3D body imaging
using PET can be degraded by a significant scatter fraction in adults,
this is seldom an issue in children. We believe that 3D acquisition is
preferable, if available, for imaging children less than 60kg in weight.
Sensitive PET detectors like thick sodium iodide crystals used in the
C-PET (Philips [Milpitas, California]) and various modified gamma
cameras have particular appeal for pediatric patients, although their
performance is somewhat compromised in larger patients compared to
modern bismuth germanate oxide (BGO) and lutetium oxyorthosilicate
(LSO) based PET scanners. The incremental benefits of PET-CT in
terms of diagnostic confidence and localization ability also need to be
balanced with the additional radiation burden of adding a helical CT
296 Chapter 15 Primary Bone Tumors
acquisition to the PET procedure. Low-dose CT acquisitions yield very
good quality CT for correlation and attenuation correction purposes in
our opinion.
Conclusion
Positron emission tomography imaging with
18
F-FDG has been shown
to significantly impact patient management in primary bone tumors by
improving the initial diagnosis with more accurate staging, determin-
ing whether there is metastatic disease, providing an
accurate indica-
tor of response to treatment, detecting early recurrence, and finally by
providing an accurate indicator for patient prognosis. The most effi-
cient method is a combination o
f PET with other anatomic imaging
modalities, that is, CT and MRI. Several other PET radiopharmaceuti-
cals also show great promise. For the medical imaging evaluation of
primary bone tumors in our young patients, the already essential role
of PET is likely to expand further with newer developments and appli-
cations. Recognition that PET, as a molecular imaging technique, is
more about lesion characterization than lesion counting will enable
realistic expectations of how and when to use PET in the diagnostic
process. With such a disparate range of diseases, outcomes, and thera-
peutic options, we believe that prognostic stratification may well be the
most important function provided by PET.
References
1.Phan A, Patel S. Advances in neoadjuvant chemotherapy in soft tissue sar-
comas. Curr Treat Options Oncol 2003;4(6):433–439.
2. Bacci G, Lari S. Current treatment of high grade osteosarcoma of the
extremity: review. J Chemother 2001;13(3):235–243.
3. Ballo MT, Zagars GK. Radiation therapy for soft tissue sarcoma. Surg Oncol
Clin North Am 2003;12:449–467.
4.Meyers PA, Gorlick R. Osteosarcoma. Pediatr Clin North Am 1997;4:
973–989.
5. Grier H
E. The Ewing family of tumors. Pediatr Clin North Am 1997;4:
991–1104.
6. Mirra JM. Osteosarcoma: intramedullary variants. In: Mirra JM, ed. Bone
Tumors. Philadelphia: Lea & Febiger, 1989:249–389.
7. Mirra JM, Picci P. Ewing’s sarcoma. In: Mirra JM, ed. Bone Tumors.
Philadelphia: Lea & Febiger, 1989:1087–1117.
8. Arndt CAS, Crist WM. Common musculoskeletal tumors of childhood and
adolescence. N Engl J Med 1999;341(5):342–352.
9. Rodriguez-Galindo C, Spunt SL, Pappo AS. Tr
eatment of Ewing sarcoma
family of tumors: current status and outlook for the future. Med Pediatr
Oncol 2003;40:276–287.
10. Bruland OS, Pihl A. On the current management of osteosarcoma: a criti-
cal evaluation and a proposal for a modified treatment strategy. Eur J
Cancer 1997;33:1725–1731.
11. Raymond AK, Chawla SP, Carrasco CH, et al. Osteosarcoma chemotherapy
effect: a progno
stic factor. Semin Diagn Pathol 1987;4:212–236.
R. Howman-Giles et al. 297
12. Eary JF, Conrad EU, Bruckner JD, et al. Quantitative [F-18]
fluorodeoxyglucose positron emission tomography in pretreatment and
grading of sarcoma. Clin Cancer Res 1998;4:1215–1220.
13. Brenn
er W, Bohuslavizki KH, Eary JF. PET imaging of osteosarcoma. J Nucl
Med 2003;44(6):930–942.
14.Messa C, Landoni C, Pozzato C, Fazio F. Is there a role for FDG PET in
the diagnosis of musculoskeletal neoplasms? J Nucl Med 2000;41(10):
1702–1703.
15. Oliveira AM, Nascimento AG. Grading in soft tissue tumors: principles and
problems. Skeletal Radiol 2001;30:543–559.
16. Hicks RJ. Nuclear medicine techniques provide unique physi
ologic char-
acterization of suspected and known soft tissue and bone sarcomas. Acta
Orthop Scand 1997;273(suppl):25–36.
17. Hicks RJ. Functional imaging techniques for evaluation of sarcomas.
Canc
er Imaging 2005;5:58–65.
18. Hicks RJ, Toner G, Choong PFM. Clinical applications of molecular
imaging in sarcoma evaluation. Cancer Imaging 2005;5:66–72.
19. Miller SL, Hoffer FA. Malignant and benign bone tumors. Radiol Clin
No
rth Am 2001;39:673.
20. Siegel MJ. Magnetic resonance imaging of musculoskeletal soft tissue
masses. Radiol Clin North Am 2001;39:701–720.
21. Rosen G, Caparros B, Groshen S. Primary osteogenic sarcoma of th
e femur:
a model for the use of preoperative chemotherapy in high risk malignant
tumours. Cancer Invest 1984;2:181–192.
22. Picci P, Rougraff BT, Bacci G, et al. Prognostic significance of histopatho-
logic response to chemotherapy in non metastatic Ewing sarcoma of the
extremity. J Clin Oncol 1993;11:1763–1769.
23. San-Julian M, Dolz R, Garcia-Barrecheguren E, et al. Limb salvage in bone
sarcomas in pa
tients younger than age 10. J Pediatr Orthop 2003;23:
753–762.
24. Wodajo FM, Bickels J, Wittig J, Malawer M. Complex reconstruction in the
management of extremity sarcomas. Curr Opinion Oncol 2003;15:304–312.
25. Picci P, Sangiorgi L, Rougraff BT, et al. Relationship of chemotherapy-
induced necrosis and surgical margins to local recurrence in osteosarcoma.
J Clin Oncol 1994;12:2699–2705.
26.Glasser D, Lane J, Huvo
s A, et al. Survival, prognosis and therapeutic
response in osteogenic sarcoma: the Memorial Hospital experience. Cancer
1992;69:698–708.
27. Townsend DW, Beyer T, Blodgett TM. PET/CT scanners: a hardware
approach to image fusion. Semin Nucl Med 2003;33:193–204.
28. Kern KA, Brunetti A, Norton JA, et al. Metabolic imaging of human extrem-
ity musculoskeletal tumors by PET. J Nucl Med 1988;29:181–186.
29.Adler LP, Blair HF, Makley JT, et al. Noninvasive grading of muscu-
loskeletal tumors using PET. J Nucl Med 1991;32(8):1508–1512.
30.Hoh CK, Hawkins RA, Glaspy JA, et al. Cancer detection with whole-body
PET using 2–[
18
F]fluoro-2–deoxy-D-glucose. J Comput Assist Tomogr
1993;17:582–589.
31. Eary JF, O’Sullivan F, Powitan Y, et al. Sarcoma tumor FDG uptake mea-
sured by PET and patient outcome: a retrospective analysis. Eur J Nucl Med
Mol Imaging 2002;29(9):1149–1154.
32.Folpe AL, Lyles RH, Sprouse JT, Conrad EU III, Eary JF. (F-18) fluo-
rodeoxyglucose positron emission tomography as a predictor of pathologic
grade and other prognostic variables in bone and soft tissue sarcoma. Clin
Cancer Res 2000;6(4):1279–1287.
298 Chapter 15 Primary Bone Tumors
33. Schulte M, Brecht-Krauss D, Heymer B, et al. Grading of tumors and
tumorlike lesions of bone: evaluation by FDG PET. J Nucl Med 2000;
41(10):1695–1701.
34.Feldman F, van Heertum R, Manos C. 18FDG PET sca
nning of benign and
malignant musculoskeletal lesions. Skeletal Radiol 2003;32(4):201–208.
35. Dimitrakopoulou-Strauss A, Strauss LG, Heichel T, et al. The role of quan-
titative (18)F-FDG PET studies for the differentiation of malignant and
benign bone lesions. J Nucl Med 2002;43(4):510–518.
36.Aoki J, Watanabe H, Shinozaki T, et al. FDG PET of primary benign and
malignant bone tumors: stan
dardized uptake value in 52 lesions. Radiol-
ogy 2001;219(3):774–777.
37. Watanabe H, Shinozaki T, Yanagawa T, et al. Glucose metabolic analysis of
musculoskeletal tumours using 18-fluorine-FDG PET as an aid to preoper-
ative planning. J Bone Joint Surg [Br] 2000;82(5):760–767.
38. Kole AC, Nieweg OE, Hoekstra HJ, van Horn JR, Koops HS, Vaalburg W.
Fluorine-18–fluorodeoxyglucose assessment of glucose metabolism in bone
tumors. J Nucl Med 1998;39(5):810–815.
39.Franzius C, Bielack S, Flege S, Sciuk J, Jurgens H, Schober O. Prognostic
significance of (18)F-FDG and (99m)Tc-methylene diphosphonate uptake
in primary osteosarcoma. J Nucl Med 2002;43(8):1012–1017.
40. Jaramillo D, Laor T, Gebhardt MC. Pediatric musculoskeletal neoplasms:
evaluation with MR imaging. MRI Clin North Am 1996;4(4):749–770.
41. Schulte M, Brecht-Krauss D, Werner M,
et al. Evaluation of neoadjuvant
therapy response of osteogenic sarcoma using FDG PET. J Nucl Med
1999;40(10):1637–1643.
42.Franzius C, Daldrup-Link HE, Sciuk J, et al. FDG-PET for detection of pul-
monary metastases from malignant primary bone tumors: comparison
with spiral CT. Ann Oncol 2001;12:479–486.
43. Lucas JD, O’Doherty MJ, Wong JC, et al. Evaluation of fluorodeoxyglucose
positron emissio
n tomography in the management of soft-tissue sarcomas.
J Bone Joint Surg [Br] 1998;80:441–447.
44. Pitman AG, Hicks RJ, Binns DS, et al. Performance of sodium iodide based
18
F-fluorodeoxyglucose positron emission tomography in the characterisa-
tion of indeterminate pulmonary nodules or masses. Br J Radiol
2002;75:114–121.
45.Franzius C, Sciuk J, Daldrup-Link HE, Jurgens H, Schober O. FDG-PET for
detection of osseous metastases from malignant primary bone tumours:
comparison with bone scintigraphy. Eur J Nucl Med 2000;27(9):1305–1311.
46.Franzius C, Daldrup-Link HE, Wagner-Bohn A, et al. FDG-PET for detec-
tion of recurrences from malignant primary bone tumors: comparison with
conventional imaging. Ann Oncol 2002;13:157–160.
47. Daldrup-Link HE, Franzius C, Link TM, et al. Whole-body MR imaging for
detection of bone metastases in children and young adults: comparison
with skeletal scintigraphy and FDG PET. AJR 2001;177(1):229–236.
48. Tacikowska M. Dynamic magnetic resonance imaging in soft tissue
tumors—assessment of the diagnostic value of tumor enhancement rate
indices. Med Sci Monitor 2002;8(4):MT53–MT57.
49.Negendank WG. MR spectroscopy of musculoskeletal soft-tissue tumors.
MRI Clin North Am 1995;3:713–725.
50.Kostakoglu L, Panicek DM, Divgi CR, et al. Correlation of the findings of
thallium-201 chloride scans with those of other imaging modalities and his-
tology following therapy in patients with bone and soft tissue sarcomas
[erratum in Eur J Nucl Med 1996;23(11):1558]. Eur J Nucl Med 1995;22(11):
1232–1237.
R. Howman-Giles et al. 299
51. Jones DN, McCowage GB, Sostman HD, et al. Monitoring of neoadjuvant
therapy response of soft-tissue and musculoskeletal sarcoma using fluo-
rine-18–FDG PET. J Nucl Med 1996;37(9):1438–1444.
52.Franzius C, Sciuk
J, Brinkschmidt C, Jurgens H, Schober O. Evaluation of
chemotherapy response in primary bone tumors with F-18 FDG positron
emission tomography compared with histologically assessed tumor ne
cro-
sis. Clin Nucl Med 2000;25(11):874–881.
53. Hawkins DS, Rajendran JG, Conrad EU III, Bruckner JD, Eary JF. Evalua-
tion of chemotherapy response in pediatric bone sarcomas by [F-18]-
fluorodeoxy
-D-glucose positron emission tomography [erratum appears in
Cancer 2003;97(12):3130]. Cancer 2002;94(12):3277–3284.
54. Larson SM, Erdi Y, Akhurst T, et al. Tumor treatment response based on
visual and quantitative changes in global tumor glycolysis using PET-FDG
imaging: the Visual Response Score and the change in total lesion glycol-
ysis. Clin Positron Imaging 1999;2(3):159–171.
55.Nair N, Ali A, Green AA, et al. Response of osteosarcoma to chemother-
apy: evaluation with F-18 FDG-PET scans. Clin Positron Imaging 2000;3:
79–83.
56.Ma LD, Frassica FJ, Scott WW, et al. Differentiation of benign and malig-
nant musculoskeletal tumors: potential pitfalls with MR imaging. Radi-
ographics 1995;15:349–366.
57. Garcia R, Kim EE, Wong FC, et al. Comparison of fluorine-18–FDG PET
and technetium-99m-MIBI SPECT in evaluation o
f musculoskeletal sarco-
mas. J Nucl Med 1996;37(9):1476–1479.
58. el-Zeftawy H, Heiba SI, Jana S, et al. Role of repeated F-18 fluo-
rodeoxyglucose imaging in management of patients with bone and soft
tissue sarcoma. Cancer Biother Radiopharm 2001;16(1):37–46.
59.Fletcher BD. Imaging pediatric bone sarcomas: diagnosis and treatment
related issues. Radiol Clin North Am 1997;35:1477–1494
.
60.Hains SF, O’Doherty MJ, Lucas JD, Smith MA. Fluorodeoxyglucose PET in
the evaluation of amputations for soft tissue sarcoma. Nucl Med Commun
1999;20(9):845–848.
61. Blau M, Nagler W, Bender MA. Fluorine-18: a new isotope for bone scan-
ning. J Nucl Med 1962;3:332–334.
62. Schiepers C, Nuyts J, Bormans G, et al. Fluoride kinetics of the axial skele-
ton measured in vivo with fluorine-18–fluoride PET. J Nucl Med 1997;
38(12
):1970–1976.
63. Hoh CK, Hawkins RA, Dahlbom M, et al. Whole body skeletal imaging
with [18F]fluoride ion and PET. J Comput Assist Tomogr 1993;17(1):34–41.
64.Cook GJ, Fogelman I. Detection of bone metastases in cancer patients by
18F-fluoride and 18F-fluorodeoxyglucose positron emission tomography.
Q J Nucl Med 2001;45(1):47–52.
65. Schirrmeister H, Guhlmann A, Kotzerke J, et al. Early detection and accu-
rate description of extent of metastatic bone disease in breast cancer with
fluoride ion and positron emission tomography. J Clin Oncol 1999;
17(8):2381–2389.
66. Schirrmeister H, Glatting G, Hetzel J, et al. Prospective evaluation of the
clinical value of planar bone scans, SPECT, and (18)F-labeled NaF PET in
newly diagnosed lung cancer. J Nucl Med 2001;42(12):1800–1804.
67. Schirrmeister H, Guhlmann A, Elsner K, et al. Sensitivity in detecting
osseous lesions depends on anatomic localization: planar bone scintigra-
phy versus 18F PET. J Nucl Med 1999;40(10):1623–1629.
68. Even-Sapir E, Metser U, Flusser G,
et al. Assessment of malignant skeletal
disease: initial experience with 18F-fluoride PET/CT and comparison
300 Chapter 15 Primary Bone Tumors
between 18F-fluoride PET and 18F-fluoride PET/CT. J Nucl Med 2004;
45(2):272–278.
69. Jager PL, Franssen EJ, Kool W, et al. Feasibility of tumor imaging using L-
3–[iodine-123]-iodo-alpha-methyl-tyrosine in extra
cranial tumors. J Nucl
Med 1998;39(10):1736–1743.
70.Tomiyoshi K, Amed K, Muhammad S, et al. Synthesis of isomers of
18
F-labelled amino acid radiopharmaceutical: position 2- and 3-L-
18
F-
alpha-methyltyrosine using a separation and purification system. Nucl
Med Commun 1997;18(169):175.
71. Watanabe H, Inoue T, Shinozaki T, et al. PET imaging of musculoskeletal
tumours with fluorine-1
8 alpha-methyltyrosine: comparison with fluorine-
18 fluorodeoxyglucose PET. Eur J Nucl Med 2000;27(10):1509–1517.
72. Been LB, Suurmeijer AJH, Cobben DCP, et al. [F18]FLT-PET in oncology:
current status and opportunities. Eur J Nucl Med Mol Imaging 2004;
31:1659–1672.
73. Cobben DC, Elsinga PH, Suurmeijer AJH, et al. Detection and grading
of soft tissue sarcomas of the extremities with (18)F-fluoro-3¢-deoxy-L-
thymidine. Clin Cancer Res 2004;10:1685–1690.
74. Ishiwata K, Enomoto K, Sasaki T, et al. A feasibility study on L-[1-carbon-
11]tyrosine and L-[methyl-carbon-11]methionine to assess liver protein
synthesis by PET. J Nucl Med 1996;37(2):279–285.
75.Inoue T, Kim EE, Wong FC, et al. Comparison of fluorine-18-
fluorodeoxyglucose and carbon-11-methionine PET in detection of malig-
na
nt tumors. J Nucl Med 1996;37(9):1472–1476.
76.Hara T, Yuasa M. Automated synthesis of [11C]choline, a positron-emitting
tracer for tumor imaging. Appl Radiat Isotopes 1999;50(3):531–533.
77. Yanagawa T, Watanabe H, Inoue T, et al. Carbon-11 choline positron emis-
sion tomography in musculoskeletal tumors: comparison with fluorine-18
fluorodeoxyglucose positron emission tomography. J Comput Assist
Tomogr 2003;2
7(2):175–182.
78. Zhang H, Tian M, Oriuchi N, et al. 11C-choline PET for the detection of
bone and soft tissue tumours in comparison with FDG PET. Nucl Med
Commun 2003;24(3):273–279.
79. De Grado TR, Coleman RE, Wang S, et al. Synthesis and evaluation of
18
F-
labelled choline as an oncologic tracer for positron emission tomography:
initial findings in prostate cancer. Cancer Res 2001;61:110–117.
R. Howman-Giles et al. 301
16
Soft Tissue Sarcomas
Marc P. Hickeson
Soft tissue sarcomas are a heterogeneous group of malignant neo-
plasms of mesenchymal origin. They account for approximately 1% of
all cancer diagnoses and 7% of pedia
tric malignancies (1,2). Just over
half of these patients eventually succumb as a result of the disease. Soft
tissue sarcomas typically present as asymptomatic large masses within
the retroperitoneum or the proximal lower limbs but can also affect
other sites of the body. In adults, the most common histologic origins
are liposarcomas (21%), malignant fibrous histiocytomas (MFHs)
(20%), leiomyosarcomas (20%), fibrosarcomas (11%), and tendosyn-
ovial sarcomas (10%) (3). In children, rhabdomyosarcoma comprise
approximately 70% of the soft tissue sarcomas (3). Despite this highly
variable histopathologic origin, the three negative predictive factors at
the time of initial diagnosis for disease-free survival are primary site
in the superficial trunk or in the limbs, high tumor grade, and large
tumor size, rather than the histologic origin (4).
Roles of PET
For soft tissue sarcomas, positron emission tomography (PET) has been
shown to be useful in the following capacities:
1. Evaluation of the primary lesion
2. Staging of the disease
3. Monitoring therapy and detection of recurrence
4.Prognostic information
Evaluation of the Primary Lesion
Correct diagnosis of the soft tissue sarcoma is important because treat-
ment is effective for many if diagnosed early. However, benign soft
tissue masses can appear very similar to soft tissue sarcoma on physi-
cal examination and radiologic investigation. The most specific method
to diagnose sarcoma is by biopsy. An alternative noninvasive method
is PET with fluorine-18 (
18
F)-fluorodeoxyglucose (FDG), which has
302