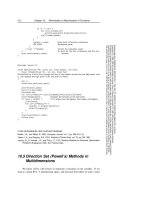
Tài liệu HPLC for Pharmaceutical Scientists 2007 (Part 6) pptx
Bạn đang xem bản rút gọn của tài liệu. Xem và tải ngay bản đầy đủ của tài liệu tại đây (261.66 KB, 17 trang )
6
SIZE-EXCLUSION
CHROMATOGRAPHY
Yuri Kazakevich and Rosario LoBrutto
6.1 SEPARATION OF THE ANALYTE MOLECULES
BY THEIR SIZE
Size-exclusion chromatography (SEC) separates polymer molecules and bio-
molecules based on differences in their molecular size.The separation process
in simplified form is based on the ability of sample molecules to penetrate
inside the pores of packing material and is dependent on the relative size of
analyte molecules and the respective pore size of the absorbent. The process
also relies on the absence of any interactions with the packing material surface.
Two types of SEC are usually distinguished:
1. Gel permeation chromatography (GPC)—separation of synthetic
(organic-soluble) polymers. GPC is a powerful technique for polymer
characterization using primarily organic solvents.
2. Gel filtration chromatography (GFC)—separation of water-soluble
biopolymers. GFC uses primarily aqueous solvents (typically for
aqueous soluble polymers, proteins, etc.).
Physical and chemical properties of polymers are dependent on their molec-
ular weight and molecular weight distribution.The separation principle in SEC
is based on the forced transport of the polymer molecules through the porous
stationary-phase media under the conditions of suppressed interactions of the
263
HPLC for Pharmaceutical Scientists, Edited by Yuri Kazakevich and Rosario LoBrutto
Copyright © 2007 by John Wiley & Sons, Inc.
polymer analyte with the surface. The mobile-phase eluent is selected in such
way that it interacts with the surface of packing material stronger than the
polymer.Under these conditions, the smaller the size of the molecule, the more
it is able to penetrate inside the pore space and the movement through the
column is retarded. On the other hand, the bigger the molecular size, the
higher the probability the molecule will travel around the particles of
the packing material and, thus, is eluted earlier. The molecules are separated
in order of decreasing molecular weight, with the largest molecules eluting
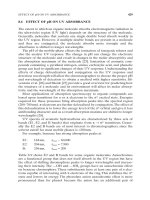
from the column first and smaller molecules eluting last (Figure 6-1).
Molecules larger than the pore size do not enter the pores and elute
together as the first peak in the chromatogram and this is called total exclu-
sion volume which defines the exclusion limit for a particular column. Mole-
cules that can enter the pores diffuse into the internal pore structure of the
gel to an extent depending on their size and the pore size distribution of the
264 SIZE-EXCLUSION CHROMATOGRAPHY
Figure 6-1. Illustrative description of separation in SEC
.
gel. The molecules will have an average residence time in the particles that
depends on the molecules size and shape in the particular mobile phase.There-
fore, different molecules have different total residence times in the column.
This portion of a chromatogram is called the selective permeation region (the
effective volume in which separation can occur). Molecules that are smaller
than the pore size can enter all pores, have the longest residence time on the
column, and will elute all together as the last peak in the chromatogram. This
last peak in the chromatogram determines the total permeation limit for a par-
ticular column. The largest elution volume (retention volume) in any given
SEC column is equal to the total mobile-phase volume in the column (known
as the void volume, V
0
).The exclusion range indicates the molecular weight of
solutes above which all solutes having a molecular weight greater than the
exclusion limit.These analytes will elute at the same retention time as a single
peak. A specific column can be used for separation of solutes with molecular
weights that are within the molecular weight window between the exclusion
and permeation limits (Figure 6-2).
Separation process in SEC is based on the actual size of the molecules,
which in turn reflects the molecular weight of the polymer.The resulting SEC
SEPARATION OF THE ANALYTE MOLECULES BY THEIR SIZE 265
Figure 6-2. Elution of analytes in SEC
. (Reprinted with permission from reference 1.)
chromatogram reflects the size distribution of the polymer sample, and its rela-
tionship with the molecular weight distribution which lays the foundation of
the SEC theory.
6.2 MOLECULAR SIZE AND MOLECULAR WEIGHT
A polymer molecule in solution has a certain shape that strongly depends on
the type of polymer, type of solvent, temperature, and other conditions.
Usually a polymer forms some kind of globular species whose size is depen-
dent on the degree of solvation by solvent molecules.
This globe could be described by its volume (v) and hydrodynamic
radius (R).
Hydrodynamic radius (radius of gyration) of the polymer in the solution
could be expressed in the form
(6-1)
where [η] is intrinsic viscosity and M is molecular weight.
For some polymers that are not flexible, the effective R is used to represent
the radius of the sphere. The parameter R is equivalent to the mechanical
behavior of the polymer in solution. Viscosity is the simplest parameter of the
polymer solution. From the Stokes and Einstein equations, the volume of the
equivalent sphere is proportional to the product of intrinsic viscosity and
polymer molecular weight:
(6-2)
where [η] is intrinsic viscosity, M is molecular weight, N
A
is Avogadro’s number,
and v is the volume of the equivalent sphere.As one could see, the intrinsic vis-
cosity is an important parameter related to the molecular weight of the polymer
and its molecular volume. By definition, intrinsic viscosity is a limit of the ratio
of the specific viscosity of the polymer solution to its concentration at c → 0,
or it is the y-intercept of the dependence of η
sp
versus concentration.
Polymer molecules of a different nature but with the same molecular weight
usually have different hydrodynamic radii.This is due to the differences in coil
flexibility, intramolecular interactions, and, most importantly, the differences
in their interactions with the solvent. This essentially means that if two differ-
ent polymers analyzed at identical SEC conditions show similar peaks with
identical elution volume, it does not confirm that the molecular weights of
these polymers are identical. It only indicates that at the given conditions the
gyration radii of the molecules are the same, causing similar elution.
The nature of the solvent also has a significant effect on the polymer
conformation and thus on its gyration radius and molecular volume. If the
h
[]
=MNv
A
25.
RM=
[]
3
4
1
3
ph
266 SIZE-EXCLUSION CHROMATOGRAPHY
solvent–polymer interactions are favorable or essentially prevailing over the
interactions between different segments of the same polymer, then we can
expect a high degree of solvation and the polymer globe will swell. For
instance, if polystyrene is dissolved in toluene, due to the similar nature of
the solvent and polystyrene monomer, toluene will solvate polymer molecules
and their gyration radius increases. On the contrary, if the same polystyrene
is dissolved in tetrahydrofuran (THF), then interactions between polystyrene
segments prevail over the interactions with THF. As a consequence, the size
of the polymer globe in THF is relatively small, especially in comparison to
that in toluene.
From equation (6-2), one can conclude that intrinsic viscosity is propor-
tional to the polymer molecular volume. On the other hand, the effective mol-
ecular volume is also the function of the molecular weight and the type of used
solvent (or the nature of the solvent–polymer and polymer–polymer interac-
tions). The intrinsic viscosity is an exponential function of the molecular
weight with fixed coefficients for any specific polymer and solvent.
(6-3)
This expression is known as the Mark–Houwink equation, and K and α are
constants for any given pair of polymer and solvent. These constants are
tabulated and could be found for most known polymers in reference 2.
6.3 SEPARATION MECHANISM
Eluent flow through the chromatographic column packed with porous packing
material has a velocity distribution depending on the pathway. Flow around
the adsorbent particles is the fastest. Flow through the pore space is much
slower. Since the smallest molecules can penetrate all of the pores, they can
be distributed in the whole liquid volume of the column and their average
migration speed is therefore the slowest. Molecules of intermediate size may
penetrate into the pore space but may not come close to the pore walls, so
their center of mass will be allocated closer to the center of the pores where
flow velocity is higher. Their average migration speed is higher. The biggest
molecules experience steric hindrance in permeation inside the packing pore
space and move through the column primarily around the particles with the
fastest possible speed. As a result, the biggest molecules come out of the
column first, and the smallest ones come out last.
Obviously, all molecules that are not able to penetrate into the pore space,
move with the same velocity. Retention volume of all these molecules is the
same and is called exclusion volume, also known as total exclusion. The total
exclusion volume is a characteristic of a particular column which determines
its upper separation limit.
h
[]
=⋅KM
α
SEPARATION MECHANISM 267
6.4 CALIBRATION
SEC calibration establishes the relationship of a particular elution volume
with specific molecular weight of the polymer (Figure 6-3) [3]. For calibration
the elution volume of the solutions of polymer standards with known narrow
molecular weight distributions are measured. An example of a separation is
shown in Figure 6-4 [4]. In SEC, hydrodynamic volume of the polymer mole-
cules is being measured rather than the actual mass of a particular species.The
hydrodynamic volume is the space a particular polymer molecule occupies
when it is in solution. The molecular weight can be approximated from SEC
data from the relationship between molecular weight and hydrodynamic
volume for particular known standards. However, the relationship between
hydrodynamic volume and molecular weight is not the same for all polymers,
so only an approximate measurement can be obtained.
A series of commercially available polystyrene standards can be used for
calibration. The elution volume (elution time multiplied by flow rate) corre-
sponding to a particular peak in the chromatogram is related to the molecu-
lar weight of a particular polystyrene. After assignment of the molecular
weight for each component to its elution volume, the logarithms of the mole-
cular weight of the standards are plotted against their elution volumes in order
to construct a calibration curve (Figure 6-3). Each combination of column,
polymer, and solvent has its own calibration curve.
The same polymer molecules could have different sizes in different solvents,
and two molecules of different polymers might have the same size despite their
268 SIZE-EXCLUSION CHROMATOGRAPHY
Figure 6-3. Calibration curves for a set of
AquaGel (Polymer Laboratories) columns
designed for the separation of water soluble polymers. Calibration using PEO and PEG
standards. (Reprinted from reference 3, with permission from Polymer Laboratories
Inc.)