ASSESSING the ACCURACY of REMOTELY SENSED DATA - CHAPTER 5 ppt
Bạn đang xem bản rút gọn của tài liệu. Xem và tải ngay bản đầy đủ của tài liệu tại đây (576.94 KB, 22 trang )
©1999 by CRC Press
CHAPTER
5
Basic Analysis Techniques
This chapter presents the basic analysis techniques needed to perform an accu-
racy assessment. The chapter begins by discussing early non-site specific assess-
ments. Next, site specific assessment techniques employing the error matrix are
presented followed by all the analytical tools that proceed from it including com-
puting confidence intervals, testing for significant differences, and correcting area
estimates. A numerical example is presented through the entire chapter to aid in
understanding of the concepts.
NON-SITE SPECIFIC ASSESSMENTS
In a non-site specific accuracy assessment, only total areas for each category
mapped are computed without regard to the location of these areas. In other words,
a comparison between the number of acres or hectares of each category on the map
generated from remotely sensed data and the reference data is performed. In this
way, the errors of omission and commission tend to compensate for each other and
the totals compare favorably. However, nothing is known about any specific location
on the map or how it agrees or disagrees with the reference data.
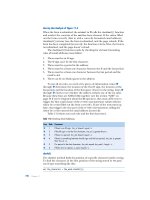
A simple example quickly demonstrates the shortcomings of the non-site specific
approach. Figure 5-1 shows the distribution of the forest category on both a reference
image and two different classifications generated from remotely sensed data. Clas-
sification #1 was generated using one type of classification algorithm (e.g., super-
vised, unsupervised, or nonparametric, etc.) while classification #2 employed a
different algorithm. In this example, only the forest category is being compared. The
reference data shows a total of 2,435 acres of forest while classification #1 shows
2,322 acres and classification #2 shows 2,635 acres. In a non-site specific assessment,
you would conclude that classification #1 is better for the forest category, because
the total number of forest acres for classification #1 more closely agrees with the
number of acres of forest on the reference image (2,435 acres – 2,322 acres = 113
acres difference for classification #1 while classification #2 differs by 200 acres).
L986ch05.fm Page 43 Monday, May 21, 2001 12:50 PM
©1999 by CRC Press
However, a visual comparison between the forest polygons on classification #1 and
the reference data demonstrates little locational correspondence. Classification #2,
despite being judged inferior by the non-site specific assessment, appears to agree
in location much better with the reference data forest polygons. Therefore, the use
of non-site specific accuracy assessment can be quite misleading. In the example
shown here, the non-site specific assessment actually recommends the use of the
inferior classification algorithm.
Figure 5-1 Example of non-site specific accuracy assessment.
L986ch05.fm Page 44 Wednesday, May 16, 2001 11:03 AM
©1999 by CRC Press
SITE SPECIFIC ASSESSMENTS
Given the obvious limitations of non-site specific accuracy assessment, there
was a need to know how the map generated from the remotely sensed data compared
to the reference data on a locational basis. Therefore, site specific assessments were
instituted. Initially, a single value representing the accuracy of the entire classifica-
tion (i.e., overall accuracy) was presented. This computation was performed by
comparing a sample of locations on the map with the same locations on the reference
data and keeping track of the number of times there was agreement.
An overall accuracy level of 85% was adopted as representing the cutoff between
acceptable and unacceptable results. This standard was first described in Anderson
et al. (1976) and seems to be almost universally accepted despite there being nothing
magic or even especially significant about the 85% correct accuracy level. Obviously,
the accuracy of a map depends on a great many factors, including the amount of
effort, level of detail (i.e., classification scheme), and the variability of the categories
to be mapped. In some applications an overall accuracy of 85% is more than sufficient
and in other cases it would not be accurate enough. Soon after maps were evaluated
on just an overall accuracy, the need to evaluate individual categories within the
classification scheme was recognized, and so began the use of the error matrix to
represent map accuracy.
The Error Matrix
As previously introduced, an error matrix is a square array of numbers set out in
rows and columns that express the number of sample units (pixels, clusters, or poly-
gons) assigned to a particular category in one classification relative to the number of
sample units assigned to a particular category in another classification (Table 5-1).
In most cases, one of the classifications is considered to be correct (i.e., reference
data) and may be generated from aerial photography, airborne video, ground obser-
vation or ground measurement. The columns usually represent this reference data,
while the rows indicate the classification generated from the remotely sensed data.
An error matrix is a very effective way to represent map accuracy in that the
individual accuracies of each category are plainly described along with both the
errors of inclusion (commission errors) and errors of exclusion (omission errors)
present in the classification. A commission error is simply defined as including an
area into a category when it does not belong to that category. An omission error is
excluding that area from the category in which it truly does belong. Every error is
an omission from the correct category and a commission to a wrong category.
For example, in the error matrix in Table 5-1 there are four areas that were
classified as deciduous when the reference data show that they were actually conifer.
Therefore, four areas were omitted from the correct coniferous category and com-
mitted to the incorrect deciduous category.
In addition to clearly showing errors of omission and commission, the error
matrix can be used to compute other accuracy measures, such as overall accuracy,
producer’s accuracy, and user’s accuracy (Story and Congalton 1986). Overall accu-
racy is simply the sum of the major diagonal (i.e., the correctly classified sample
L986ch05.fm Page 45 Wednesday, May 16, 2001 11:03 AM
©1999 by CRC Press
units) divided by the total number of sample units in the entire error matrix. This
value is the most commonly reported accuracy assessment statistic and is probably
most familiar to the reader. However, just presenting the overall accuracy is not
enough. It is important to present the entire matrix so that other accuracy measures
can be computed as needed.
Producer’s and user’s accuracies are ways of representing individual category
accuracies instead of just the overall classification accuracy. Before error matrices
were the standard accuracy reporting mechanism, it was common to report the overall
accuracy and either only the producer’s or user’s accuracy. A quick example will
demonstrate the need to publish the entire matrix so that all three accuracy measures
can be computed.
Studying the error matrix shown in Table 5-1 reveals an overall map accuracy
of 74%. However, suppose we are most interested in the ability to classify hardwood
forests, so we calculate a “producer’s accuracy” for this category. This calculation
is performed by dividing the total number of correct sample units in the deciduous
category (i.e., 65) by the total number of deciduous sample units as indicated by
the reference data (i.e., 75 or the column total). This division results in a “producer’s
accuracy” of 87%, which is quite good. If we stopped here, one might conclude
that although this classification appears to be average overall, it is very adequate
for the deciduous category. Making such a conclusion could be a very serious
mistake. A quick calculation of the “user’s accuracy” computed by dividing the
total number of correct pixels in the deciduous category (i.e., 65) by the total number
of pixels classified as deciduous (i.e., 115 or the row total) reveals a value of 57%.
In other words, although 87% of the deciduous areas have been correctly identified
Table 5-1 Example Error Matrix (same as presented in Figure 2-1)
©1999 by CRC Press
as deciduous, only 57% of the areas called deciduous on the map are actually
deciduous on the ground. A more careful look at the error matrix reveals that there
is significant confusion in discriminating deciduous from agriculture and shrub.
Therefore, although the producer of this map can claim that 87% of the time an
area that was deciduous on the ground was identified as such on the map, a user
of this map will find that only 57% of the time that the map says an area is deciduous
will it actually be deciduous on the ground.
Mathematical Representation of the Error Matrix
This section presents the error matrix in mathematical terms necessary to perform
the analysis techniques described in the rest of this chapter. The error matrix was
presented previously in descriptive terms including an example (Table 5-1) that
should help make this transition to equations and mathematical notation easier to
understand.
Assume that n samples are distributed into k
2
cells where each sample is assigned
to one of k categories in the remotely sensed classification (usually the rows) and,
independently, to one of the same k categories in the reference data set (usually the
columns). Let n
ij
denote the number of samples classified into category i (i = 1, 2,
…, k) in the remotely sensed classification and category j (j = 1, 2, …, k) in the
reference data set (Table 5-2).
Table 5-2 Mathematical Example of an Error Matrix
L986ch05.fm Page 47 Wednesday, May 16, 2001 11:03 AM
©1999 by CRC Press
Let
be the number of samples classified into category i in the remotely sensed classifi-
cation, and
be the number of samples classified into category j in the reference data set.
Overall accuracy between remotely sensed classification and the reference data
can then be computed as follows:
.
Producer’s accuracy can be computed by
and the user’s accuracy can be computed by
Finally, let p
ij
denote the proportion of samples in the i,jth cell, corresponding to n
ij
.
In other words, p
ij
=
n
ij
/
n.
Then let p
i+
and p
+j
be defined by
and
.
nn
iij
j
k
+
=
=
∑
1
nn
jij
i
k
+
=
=
∑
1
overall accuracy =
=
n
n
ii
i
k
1
∑
producer’s accuracy =
j
jj
j
n
n
+
user’s accuracy =
i
ii
i
n
n
+
.
pp
iij
j
k
+
=
=
∑
1
pp
jij
i
k
+
=
=
∑
1
L986ch05.fm Page 48 Wednesday, May 16, 2001 11:03 AM
©1999 by CRC Press
Analysis Techniques
Once the error matrix has been represented in mathematical terms, then it is
appropriate to document the following analysis techniques. These techniques clearly
demonstrate why the error matrix is such a powerful tool and should be included in
any published accuracy assessment. Without having the error matrix as a starting
point, none of these analysis techniques would be possible.
Kappa
The Kappa analysis is a discrete multivariate technique used in accuracy assess-
ment for statistically determining if one error matrix is significantly different than
another (Bishop et al. 1975). The result of performing a Kappa analysis is a KHAT
statistic (actually , an estimate of Kappa), which is another measure of agreement
or accuracy (Cohen 1960). This measure of agreement is based on the difference
between the actual agreement in the error matrix (i.e., the agreement between the
remotely sensed classification and the reference data as indicated by the major
diagonal) and the chance agreement which is indicated by the row and column totals
(i.e., marginals). In this way the KHAT statistic is similar to the more familiar Chi
square analysis.
Although this analysis technique has been in the sociology and psychology liter-
ature for many years, the method was not introduced to the remote sensing community
until 1981 (Congalton 1981) and not published in a remote sensing journal before
Congalton et al. (1983). Since then numerous papers have been published recom-
mending this technique. Consequently, the Kappa analysis has become a standard
component of most every accuracy assessment (Congalton et al. 1983, Rosenfield
and Fitzpatrick-Lins 1986, Hudson and Ramm 1987, and Congalton 1991).
The following equations are used for computing the KHAT statistic and its variance.
Let
be the actual agreement, and
p
i+
and p
+j
as previously defined above
the “chance agreement.”
Assuming a multinomial sampling model, the maximum likelihood estimate of
Kappa is given by
.
ˆ
K
pp
oii
i
k
=
=
∑
1
ppp
cij
i
k
=
++
=
∑
1
ˆ
K
pp
p
oc
c
=
−
−1
L986ch05.fm Page 49 Wednesday, May 16, 2001 11:03 AM
©1999 by CRC Press
For computational purposes
; n
ii
, n
i+
, and n
+i
as previously defined above.
The approximate large sample variance of Kappa is computed using the Delta
method as follows:
where
,
,
,
and
.
A KHAT value is computed for each error matrix and is a measure of how well
the remotely sensed classification agrees with the reference data. Confidence intervals
around the KHAT value can be computed using the approximate large sample variance
and the fact that the KHAT statistic is asymptotically normally distributed. This fact
also provides a means for testing the significance of the KHAT statistic for a single
error matrix to determine if the agreement between the remotely sensed classification
and the reference data is significantly greater than 0 (i.e., better than a random
classification).
It is always satisfying to see that your classification is meaningful and signifi-
cantly better than a random classification. If it is not, you know that something has
gone terribly wrong.
ˆ
K
nn nn
nnn
ii
i
k
ii
i
k
ii
i
k
=
−
−
=
++
=
++
=
∑∑
∑
11
2
1
var
ˆ
ˆ
K
n
()
=
−
()
−
()
+
−
()
−
()
−
()
+
−
()
−
()
−
()
1
1
1
21 2
1
14
1
11
2
2
1123
2
3
1
2
42
2
2
4
θθ
θ
θθθθ
θ
θθ θ
θ
θ
1
1
1
=
=
∑
n
n
ii
i
k
θ
2
2
1
1
=
++
=
∑
n
nn
ii
i
k
θ
3
2
1
1
=+
()
++
=
∑
n
nn n
ii i i
i
k
θ
4
3
2
11
1
=+
()
++
==
∑∑
n
nn n
ij j i
j
k
i
k
L986ch05.fm Page 50 Wednesday, May 16, 2001 11:03 AM
©1999 by CRC Press
Finally, there is a test to determine if two independent KHAT values, and
therefore two error matrices, are significantly different. With this test it is possible
to statistically compare two analysts, two algorithms, or even two dates of imagery
and see which produces the higher accuracy. Both of these tests of significance rely
on the standard normal deviate as follows:
Let
and denote the estimates of the Kappa statistic for error matrix #1 and
#2, respectively. Let also and be the corresponding estimates of
the variance as computed from the appropriate equations. The test statistic for testing
the significance of a single error matrix is expressed by
.
Z is standardized and normally distributed (i.e., standard normal deviate). Given the
null hypothesis H
0
:K
1
= 0, and the alternative H
1
:K
1
¦ 0, H
0
is rejected if Z Š Z
α
/2
,
where
α
/2 is the confidence level of the two-tailed Z test and the degrees of freedom
are assumed to be ∞ (infinity).
The test statistic for testing if two independent error matrices are significantly
different is expressed by
.
Z is standardized and normally distributed. Given the null hypothesis H
0
:(K
1
– K
2
)=0,
and the alternative H
1
:(K
1
– K
2
) ¦ 0, H
0
is rejected if Z Š Z
α
/2
.
It is prudent at this point to provide an actual example so that the equations and
theory can come alive to the reader. The error matrix presented as an example in
Table 5-1 was generated from Landsat Thematic Mapper (TM) data using an unsu-
pervised classification approach by analyst #1. A second error matrix was generated
using the exact same imagery and same classification approach, however the clusters
were labeled by analyst #2 (Table 5-3). It is important to note that analyst #2 was
not as ambitious as analyst #1, and did not collect as much accuracy assessment data.
Table 5-4 presents the results of the Kappa analysis on the individual error
matrices. The KHAT values are a measure of agreement or accuracy. The values
can range from +1 to –1. However, since there should be a positive correlation
between the remotely sensed classification and the reference data, positive KHAT
values are expected. Landis and Koch (1977) characterized the possible ranges for
KHAT into three groupings: a value greater than 0.80 (i.e., 80%) represents strong
agreement; a value between 0.40 and 0.80 (i.e., 40–80%) represents moderate agree-
ment; and a value below 0.40 (i.e., 40%) represents poor agreement.
Table 5-4 also presents the variance of the KHAT statistic and the Z statistic
used for determining if the classification is significantly better than a random result.
At the 95% confidence level, the critical value would be 1.96. Therefore, if the
ˆ
K
1
ˆ
K
2
v
ˆ
ar
ˆ
K
1
()
v
ˆ
ar
ˆ
K
2
()
Z
K
K
=
()
ˆ
ˆ
ˆ
1
1
var
Z
KK
KK
=
−
()
+
()
ˆˆ
ˆ
ˆ
ˆ
ˆ
12
12
var var
L986ch05.fm Page 51 Wednesday, May 16, 2001 11:03 AM
©1999 by CRC Press
absolute value of the test Z statistic is greater than 1.96, the result is significant, and
you would conclude that the classification is better than random. The Z statistic
values for the two error matrices in Table 5-4 are both 20 or more, and so both
classifications are significantly better than random.
Table 5-3 An Error Matrix Using the Same Imagery and Classification Algorithm as in
Table 5-1 Except That the Work Was Done by a Different Analyst
Table 5-4 Individual Error Matrix Kappa Analysis Results
Table 5-5 Kappa Analysis Results for the Pairwise Comparison of the Error Matrices
L986ch05.fm Page 52 Wednesday, May 16, 2001 11:03 AM
©1999 by CRC Press
Table 5-5 presents the results of the Kappa analysis that compares the error
matrices, two at a time, to determine if they are significantly different. This test is
based on the standard normal deviate and the fact that although remotely sensed data
are discrete, the KHAT statistic is asymptotically normally distributed. The results
of this pairwise test for significance between two error matrices reveals that these
two matrices are not significantly different. This is not surprising since the overall
accuracies were 74% and 73% and the KHAT values were 0.65 and 0.64, respectively.
Therefore, it could be concluded that these two analysts may work together because
they produce approximately equal classifications. If two different techniques or algo-
rithms were being tested and if they were shown to be not significantly different,
then it would be best to use the cheaper, quicker, or more efficient approach.
Margfit
In addition to the Kappa analysis, a second technique called Margfit can be
applied to “normalize” or standardize the error matrices for comparison purposes.
Margfit uses an iterative proportional fitting procedure which forces each row and
column (i.e., marginal) in the matrix to sum to a predetermined value; hence the
name Margfit. If the predetermined value is one, then each cell value is a proportion
of one and can easily be multiplied by 100 to represent percentages. The predeter-
mined value could also be set to 100 to obtain percentages directly or to any other
value the analyst chooses.
In this normalization process, differences in sample sizes used to generate the
matrices are eliminated and therefore, individual cell values within the matrix are
directly comparable. In addition, because as part of the iterative process, the rows
and columns are totaled (i.e., marginals), the resulting normalized matrix is more
indicative of the off-diagonal cell values (i.e., the errors of omission and commis-
sion). In other words, all the values in the matrix are iteratively balanced by row
and column, thereby incorporating information from that row and column into each
individual cell value. This process then changes the cell values along the major
diagonal of the matrix (correct classifications), and therefore a normalized overall
accuracy can be computed for each matrix by summing the major diagonal and
dividing by the total of the entire matrix.
Consequently, one could argue that the normalized accuracy is a better repre-
sentation of accuracy than is the overall accuracy computed from the original matrix
because it contains information about the off-diagonal cell values. Table 5-6 presents
the normalized matrix generated from the original error matrix presented in Table
5-1 (an unsupervised classification of Landsat TM data by analyst #1) using the
Margfit procedure. Table 5-7 presents the normalized matrix generated from the
original error matrix presented in Table 5-3, which used the same imagery and
classifier, but was performed by analyst #2.
In addition to computing a normalized accuracy, the normalized matrix can also
be used to directly compare cell values between matrices. For example, we may be
interested in comparing the accuracy each analyst obtained for the conifer category.
From the original matrices we can see that analyst #1 classified 81 sample units
correctly while analyst #2 classified 91 correctly. Neither of these numbers means
L986ch05.fm Page 53 Wednesday, May 16, 2001 11:03 AM
©1999 by CRC Press
much, because they are not directly comparable due to the differences in the number
of samples used to generate the error matrix by each analyst. Instead, these numbers
would need to be converted into percentages or user’s and producer’s accuracies so
that a comparison could be made.
Here another problem arises. Do we divide the total correct by the row total
(user’s accuracy) or by the column total (producer’s accuracy)? We could calculate
both and compare the results or we could use the cell value in the normalized
matrix. Because of the iterative proportional fitting routine, each cell value in the
matrix has been balanced by the other values in its corresponding row and column.
This balancing has the effect of incorporating producer’s and user’s accuracies
together. Also since each row and column add to one, an individual cell value can
quickly be converted to a percentage by multiplying by 100. Therefore, the nor-
malization process provides a convenient way of comparing individual cell values
between error matrices regardless of the number of samples used to derive the
matrix (Table 5-8).
Table 5-9 provides a comparison of the overall accuracy, the normalized accu-
racy, and the KHAT statistic for the two analysts. In this particular example, all
three measures of accuracy agree about the relative ranking of the results. However,
it is possible for these rankings to disagree simply because each measure incorpo-
Table 5-6 Normalized Error Matrix from Analyst #1
L986ch05.fm Page 54 Wednesday, May 16, 2001 11:03 AM
©1999 by CRC Press
rates various levels of information from the error matrix into its computations.
Overall accuracy only incorporates the major diagonal and excludes the omission
and commission errors. As already described, normalized accuracy directly includes
the off-diagonal elements (omission and commission errors) because of the iterative
proportional fitting procedure. As shown in the KHAT equation, KHAT accuracy
indirectly incorporates the off-diagonal elements as a product of the row and column
marginals. Therefore, depending on the amount of error included in the matrix,
these three measures may not agree.
It is not possible to give clearcut rules as to when each measure should be used.
Each accuracy measure incorporates different information about the error matrix
and therefore must be examined as different computations attempting to explain the
error. Our experience has shown that if the error matrix tends to have a great many
off-diagonal cell values with zeros in them, then the normalized results tend to
disagree with the overall and Kappa results.
Many zeros occur in a matrix when an insufficient sample has been taken or
when the classification is exceptionally good. Because of the iterative proportional
fitting routine, these zeros tend to take on positive values in the normalization process
showing that some error could be expected. The normalization process then tends
to reduce the accuracy because of these positive values in the off-diagonal cells. If
Table 5-7 Normalized Error Matrix from Analyst #2
L986ch05.fm Page 55 Wednesday, May 16, 2001 11:03 AM
©1999 by CRC Press
a large number of off-diagonal cells do not contain zeros then the results of the three
measures tend to agree. There are also times when the Kappa measure will disagree
with the other two measures. Because of the ease of computing all three measures
and because each measure reflects different information contained within the error
matrix, we recommend an analysis such as the one performed here to glean as much
information from the error matrix as possible.
Conditional Kappa
In addition to computing the Kappa coefficient for an entire error matrix, it may
be useful to look at the agreement for an individual category within the matrix.
Individual category agreement can be tested using the conditional Kappa coefficient.
The maximum likelihood estimate of the Kappa coefficient for conditional agreement
for the ith category is given by
, n
i+
and n
+i
as previously defined above,
and the approximate large sample variance for the ith category is estimated by
.
Table 5-8 Comparison of the Accuracy Values for an Individual Category
Table 5-9 Summary of the Three Accuracy Measures for Analyst #1 and #2
ˆ
K
nn n n
nn n n
i
ii i i
iii
=
−
−
++
+++
var
ˆ
ˆ
K
nn n
nnn
n n n n nn nn n n n n
i
iii
ii
iiiii ii ii i iii
()
=
−
()
−
()
[]
−
()
−
()
+−−+
()
[]
+
++
+++ ++
3
L986ch05.fm Page 56 Wednesday, May 16, 2001 11:03 AM
©1999 by CRC Press
The same comparison tests available for the Kappa coefficient apply to this
conditional Kappa for an individual category.
Weighted Kappa
The Kappa analysis is appropriate when all the error in the matrix can be
considered of equal importance. However, it is easy to imagine a classification
scheme where errors may vary in their importance. In fact, this latter situation is
really the more realistic approach. For example, it may be far worse to classify a
forested area as water than to classify it as shrub. In this case, the ability to weight
the Kappa analysis would be very powerful (Cohen 1968). The following section
describes the procedure to conduct a weighted Kappa analysis.
Let w
ij
be the weight assigned to the i,jth cell in the matrix. This means that the
proportion p
ij
in the i,jth cell is to be weighted by w
ij
. The weights should be restricted
to the interval 0 ð w
ij
ð 1 for i ¦ j and the weights representing the maximum agreement
are equal to 1, i.e., w
ii
= 1 (Fleiss et al. 1969).
Therefore, let
be the weighted agreement, and
, p
ij
, p
i+
, and p
+j
as previously defined above,
the weighted “chance agreement.”
Then the weighted Kappa is defined by
.
To compute the large sample variance of the weighted Kappa define the weighted
average of the weights in the ith category of the remotely sensed classification by
, p
+j
as previously defined above,
and the weighted average of the weights in the jth category of the reference data set by
, p
i+
as previously defined above.
pwp
oijij
j
k
i
k
∗
==
=
∑∑
11
pwpp
cijij
j
k
i
k
∗
++
==
=
∑∑
11
ˆ
K
pp
p
w
oc
c
=
−
−
∗∗
∗
1
wwp
iijj
j
k
++
=
=
∑
1
wwp
jiji
i
k
++
=
=
∑
1
L986ch05.fm Page 57 Wednesday, May 16, 2001 11:03 AM
©1999 by CRC Press
The variance may be estimated by
The same tests of significant difference described previously for the Kappa
analysis apply to the weighted Kappa. An individual weighted Kappa value can be
evaluated to see if the classification is significantly better than random. Two inde-
pendent weighted Kappas can also be tested to see if they are significantly different.
Although the weighted Kappa has been in the literature since the 1960s and even
suggested to the remote sensing community by Rosenfield and Fitzpatrick-Lins
(1986), it has not received widespread attention. The reason for this lack of use is
undoubtedly the need to select appropriate weights. Manipulating the weighting
scheme can significantly change the results. Therefore, comparisons between dif-
ferent projects using different weighting schemes would be very difficult. The
subjectivity of choosing the weights is always hard to justify. Using the unweighted
Kappa analysis avoids these problems.
Compensation for Chance Agreement
Some researchers and scientists have objected to the use of the Kappa coefficient
for assessing the accuracy of remotely sensed classifications because the degree of
chance agreement may be over-estimated (Foody 1992). Remember from the equa-
tion for computing the Kappa coefficient,
,
that p
o
is the observed proportion of agreement (i.e., the actual agreement) and p
c
is the proportion of agreement that is expected to occur by chance (i.e., the chance
agreement). However, in addition to the chance agreement, p
c
also includes some
actual agreement (Brennan and Prediger 1981) or agreement for cause (Aickin 1990).
Therefore, since the chance agreement term does not consist solely of chance
agreement, the Kappa coefficient may underestimate the classification agreement.
This problem is known to occur when the marginals are free (not fixed a priori),
which is most often the case with remotely sensed classifications. Foody (1992)
presents a number of possible solutions to this problem including two Kappa-like
coefficients that compensate for chance agreement in different ways. However, given
the very powerful properties of the Kappa coefficient, including the ability to test
v
ˆ
ar
ˆ
.
K
np
pw p w w p
pp p p
w
c
ij ij c i j o
j
k
i
k
oc c o
()
=
−
()
−
()
−+
()
−
()
[]
−−+
()
∗
∗
++
∗
==
∗∗ ∗ ∗
∑∑
1
1
11
2
4
2
11
2
ˆ
K
pp
p
oc
c
=
−
−1
L986ch05.fm Page 58 Wednesday, May 16, 2001 11:03 AM
©1999 by CRC Press
for significant differences between two independent coefficients, it must still be
considered a vital accuracy assessment measure.
Confidence Limits
Confidence intervals are extremely common and are an expected component of
any statistical estimate. However, computing confidence intervals for values in an
error matrix are more complex than simply computing a confidence interval for a
traditional statistical analysis. The following example illustrates the calculations
derived from the error matrix (Card 1982). This example is designed assuming simple
random sampling. If another sampling scheme is used the variance equations change
slightly.
The same error matrix as in Table 5-1 will be used to compute the confidence
intervals. However, the map marginal proportions,
π
j
, computed as the proportion
of the map falling into each map category, are also required (Table 5-10). The map
marginal proportions are not derived from the error matrix, but are simply the
proportion of the total map area falling into each category. These proportions can
quickly be obtained by dividing the area of each category by the total map area.
Given this matrix, the first step is to compute the individual cell probabilities
using the following equation:
.
The individual cell probabilities are simply the map marginal proportion multiplied
by the individual cell value all divided by the row marginal. The results of these
computations are shown in Table 5-11.
Table 5-10 Error Matrix Showing Map Marginal Proportions
ˆ
pnn
ij j ij j
=
⋅
π
L986ch05.fm Page 59 Wednesday, May 16, 2001 11:03 AM
©1999 by CRC Press
The true marginal proportions,
i
, can then be computed using the equation
.
The true marginal proportions can also be computed simply by summing the indi-
vidual cell probabilities in each column. For example,
1
= 0.170 + 0.024 + 0.000
+ 0.008 = 0.202,
2
= 0.357,
3
= 0.157, and
4
= 0.285.
The third step is to compute the probability correct given the true class i; in
other words, the producer’s accuracy. It should be noted that the values here differ
somewhat from those computed in the error matrix discussion because these values
have been corrected for bias by incorporating the true marginal proportions as shown
in the following equation:
.
As expected, the producer’s accuracy is computed taking the diagonal cell value
from the cell probability matrix (Table 5-11) and dividing by the true marginal
proportion. For example,
θ
11
= 0.170/0.202 = 0.841 or 84%,
θ
22
= 0.908,
θ
33
= 0.471,
and
θ
44
= 0.607.
The next step is to compute the probability correct given map class j; in other
words, the user’s accuracy. This computation is made exactly as described in the
error matrix discussion by taking the diagonal cell value and dividing by the row
(j) marginal. The equation for this calculation is as follows:
.
Therefore,
11
= 65/115 = 0.565 or 57%,
22
= 0.810,
33
= 0.739, and
44
= 0.865.
Table 5-11 Error Matrix of Individual Cell Probabilities,
ˆ
p
ij
ˆ
p
ˆ
pnn
j j ij j
j
r
=
⋅
=
∑
π
1
ˆ
p
ˆ
p
ˆ
p
ˆ
p
ˆ
ˆˆˆ
θπ
ii i i ii i ii i
pnn pp
=
()()
⋅
or
ˆ
lnn
jj jj j
=
⋅
ˆ
l
ˆ
l
ˆ
l
ˆ
l
L986ch05.fm Page 60 Wednesday, May 16, 2001 11:03 AM
©1999 by CRC Press
Step 5 is to compute the overall correct by summing the major diagonal of the
cell probabilities or using the equation
.
Therefore, in this example,
c
= 0.170 + 0.324 + 0.074 + 0.173 = 0.741 or 74%.
We have now made essentially the same calculations as described in the error
matrix discussion except that we have corrected for bias by using the true marginal
proportions. The next step is to compute the variances for those terms (overall,
producer’s and user’s accuracies) that we wish to calculate confidence intervals.
Variance for overall accuracy,
c
,
.
Therefore, in this example,
Confidence interval for overall accuracy,
c
,
.
Therefore, in this example, the confidence interval for
ˆ
Pnn
c j jj j
j
r
=
⋅
=
∑
π
1
ˆ
P
ˆ
P
VP p p n
c ii i ii i
i
r
ˆ
()
=−
()()
=
∑
ππ
1
ˆ
.
.
.
.
P
c
=−
()()()
[
+−
()()()
+−
()()()
+−
()()()
=
0 170 0 3 0 170 0 3 434
0 324 0 4 0 324 0 4 434
0 074 0 1 0 074 0 1 434
0 173 0 2 0 173 0 2 434
0 00040
ˆ
P
ˆˆ
PVP
cc
=
()
[]
2
12
ˆ
.,
P
c
=±
()
=±
()
=±
=
()
0 741 2 0 0004
0 741 2 0 02
0 741 0 04
0 701
12
0.781 or 70% to 78%.
L986ch05.fm Page 61 Wednesday, May 16, 2001 11:03 AM
©1999 by CRC Press
Variance for producer’s accuracy,
ii
,
.
Therefore, in this example,
Confidence interval for producer’s accuracy,
ii
,
.
Therefore, in this example, the confidence interval for
Variance for user’s accuracy,
ii
,
.
Therefore, in this example,
Confidence interval for
.
ˆ
θ
Vpppppn pppn
ii ii i ii ij j ij j j ii i ii i
j
r
ˆ
θππππ
()
=−
()
+−
()
−
()
−
≠
∑
4
2
1
V
ˆ
/. . . . .
. . .
θ
11
4
2
0 170 0 202 0 170 0 024 0 4 0 024
0 4 434 0 008 0 2 0 008 0 2 434
0 3 0 170 0 202 0 170 0 3 434
0 00132
()
=
()
−
()
[
{
()( )
+−
()()()
]
+−
()
−
()()()
}
=
−
ˆ
θ
ˆˆ
θθ
ii ii
V±
()
[]
2
12
ˆ
.,
θ
11
12
0 841 2 0 00132
0 841 2 0 036
0 841 0 072
0 768
=±
()
=±
()
=±
=
()
0.914 or 77% to 91%.
ˆ
l
Vl p p n
ii ii i ii i
ˆ
()
=−
()
ππ
2
Vl
ˆ
.
11
2
0 170 0 3 0 170 0 3 434
0 00057
()
=−
()()()
=
ˆˆ
lVl
ii ii
±
()
[]
2
12
L986ch05.fm Page 62 Wednesday, May 16, 2001 11:03 AM
©1999 by CRC Press
Therefore, in this example, the confidence interval for
It must be remembered that these confidence intervals are computed from asymp-
totic variances. If the normality assumption is valid, then these are 95% confidence
intervals. If not, then by Chebyshev’s inequality, they are at least 75% confidence
intervals.
Area Estimation/Correction
In addition to all the uses of an error matrix already presented, it can also be
used to update the areal estimates of the map categories. The map derived from the
remotely sensed data is a complete enumeration of the ground. However, the error
matrix is an indicator of where misclassification occurred between what the map
said and what is actually on the ground. Therefore, it is possible to use the infor-
mation from the error matrix to revise the estimates of total area for each map
category. It is not possible to update the map itself or to revise a specific location
on the map, but it is possible to revise total area estimates. Updating in this way
may be especially important for small, rare categories whose estimates of total area
could vary greatly depending on even small misclassification errors.
Czaplewski and Catts (1990) and Czaplewski (1992) have reviewed the use of
the error matrix to update the areal estimates of map categories. They propose an
informal method, both numerically and graphically, to determine the magnitude of
bias introduced in the areal estimates by the misclassification. They also review two
methods of statistically calibrating the misclassification bias. The first method is
called the classifical estimator and was proposed to the statistical community by
Grassia and Sundberg (1982) and used in a remotely sensed application by Prisley
and Smith (1987) and Hay (1988). The classical estimator uses the probabilities
from the omission errors for calibration.
The second method is the inverse estimator, which uses the probabilities from
the commission errors to calibrate the areal estimates. Tenenbein (1972) introduced
this technique in the statistical literature and Chrisman (1982) and Card (1982) have
used it for remote sensing applications. The confidence calculations derived in the
previous section are from Card’s (1982) work using the inverse estimator for cali-
bration. More recently, Woodcock (1996) has proposed a modification of the Card
approach incorporating fuzzy set theory into the calibration process.
Despite all this work, not many users have picked up on these calibration
techniques or the need to perform the calibration. From a practical standpoint,
overall total areas are not that important. We have already discussed this in terms
ˆ
.,
l
11
12
0 565 2 0 00057
0 565 2 0 024
0 741 0 048
0 517
=±
()
=±
()
=±
=
()
0.613 or 52% to 61%.
L986ch05.fm Page 63 Wednesday, May 16, 2001 11:03 AM
©1999 by CRC Press
of non-site specific accuracy assessment. However, as more and more work is done
with looking at change, and especially changes of small, rare categories, the use
of these calibration techniques may gain in importance.
L986ch05.fm Page 64 Wednesday, May 16, 2001 11:03 AM