Báo cáo khoa hoc:" Variance in multiplex suspension array assays: carryover of microspheres between sample wells" ppsx
Bạn đang xem bản rút gọn của tài liệu. Xem và tải ngay bản đầy đủ của tài liệu tại đây (242.78 KB, 8 trang )
BioMed Central
Page 1 of 8
(page number not for citation purposes)
Journal of Negative Results in
BioMedicine
Open Access
Research
Variance in multiplex suspension array assays: carryover of
microspheres between sample wells
Brian Hanley*
1,2
Address:
1
Microbiology Graduate Group, University of California, Davis, CA 95616, USA and
2
BW Education and Forensics, 2710 Thomes Avenue,
Cheyenne, Wyoming 82001, USA
Email: Brian Hanley* -
* Corresponding author
Abstract
Background: This study was undertaken because of the accidental observation that a sample of
60+ beads was obtained by the instrument from a completely dry, unused well in a 96 well plate.
Others have observed unexplained outliers in replicated wells. The problem was first observed on
an older instrument, and replicated on a new instrument.
Methods and results: Data is presented from two instruments using a multiple blank following
well experiment that shows a surprising amount of carryover that has an unexpected nature. When
it occurs, it does not necessarily decline from one well to the next. There appears to be two types
of carryover, one that is small, predictable and declines consistently, and another which is
potentially very large, unpredictable, and does not decline. The former can be compensated for or
ignored. The latter cannot be addressed without using multiple replicated samples or an intraplex
method.
Conclusion: This problem has significance for analysis of results obtained with suspended
microarray instruments. A special notation is made that biostatisticians need to be made aware of
these results before experiments are undertaken and data generated for them to analyze. The
problem can be handled by enough replicated samples, or an intraplex method. The applicability of
these results to oligonucleotide based assays is unknown.
Background
A suspended microarray assay system uses small particles
such as microrods or microbeads that contain some
method for identifying a set. An assay used to detect an
analyte is bound to the surface of a set of identical parti-
cles, which are generally in the size range 3–15 microns.
These particles are added to a liquid containing the ana-
lyte. (In systems such as "smart dust", the assay may be
distributed in the field to detect analytes.) The final step
in the assay activates a fluorophore that provides a signal.
The particles are run through a flow cytometer, which is
generally optimized for the specific system used. For each
particle in the mixture, the cytometer identifies the classi-
fier together with the fluorescence reading of the reporter
fluorophore. Because the particle classifiers are unique for
each analyte, it is possible to multiplex the assays together
in a test tube. Alternatively, multi-well assay plates can be
used, and such assays then become a high throughput sys-
tem.
The Luminex assays compared in this study utilize
microbeads on which antigens or antibodies have been
Published: 25 April 2007
Journal of Negative Results in BioMedicine 2007, 6:6 doi:10.1186/1477-5751-6-6
Received: 30 March 2007
Accepted: 25 April 2007
This article is available from: />© 2007 Hanley; licensee BioMed Central Ltd.
This is an Open Access article distributed under the terms of the Creative Commons Attribution License ( />),
which permits unrestricted use, distribution, and reproduction in any medium, provided the original work is properly cited.
Journal of Negative Results in BioMedicine 2007, 6:6 />Page 2 of 8
(page number not for citation purposes)
covalently bonded (xMap™ assays). xMap™ microbeads
contain two reporter fluorophores, which are proportion-
ally varied to identify them as one of 100 possible bead
identifiers. Classical sandwich assays such as streptavidin-
linked phycoeryrthrin are conducted to attach reporter
molecules to the beads. The reporter fluorophore intensity
is then measured in a specialized flow cytometer together
with the microbead identifiers and the fluorescence meas-
urement is classified by bead identifier. A sample of n
beads is collected, and median, mean, or trimmed mean
are generally used as the reported value. The system is typ-
ically deployed with one well, or sometimes two wells
containing the same analyte fluid.
The fluid with a sample of microbeads flows up through a
probe, which has a tip with 5 very fine holes leading to a
single channel at the top. The fluid travels through a sys-
tem of tubing and valves into the flow cell, where (in the
current equipment) two lasers are present. One laser stim-
ulates the two marker fluorophores, and the other stimu-
lates the reporter fluorophore. A system of avalanche
photodiodes and photomultiplier tube captures and reads
the fluorescence from marker and reporter emissions
[1,2].
The usual number of beads that are recovered and used by
the instrument is 50 to 100 per bead set. Assays with
counts as low as 30–35 are used. In separate experiments
(not shown) using 32 replicates at varying bead counts,
no significant difference in replicate standard deviation
was seen until 700 to 1,000 beads are counted. The
improvement at higher counts was minor.
Assays are normally done putting 1,000 to 2,000 beads
per bead type into one well. This is the number necessary
in order to acquire 35–100 beads at the end of the assay.
Higher bead counts require proportionally higher doses
of beads for the assay. It takes a long time to acquire large
numbers of beads if it works. It can take so long that the
instrument becomes impractical to use for its purpose of
high throughput. Additionally, the beads are precision
manufactured product, and expensive.
For a diagnostic test, these assays have a cutoff value estab-
lished by the assay designer. If an assay goes over that
value, it is positive, if it is under the cutoff value it is neg-
ative.
The assays used for this study were all protein antigen/
antibody assays. The instruments in use for these assays
were instruments that had run such protein antigen/anti-
body assays. There are plausible reasons to question if
these results apply to deoxyribonucleotide based assays;
this is addressed as part of the discussion. Deoxyribonu-
cleotide experiments were not possible within the scope
of this study.
Design considerations of experiment
The experiment was designed as one of a set undertaken
to tease apart the various contributors to variance in the
Luminex assay system. There are more than a few contrib-
utors to variance, (on the order of at least 10) so the ques-
tion was how to isolate the contribution of carryover
between wells. In a normal assay, in which each well is
filled with biological material to be analyzed and fluores-
cence is read, it would be impossible to point to a fluores-
cence result and say that it was specifically due to
carryover because of the large number of other sources of
variation in the system including stochastics. Conse-
quently, the experiment was designed to only count beads
in each well, and nothing else. Bead counts are supplied
by the instrument. Those counts are then used propor-
tionally to project how they could change an assay.
The original observation that prompted prioritizing a car-
ryover experiment occurred in dry wells. Thus, one early
idea for an experiment was to put a dry plate into the
instrument and run it through for 96 wells. However, that
would not be normal operation of the instrument. Such
conditions would create cavitation and bubbles inside the
tubing and probe tip. It could be argued that while some
amount of binding and release of beads might be occur-
ring under normal conditions, the numbers would be
insignificantly small compared to the scouring effect of
cavitation. So this alternative was rejected as providing
invalid results.
To identify beads that were carried over from prior wells,
a plate was defined with rows A and E containing real
sample and beads. After each well containing sample and
beads were three empty wells. Therefore, if a bead was to
appear in one of the three empty wells, it would have to
be from carryover of some kind as long as there was a way
to eliminate accidental contamination.
A set of preliminary experiments were conducted where 4
technicians in the lab pipetted 3 µl into wells. Preliminary
to that, the rate of evaporation at various locations on lab
benches were assayed using a high sensitivity scale. These
tests required exact timing of pipetting and weighing since
evaporation occurs rather quickly. The results showed that
at 3 microliter quantities, large variances occurred. Some
wells had double inoculations. These results indicated
that great care and some type of double-check had to be in
place against bench error to accept any results.
Consequently, it was decided that unless the intervening
wells were dry until the last step, just prior to going into
the Luminex instrument, the experiment would not be
Journal of Negative Results in BioMedicine 2007, 6:6 />Page 3 of 8
(page number not for citation purposes)
valid. This is the best method of visual control to ensure
visibility of injection of beads into a well by accident. All
beads are injected in suspension, so the liquid would
show in the well as a different color. Dyes were rejected
since in the lab they were not normally used, so their
potential change in effect on any assay was unknown.
Additionally, since the wells are washed multiple times
during the assay, there is no biological sample during the
assay in the follow-on empty wells that could affect any
result.
For those not familiar, in outline, the way these assays are
conducted is as follows:
1) Sample (lysate, serum, etc) is pipetted in dilute form
into wells.
2) A mixture of different beads are injected into wells.
Note: Typical bead counts are ~1,000 to 2,000 beads per well
for each bead type.
3) Plate is incubated. This ranges from 2 hours to over-
night depending on sample and assay.
4) Plate is washed twice times with PBS Tween.
5) The second antibody is pipetted into the wells and
incubated. Again, timing can vary on incubation time.
6) Plate is washed 3 times with PBS Tween.
7) Phycoeryrthrin (or another reporter) is pipetted into
wells. This time incubation is for 30 minutes so that all
assays have roughly the same amount of phycoerythrin
bound to reporter antibodies.
8) Plate is put on the Luminex assay platform and assayed.
The outcome of these experimental design considerations
is that the impact of bead counts on fluorescence results
must be made by deduction as a general principle. By
observing counts, and applying known principles, the
potential effect on assays is made clear. The import of this
experiment can only be general, it cannot be made specific
for a well in a real assay by any conceivable method.
Methods
The assays used in this study were developed previously
for a simian virus detection project. They were manufac-
tured using carboxylate xMap™ microspheres from
Luminex (Luminex; Austin, TX) conjugated to viral anti-
gens; the viral antigens are identified in the appendix
together with the bead classifiers. The assays were antigen
attached to microspheres, intended to bind Rhesus
macaque antibody.
Uncoated beads were used as controls, together with
microbead assays for which the serum sample was known
to be negative. Frozen serum from a single Rhesus
macaque with known positive and negative characteristics
was used as the sole experimental sample (see Appendix).
Samples were incubated for two hours on a shaker table,
washed, then incubated for 40 minutes with R-Phyco-
erythrin-conjugated Affinipure F(ab) Fragment Goat anti-
Human IgG Fcγ (Jackson ImmunoResearch Laboratories,
Inc.; West Grove, PA), which was used as a conjugate
reporter to detect the Rhesus macaque antibodies bound
to beads. The plate contents were then washed, shaken to
suspend the microbeads, washed again, resuspended,
then read on a Luminex instrument. Plates were stored
overnight a 4°C refrigerator and read on a Bioplex instru-
ment the following morning.
Preparation of xMap™ microspheres
Details of the bead preparation are given in the appendix
(xMap™ bead coating protocol.) The use of beads with
recorded assay results was accepted as sufficient indica-
tion that they were representative of a real world assay,
which was the objective, even though bead counts was the
only data used. The assays used in this study were antigen
attached to microspheres, intended to have Rhesus
Macaque antibody bind to the antigen. R-Phycoerythrin-
conjugated Affinipure F(ab) Fragment Goat anti-Human
IgG Fcγ (Jackson ImmunoResearch Laboratories, Inc.;
West Grove, PA) was used as conjugate reporter to the
Rhesus macaque antibodies bound to beads.
In Table 1 are listed the virus antigens used in these exper-
iments, with bead identifiers. A 100 s digit was prefixed to
differentiate in-house assays from those acquired from
outside (106 = bead region 006, 112 = bead region 012,
etc.)
Table 1: Assays and bead classifiers available for use
CMV SFV SRV SIV
106 105 146 104
112 111 147 133
113 115 152 137
180 118 197
166 198
173
CMV = Cytomegalovirus
SFV = Simian Foamy Virus
SRV = Simian Type D Retrovirus
SIV = Simian Immunodeficiency Virus
Items in bold are duplicated bead identifiers which were not used.
Journal of Negative Results in BioMedicine 2007, 6:6 />Page 4 of 8
(page number not for citation purposes)
Preparation of microtiter plates
The plates used were MultiScreen HTS, BV (Millipore;
Bedford, MA) 96 well filter plates. Preliminary studies of
pipetting error indicated that volumes above 5 µl would
have minimal error. All assays were conducted such that
no fluid volume below 5 µl would be pipetted. On the
basis of preliminary evaporation studies, a total volume of
at least 90 µl per well was used during incubations to min-
imize evaporation as a source of variance. In addition, all
wells were filled within 10 minutes or less so that any dif-
ference between well concentrations due to evaporation
was further minimized.
Experiments
Protocol 3 – Samples were laid out in rows A and E across
the plate, and all other wells were left dry during incuba-
tion steps. Straight PBS-Tween was added to all wells dur-
ing the final suspension step to preserve normal fluidic
operation of the Luminex instrument. This made any
microbeads that might appear in a following empty well
attributable to something other than the well itself.
Data collection
For these experiments two instruments were used. One is
a Luminex model 100 that is approximately 5 years old.
The other is a Biorad Bioplex instrument that was installed
in late December 2005 and was commissioned for use in
January of 2006. Both instruments were under standard
service contract. Prior to commencing the study, both
instruments had been serviced by field technicians in the
previous 2 months. Also prior to commencing the study,
the older Luminex instrument was upgraded to the latest
software and firmware levels. The only data used for this
experiment was the count of beads for each well.
Discussion
On one plate, 2 dry wells, F7 and F8 were observed to have
a bubble of fluid on them after incubation. It was pre-
sumed this was from some action of the shaker table, the
plate lid and evaporation/condensation. However, that
plate showed no more carryover of beads for those two
wells than for any other.
In summary, the results show that carryover between wells
can vary a great deal. The factors contributing to the carry-
over that are seen in this experiment are unknown. How-
ever certain factors such as probability of accidental
deposition of microbeads into wells showing anoma-
lously high carryover can be ruled out. Empty wells were
left dry deliberately so that any such accidental deposition
would be visible. Additionally, those wells which showed
the highest anomalous values were at the bottom edge of
the plate as shown below. They were not neighbors of
wells with sample. An example of this is shown in Table 2
for one bead identifier. The values are counts of beads.
Rows A and E in bold italics had wells containing beads.
Rows B, C, D and F, G, H, in normal text were empty of
samples, and filled with PBS-Tween solution just prior to
reading. Upper left corner cell contains bead identifier.
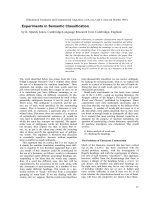
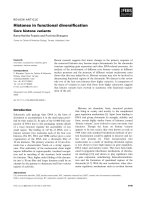
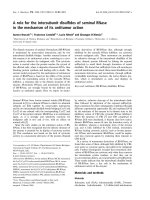
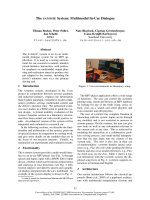
The charts in Figure 1 and Figure 2 summarize the obser-
vations from these two plates. Instrument manufacturers
are hidden because there is believed to be no significance
to the vendor name for these results. One plate had some
very high outliers, and as a consequence, the mean aver-
age and the maximum are an inverse of what one would
expect, with rising numbers rather than declining num-
bers. The primary point is that this could occur on any
plate of samples and there is no way to know without run-
ning some form of replication.
Carryover effect on fluorescence readings
There are two things that matter here for projecting range
of effect of carryover on fluorescence reading. First is what
percentage of the total number of beads acquired this car-
ryover percentage represents. Second is what the absolute
number of beads is that is acquired by the instrument
attributable to carryover. This experiment puts a stake in
the ground for both.
Table 2:
125 123456789101112
A 267 394 370 404 347 381 348 91 407 315 370 347
B 356965405646
C 12117060291338
D 6621090124143115
E 314 342 354 322 307 350 290 212 226 185 21 19
F 381524216164
G 15529103957363752
H 239108811479162122
(Note, the bead number above was 25. Intra-lab assays have a preceding digit "1", hence 125.)
Data in bold italics is the row with actual sample. All other rows were empty, filled with buffer just prior to reading.
Journal of Negative Results in BioMedicine 2007, 6:6 />Page 5 of 8
(page number not for citation purposes)
If one predicates that ~10% of the beads from a well are
from the assay of a different well(s), and those beads are
positive, then in any case where the true value would have
been 10% or less below the cutoff value for positive diag-
nosis, the result is a false positive. Conversely, any case
where the true value is 10% or more above the cutoff, and
those beads from other wells are negative, then it will give
a false negative diagnosis. Whether the beads from other
wells will be positive or negative depends on the mix of
samples. In many instances, most samples are negative.
The data above supports a minimum possible carryover
level of 10%.
Looking at the problem by absolute count, if one says that
the maximum number of carryover beads is 114 as
observed in this experiment, and compares that to the
usual range of 50 to 100 beads acquired for a sample, then
one can say that it is possible for any amount of sample,
up to and including 90% or more of the beads acquired to
be from a different well than that reported.
If one makes the assumption that the beads are first
injected into the well and thoroughly mixed with those
beads in the well, then one can assume that the above per-
centage rules should apply, subject to stochastic varia-
tions. With stochastic variations, there are "lottery
winners" sooner or later; for patient diagnostics this
would matter, since the diagnosis would probably be
changed to the opposite of what it should be.
The problem is that the preceding assumption cannot be
depended on. Since beads are by definition carried over
from inside the instrument somewhere, at least some of
the time a slug of beads could come loose that are carry-
over beads during the suction cycle into the instrument,
and carryover beads precede those coming from the well.
In such a case these carryover beads would be read first,
followed by the correct beads. If a full set of 50 to 100
beads was acquired by the instrument, whether more
beads were counted would depend on whether other bead
sets had reached the lower limit cutoff value yet. The point
here being that bead counts for a specific identifier would
not necessarily be subject to dilution and mixing within
the well. The degree of dilution of this slug of carryover
beads could be as low as 10% or less.
What this indicates is that carryover from one well to the
next is a significant issue as an unpredictable factor con-
tributing to fluorescent intensity readings.
Possible explanations for carryover phenomenon
No definitive explanations for the carryover phenomenon
is presented here, but several possibilities are suggested:
A.) Random differences in fluid adhering to the probe tip
as it moves from well to well. B.) Small scratches or imper-
fections on the surface of the sampling probe may carry
fluid. C.) Inside the probe, one or more of the fine chan-
nels may become temporarily blocked or occluded with a
combination of materials and intermittently clear. Some
candidate materials are: C.1.) Fibrinogen C.2.)
Microbeads C.3.) Bacterial or fungal growth. D.) Adhe-
sion and release could occur from valves and tubing inter-
nal to the instrument.
It is noteworthy that clogging of the probe tip is known to
be a fairly common occurrence as evidenced by proce-
dures provided by the instrument vendors for clearing
clogged probes. Since there are 5 small holes in the probe
tip, when a user realizes that the tip is clogged, this means
that the tip has probably got three or less holes that work.
There should also be velocity and fluid flow changes inter-
nally to the probe as holes clog, leading to unknown
opportunities for deposition and adherence of
microbeads in eddies on the fluid flow. It is also virtually
guaranteed that any probe tip will have small differences
in flow due to minor manufacturing imperfections. When
a probe tip channel gets clogged, it will no longer have
fluid flow (such as bleach or alcohol disinfectant), so bac-
terial and fungal growth is a virtual certainty to occur in
the clogged channel. The clog will contain microbeads
that could either potentially carry over to be deposited in
another well, or else come loose and flow through into
Summary of 6 bead sets, trailing empty well contents for instrument AFigure 2
Summary of 6 bead sets, trailing empty well contents for
instrument A. Bead counts.
Summary of 6 bead sets, trailing empty well contents for instrument BFigure 1
Summary of 6 bead sets, trailing empty well contents for
instrument B. Bead counts.
Journal of Negative Results in BioMedicine 2007, 6:6 />Page 6 of 8
(page number not for citation purposes)
the instrument flow cell during an uptake cycle. The
number of beads could be quite high potentially.
It also makes sense that the plumbing of an instrument
would eventually support bacterial and fungal colonies
despite flushing protocols, and that wear in valves and
turbulence at fittings would be expected to create oppor-
tunities for adhesion, and "adhesion and release" of
microbeads. This assumes that there would be no possible
surfaces to which beads, fungi and bacteria could be
expected to stick when the instrument is new, which is
unlikely.
Antibody and antigen coated beads complexed with
streptavidin-phycoerythrin reporter present ample chem-
istry for binding to surfaces such as steel and plastics. They
also provide nutrition for microorganisms in the form of
amino acids. Myxococcus xanthus, for instance, which is a
common environmental bacteria, prefers amino acids.
The attendant products of colonization by bacteria and
fungi would additionally create more chemistry for bind-
ing and aggregation.
Application of these results to deoxyribonucleotide bead
assays
Whether nucleotide beads would exhibit the same behav-
ior in an instrument used exclusively for nucleotide bead
assays is not established by this experiment. For nucle-
otide based assays, nucleotides are a much poorer nutri-
tional source than protein based assays. There are reports
of facultative capacity to break down purines by some bac-
teria. However, energy yield is low, making this source
unlikely to support significant growth. Additionally,
nucleotides bind poorly to most plastics and steel.
Conclusion
In antibody/antigen assays, carryover can occur that is sig-
nificant enough to go over or under a cutoff value estab-
lished for a diagnostic, and thus deliver an incorrect value.
This carryover is not predictable in a manner that can be
compensated for without replicates or intraplex assay
design. In addition, the manufacturer provides remedia-
tion procedures for clogging of probes. Together, at mini-
mum, these indicate that beads can clog in the tip and be
released later, although whether the probe tip is the only
location is not established. The manufacturer should
study the problem of carryover and take steps to alleviate
it, or else provide guidelines for use of assay methods that
are robust enough to be able to compensate for it.
Appendix
xMap™ bead coating protocol
1. Vortex the uncoated beads for 20 seconds and sonicate
for 1 minute.
2. Remove 250 µl (2.5×10E6) uncoated beads and put
into a fresh 1.5 ml tube.
3. Spin the beads at 21000 × g 2 minutes.
4. Aspirate most of the supernatant without disturbing or
drawing up the beads.
5. Pellet as many times as needed to remove supernatant
without disturbing the beads.
6. Vortex the pellet
7. During the final spin, measure out Sulfo-NHS and EDC
and dilute to 50 mg/ml. Once resuspended, the reagents
must be used within 10 minutes.
8. Add 80 µl chilled Monobasic Sodium Phosphage, pH
6.3
9. Add 10 µl 50 mg/ml Sulfo-NHS to the microspheres.
10. Vortex.
11. Add 10 µl 50 mg/ml EDC to the microspheres
12. Vortex
13. Incubate on plate shaker 140 rpm 20 minutes at room
temperature in the dark.
14. During the incubation take the prepared antigen and
dilute it with MES (50 mM pH 6.0)
15. Centrifuge beads 21000 × g 2 minutes
16. Discard supernatant and vortex the pellet
17. Wash with 250 µl MES (must use MES to wash or coat-
ing will not work)
18. Repeat step 14–16
19. Pull the supernatant off of the second wash. Vortex the
bead pellet
20. Add the 250 µl prepared antigen made in step 17 to
the beads.
21. Vortex.
22. Incubate at room temperature in the dark for 2 hours
on rotator.
Journal of Negative Results in BioMedicine 2007, 6:6 />Page 7 of 8
(page number not for citation purposes)
23. Centrifuge 21000 × g 2 minutes. Pull the supernatant
and vortex the pellet
24. Wash with 250 µl PBS-Tween20
25. Repeat steps 22–23 one more time
26. Centrifuge 21000 × g 2 minutes and pull supernatant.
Vortex the pellet
27. Resuspend in 250 µl PBS-TBN for blocking
28. Incubate by rotation 30 minutes in the dark at room
temperature.
29. Centrifuge 21000 × g 2 minutes, pull supernatant, vor-
tex the pellet and resuspend in 1 ml PBS-TBN.
30. Count beads by diluting 1:50 (10 µl beads in 490 µl
PBS/Tw) and running 100 µl in three wells. Average the
bead count.
Experiments
Summary
Use single monkey serum at the same dilution in each
well using multiple bead sets detecting the same antigens.
A set of at plates of identical sera with several identical
assays was done against 32 wells × 3 assays per plate.
Prior protocol for all
1. Deactivate 3 ml of monkey serum at 56 C for 30 min-
utes in BSL-2.
2. Aliquot to 0.5 ml per tube. Refreeze. Intention is to
remove number of freezings of sera as a variable.
Serum used: 1.5 milliliters of serum from monkey
#26082.
This monkey is known positive for:
• SRV, CMV and SFV
Known to be negative for:
• SIV, STLV, HPV2
Serum was deactivated on 05/27/2006.
One freeze/thaw cycle occurred for all sera in study.
The tests were executed on both Luminex in the CCM
(Center for Comparative Medicine) and the Bioplex
machine at CNPRC (California National Primate
Research Center).
Protocol-3: 2 plates
Rationale
Previous pre-trial has shown that some bead counts cross
contaminate from well to well at up to 4 wells beyond last
well containing sample and beads.
Purposes
• Determine how many beads contaminate from well to
well in machine.
• Variance of cross contamination.
N
• N = 24 per plate × 2 plates = 48
1. Prepare 2 chilled plates with 70 µl chilled PBS-Tween.
2. Prepare 1 dilution of monkey serum in Prionex,.
a. 1:100
3. Prepare enough of each dilution to have 50 µl of dilute
sera per well for a final concentration of 1/2 the pre-plate
concentration.
4. Put each dilution in row A and row E of each plate.
5. Fill rows B, C, D and F, G, H with PBS.
6. Beads are only placed in rows A and E.
7. Place bead mix composed of one of each of the below:
19 uncoated
22 uncoated
25 uncoated
32 uncoated
41 uncoated
89 uncoated
173 SFV 12.5 ug/ml
into each well.
8. Standard protocol for incubation, washing, and PE
placement.
Acknowledgements
The author would like to acknowledge Joann Yee and the California Pri-
mate Research Paul Luciw is thanked for use of laboratory facilities; Resmi
Publish with BioMed Central and every
scientist can read your work free of charge
"BioMed Central will be the most significant development for
disseminating the results of biomedical research in our lifetime."
Sir Paul Nurse, Cancer Research UK
Your research papers will be:
available free of charge to the entire biomedical community
peer reviewed and published immediately upon acceptance
cited in PubMed and archived on PubMed Central
yours — you keep the copyright
Submit your manuscript here:
/>BioMedcentral
Journal of Negative Results in BioMedicine 2007, 6:6 />Page 8 of 8
(page number not for citation purposes)
Ravindran for collaboration. Joann Yee and the California Primate Research
Center for generosity in supplying both the sera for these experiments, and
use of facilities to run assays on the CNPRC Bioplex. Imran Khan, Melanie
Ziman, and Sara Mendoza contributed to creation of the monkey serum
diagnostic microbead sets used in this work. The laboratory of Thomas
North is thanked for use of facilities. This work was supported by BW Edu-
cation and Forensics of Cheyenne, Wyoming, and KonnectWorld, Inc. of
Davis, California.
References
1. Ando R: Answers to questions about Bioplex instrument.
Edited by: Hanley B. Davis, CA ; 2006:Probes have 5 small holes at the
tip. Two laser light sources are present, a red and a green. Bioplex
automation processes column by row, just like Luminex.
2. Dean D: Questions about Luminex - Responses from Field
Service. Edited by: Hanley B. Davis, CA , Bio-Rad; 2006:Bio-Plex
uses three APD's (Avalanche Photodiodes) and one PMT (Photo Mul-
tiplier Tube) to detect the fluorescent signals of the beads.