Báo cáo khoa hoc:" Functional polymorphisms in the promoter regions of MMP2 and MMP3 are not associated with melanoma progression" potx
Bạn đang xem bản rút gọn của tài liệu. Xem và tải ngay bản đầy đủ của tài liệu tại đây (292.58 KB, 8 trang )
BioMed Central
Page 1 of 8
(page number not for citation purposes)
Journal of Negative Results in
BioMedicine
Open Access
Research
Functional polymorphisms in the promoter regions of MMP2 and
MMP3 are not associated with melanoma progression
Javier Cotignola
1
, Pampa Roy
1
, Ami Patel
2
, Nicole Ishill
1
, Shivang Shah
1
,
Alan Houghton
2
, Daniel Coit
3
, Allan Halpern
2
, Klaus Busam
4
,
Marianne Berwick
5
and Irene Orlow*
1
Address:
1
Epidemiology and Biostatistics, Memorial Sloan-Kettering Cancer Center, New York, NY, USA,
2
Department of Medicine, Memorial
Sloan-Kettering Cancer Center, New York, NY, USA,
3
Department of Surgery, Memorial Sloan-Kettering Cancer Center, New York, NY, USA,
4
Pathology Department, Memorial Sloan-Kettering Cancer Center, New York, NY, USA and
5
Division of Epidemiology, University of New Mexico,
Albuquerque, NM, USA
Email: Javier Cotignola - ; Pampa Roy - ; Ami Patel - ;
Nicole Ishill - ; Shivang Shah - ; Alan Houghton - ;
Daniel Coit - ; Allan Halpern - ; Klaus Busam - ;
Marianne Berwick - ; Irene Orlow* -
* Corresponding author
Abstract
Background: The matrix metalloproteinases (MMPs) are enzymes that cleave various
components of the extracellular matrix (ECM) and basement membranes. MMPs are expressed in
melanocytes and their overexpression has been linked to tumor development, progression and
metastasis. At the genetic level, the following functional promoter polymorphisms are known to
modify the gene transcription: -1306 C/T and -735 C/T in the MMP2 gene, and -1171 5A/6A in the
MMP3 gene. Functional polymorphisms in MMP genes' promoter regions may modulate the risk for
melanoma progression.
Methods: We evaluated MMP2 and MMP3 germline polymorphisms in a group of 1002 melanoma
patients using PCR-based methods, including fragment size analysis and melting temperature
profiles. Two-sided Chi-Square, Cochran-Armitage tests for trend, Fisher's exact tests, and
Kendall's Tau tests were performed to evaluate the associations between genotype and various
clinical and epidemiologic factors. Multivariate analyses were conducted using logistic regression,
adjusting for known melanoma confounders such as age, sex, phenotypic index, moles, freckles, and
race. Survival estimates were computed using the Kaplan-Meier method and differences in survival
were assessed using the log rank test.
Results: All genotypes were in Hardy-Weinberg equilibrium. After adjustment for age, sex and
phenotypic characteristics of melanoma risk, no significant associations were identified with the
clinical, pathological, and epidemiological variables studied. The melting profile for MMP2 -735 C/
T identified a new change in one sample. A new PCR-amplification followed by direct sequencing
confirmed a heterozygote G to A substitution at position -729.
Conclusion: This study does not provide strong evidence for further investigation into the role
of the MMP2 and MMP3 variants in melanoma progression.
Published: 24 October 2007
Journal of Negative Results in BioMedicine 2007, 6:9 doi:10.1186/1477-5751-6-9
Received: 5 January 2007
Accepted: 24 October 2007
This article is available from: />© 2007 Cotignola et al; licensee BioMed Central Ltd.
This is an Open Access article distributed under the terms of the Creative Commons Attribution License ( />),
which permits unrestricted use, distribution, and reproduction in any medium, provided the original work is properly cited.
Journal of Negative Results in BioMedicine 2007, 6:9 />Page 2 of 8
(page number not for citation purposes)
Background
The matrix metalloproteinases (MMPs) are enzymes that
cleave various components of the extracellular matrix
(ECM) and basement membranes. Upon degradation, the
ECM releases and activates ECM-bound cytokines and
ECM fragments which modulate cell growth and migra-
tion as well as angiogenesis [1].
MMPs are expressed in melanocytes and their overexpres-
sion has been linked to tumor development, progression
and metastasis [2-5]. Certain MMPs are associated with
generalized growth and expansion of the cell mass while
others are involved in in situ tumor progression, invasion
of microvasculature, and metastasis [6]. Nikkola et al.
tested the expression of MMPs in 56 metastatic melano-
mas by immunohistochemistry and found that patients
with positive tumors for MMP1 and MMP3 had a shorter
disease-free survival when compared to those with nega-
tive lesions (MMP1, p = 0.0383; MMP3, p = 0.0294) [7].
In another study, investigators have found strong expres-
sion (> 40% cells stained) of MMP2 in 78% of the inva-
sive melanomas [8].
At the genetic level, two functional promoter single nucle-
otide polymorphisms (SNPs) have been described in the
MMP2 gene [rs243865: -1306 C/T; and rs2285053: -735
C/T], and one functional insertion/deletion in the pro-
moter region of the MMP3 gene [rs3025058: -1171 5A/
6A]. All changes produce either a disruption or creation of
binding sites for transcriptional regulators which modify
the gene transcription and, in turn, the enzymatic levels
[9-11]. Specifically, for MMP2 both C to T transitions dis-
rupt Sp1 binding sites and, consequently, decrease the
transcription rate [9,11]. For MMP3, the insertion of an A
at position -1171 allows for the binding of a transcrip-
tional repressor [10].
Functional SNPs in MMP genes' promoter regions may
modify the production of proteolytic enzymes, and in
turn modify the risk for melanoma progression. There-
fore, in this study, we sought to determine whether an
association between MMP2 and MMP3 SNPs and disease
progression exists. Functional promoter polymorphisms
in MMP2 and MMP3 genes were examined in a cohort of
1002 melanoma patients.
Results
This study included 1002 melanoma patients with stages
0 (in situ) to IV. Nine hundred and forty eight (95%) were
cutaneous malignant melanoma (CMM) patients; the rest
included mucosal melanomas (n = 11), other non-cutane-
ous sites (n = 1) and unknown primary sites (n = 42).
Ninety-six percent were Caucasians followed by Hispanic
(1.1%), black non-Hispanic (1.1%), and Asian/Indian
(0.3%); fifteen patients had missing information on eth-
nicity and one declined to answer the question about race
(1.5%). The age at diagnosis ranged from 5 to 89 years old
(mean = 54 and median = 55). The genotyping success
rate was in the range from 98.2 to 99.5% and the retesting
of the 10% randomly selected samples was 100% con-
cordant.
MMP2 -1306 C/T and -735 C/T
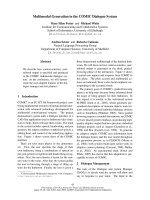
One sample showed an unexpected profile in the melting
temperature analysis of -735 C/T that did not match any
of the three possible genotypes (Figure 1). The direct
sequencing on this sample showed a heterozygote G to A
substitution at position -729 [ss_49785040], and the
homozygote wild type C allele at position -735. The anal-
ysis with the UCSC Genome Browser did not show any
conserved sequence within the region bearing the new
variant [12].
The allele frequencies for MMP2 -1306 C/T were similar to
those reported in the dbSNP for the Caucasian population
CAUC1 [13]. The frequencies for MMP2 -735 C/T were
also similar to those describe in the dbSNP, even though
these data were only based on a Japanese population.
Both genotypes were in Hardy-Weinberg equilibrium.
When compared to the patients' number of moles, the -
1306TT genotype was more frequent among those
patients with 'many moles' (p < 0.01); however, after
adjustment for age, sex, phenotypic index, freckles, and
race this association was no longer significant (Table 1).
No other significant associations were found between the
MMP2 SNPs and the phenotypic and clinico-pathological
melanoma features.
MMP3 -1171 5A/6A
The MMP3 genotypes were in Hardy-Weinberg equilib-
rium. In our population, this polymorphism showed a
similar distribution to the one reported in the dbSNP for
the Italian panel, but the inverse distribution was seen
when compared to the PGA-European panel. Although
this difference was not significant (p = 0.73). The 5A allele
was more common in patients with low Clark level
melanomas (p = 0.04) and with tumors with infiltrating
lymphocytes (p = 0.04) (Table 2). No associations were
seen when we adjusted for confounders.
We did not find any significant cumulative effect between
the number of high-activity alleles and the clinical and
epidemiological variables, except for ulceration. Presence
of ulceration occurred less frequently in individuals with
higher numbers of alleles (p = 0.03). None of the poly-
morphisms showed associations with progression, sur-
vival and recurrence when we computed the Kaplan-Meier
estimates and compared differences in survival based on
genotypes using a log rank test (data not shown).
Journal of Negative Results in BioMedicine 2007, 6:9 />Page 3 of 8
(page number not for citation purposes)
Discussion
After adjustment for age, sex, race, phenotypic index, and
freckles, we did not observe any significant associations
between the matrix metalloproteinase 2 or matrix metal-
loproteinase 3 polymorphisms and the clinicopathologi-
cal and epidemiological variables studied.
Associations between polymorphisms in MMPs and risk
of development or progression of the disease have been
previously reported in various types of malignancies,
including esophageal, breast, and lung cancers [11,14,15]
although in some cases the association was not evident
perhaps due to the ethnicity and number of cases studied
[16]. For MMP2, a case-control study showed that patients
with esophageal squamous cell carcinoma carrying the -
1306CC or -735CC genotypes had an increased risk of
developing cancer (odds ratio (OR) = 1.52, 95% confi-
dence interval (CI) = 1.17–1.96; and OR = 1.30, 95% CI =
1.04–1.63 respectively). A stronger association was seen
when individuals with the C
-1306
-C
-735
haplotype were
compared to subjects with the T
-1306
-T
-735
haplotype (OR
= 6.53; 95% CI = 2.78–15.33) [11]. The MMP3 5A allele
was associated with a poorer prognosis in breast cancer
patients [14]. Su et al found no associations between indi-
vidual MMP1, 3, and 12 and risk of lung cancer although
haplotyping revealed a higher risk among never smokers
(adjusted OR 3.65, 95% CI:1.62–8.20)[15].
Our genotyping analysis identified a new G to A variation
in the MMP2 promoter at position -729. This new varia-
tion is not situated within a conserved sequence; there-
fore, it might not have a functional consequence on the
regulation of transcription of MMP2. Even though the
functional potential of this nucleotide substitution
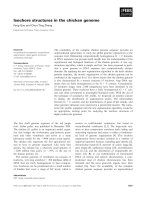
Genotyping of MMP2 -735 C/T SNP by melting temperature analysisFigure 1
Genotyping of MMP2 -735 C/T SNP by melting temperature analysis. (A) The top panels depict the derivative melt-
ing curve plots obtained for (from left to right): MMP2 -735CC, MMP2 -735CT, MMP2 -735TT, and an unexpected profile
(UKN) showing peaks between 62 and 66°C (B) The bottom panel depicts the wild type (left) and a new variant (right) at posi-
tion -729 near the target SNP (white arrow). Reverse sequencing revealed a novel mutation corresponding to a G to A change
at position -729 in the sense strand (black arrow).
40 50 60 70 80 40 50 60 70 80 40 50 60 70 80 40 50 60 70 80
A
B
T
T C C C A G G A G G G TT C C C A G G A G G G T
TT
UKN
CTCC
Journal of Negative Results in BioMedicine 2007, 6:9 />Page 4 of 8
(page number not for citation purposes)
remains to be determined by in vitro assays, the low fre-
quency (0.1%) found in the present study, does not pre-
clude further characterization.
The MMP3 allele with high transcriptional activity 5A was
found more frequently in patients with melanomas con-
taining infiltrating lymphocytes and showing low Clark
level lesions. It is of note that we are unable to verify
whether the missingness of data on TILs in this study is
informative therefore these results should be considered
preliminary. Although it seems to be a trend between this
SNP and TILs and Clark level, the associations lose signif-
icance after adjusting for age, sex, phenotypic index,
moles, freckles, and race.
Conclusion
The MMP2 and MMP3 transcriptionally more active poly-
morphisms appear more frequently among individuals
Table 1: MMP2 genotypes vs clinical, pathological and epidemiological variables
Variables MMP2
-1306 C/T p-value* -735 C/T p-value*
CC CT TT CC CT TT
Stage at Diagnosis
0 34 (59%) 19 (33%) 5 (9%) 48 (83%) 10 (17%) 0 (0%)
I 320 (64%) 159 (32%) 23 (5%) 365 (73%) 123 (25%) 13 (3%)
II 152 (65%) 72 (31%) 9 (4%) 184 (78%) 49 (21%) 2 (1%)
III 105 (63%) 54 (32%) 9 (5%) 131 (79%) 32 (19%) 3 (2%)
IV 6 (67%) 3 (33%) 0 (0%) 0.92 4 (44%) 5 (56%) 0 (0%) 0.08
Primary Clark Level
I 34 (59%) 19 (33%) 5 (9%) 48 (83%) 10 (17%) 0 (0%)
II 70 (65%) 36 (33%) 2 (2%) 79 (74%) 23 (22%) 5 (5%)
III 89 (60%) 48 (32%) 12 (8%) 115 (77%) 32 (21%) 3 (2%)
IV 308 (64%) 155 (32%) 22 (5%) 358 (74%) 116 (24%) 10 (2%)
V 51 (74%) 14 (20%) 4 (6%) 0.20 54 (78%) 15 (22%) 0 (0%) 0.44
Thickness (mm)
In situ 34 (59%) 19 (33%) 5 (9%) 48 (83%) 10 (17%) 0 (0%)
< 1.01 201 (63%) 107 (33%) 12 (4%) 237 (74%) 72 (23%) 10 (3%)
1.01 – 2.00 174 (64%) 81 (30%) 15 (6%) 199 (73%) 68 (25%) 4 (2%)
2.01 – 4.00 100 (63%) 50 (31%) 10 (6%) 124 (78%) 33 (21%) 2 (1%)
> 4.00 81 (68%) 35 (29%) 4 (3%) 0.72 94 (78%) 25 (21%) 1 (1%) 0.44
TILs
Absent 129 (63%) 67 (33%) 9 (4%) 161 (79%) 40 (20%) 3 (2%)
Non-brisk 262 (67%) 111 (28%) 21 (5%) 289 (73%) 95 (24%) 10 (3%)
Brisk 19 (63%) 9 (30%) 2 (7%) 0.80 21 (68%) 10 (32%) 0 (0%) 0.32
Distant Metastasis
Yes 86 (67%) 39 (30%) 4 (3%) 97 (76%) 29 (23%) 2 (2%)
No 543 (63%) 281 (32%) 42 (5%) 0.28 653 (75%) 196 (23%) 17 (2%) 0.88
Intransit Metastasis
No 590 (63%) 302 (32%) 46 (5%) 705 (75%) 216 (23%) 16 (2%)
Yes 18 (67%) 9 (33%) 0 (0%) 0.44 22 (82%) 3 (11%) 2 (7%) 0.96
Number of Moles
None 161 (62%) 84 (33%) 13 (5%) 201 (77%) 54 (21%) 5 (2%)
Few 311 (63%) 166 (33%) 20 (4%) 380 (77%) 105 (21%) 11 (2%)
Moderate 112 (67%) 51 (30%) 5 (3%) 115 (69%) 49 (30%) 2 (1%)
Many 22 (55%) 11 (28%) 7 (18%) < 0.01 29 (73%) 10 (25%) 1 (3%) 0.40
Phenotypic Index
1 (low risk) 26 (68%) 11 (29%) 1 (3%) 31 (82%) 6 (16%) 1 (3%)
2 132 (63%) 66 (32%) 11 (5%) 156 (75%) 47 (23%) 4 (2%)
3 206 (65%) 93 (29%) 18 (6%) 231 (73%) 76 (24%) 10 (3%)
4 191 (59%) 122 (38%) 11 (3%) 254 (78%) 68 (21%) 4 (1%)
5 (high risk) 73 (70%) 27 (26%) 5 (5%) 0.28 76 (73%) 28 (27%) 0 (0%) 0.36
* The associations were examined in three different ways (see statistical methods for a detailed explanation). The p-values shown refer to the analysis
of the three individual genotypes, and appear in bold font if ≤ 0.05. The significance was lost after adjustment for age, sex, phenotypic index, moles,
freckles, and race.
Journal of Negative Results in BioMedicine 2007, 6:9 />Page 5 of 8
(page number not for citation purposes)
with many moles, tumor infiltrating lymphocytes, and
low Clark level, and the number of alleles seems associ-
ated with absence of ulceration. However, after control-
ling for known melanoma confounders the associations
are non-significant. This study does not provide strong
evidence for further investigation of MMP2 and MMP3
genetic variants in melanoma progression.
Methods
Study population
Melanoma patients with stages 0 to IV were recruited at
Memorial Hospital (New York, USA) between March
1974 and August 2005. Of these, 763 were newly diag-
nosed at Memorial Hospital and 239 were prevalent cases.
The study protocol was approved by the Memorial Sloan-
Kettering Cancer Center (MSKCC) Institutional Review
Board (IRB). Ninety-six percent of the patients
approached agreed to participate in the study and signed
an informed consent. Patients filled out a short self-
Table 2: MMP3 genotypes vs clinical, pathological and epidemiological variables
Variables MMP3 -1171 5A/6A
5A5A 5A6A 6A6A p-value*
Stage at Diagnosis
0 9 (16%) 36 (63%) 12 (21%)
I 96 (19%) 238 (48%) 162 (33%)
II 32 (14%) 124 (54%) 75 (33%)
III 27 (16%) 81 (49%) 57 (35%)
IV 2 (22%) 5 (56%) 2 (22%) 0.36
Primary Clark Level
I 9 (16%) 36 (63%) 12 (21%)
II 22 (21%) 54 (51%) 29 (28%)
III 28 (19%) 73 (49%) 47 (32%)
IV 72 (15%) 241 (50%) 165 (35%) 0.36
V 9 (13%) 39 (57%) 21 (30%) 0.04
£
Thickness (mm)
In situ 9 (16%) 36 (63%) 12 (21%)
< 1.01 60 (19%) 150 (48%) 105 (33%)
1.01 – 2.00 45 (17%) 132 (49%) 90 (34%)
2.01 – 4.00 28 (18%) 78 (49%) 53 (33%)
> 4.00 12 (10%) 71 (60%) 35 (30%) 0.16
TILs
Absent 28 (14%) 101 (50%) 73 (36%)
Non-brisk 65 (17%) 208 (54%) 114 (30%) 0.32
Brisk 4 (13%) 20 (65%) 7 (23%) 0.04
£
Distant Metastasis
Yes 21 (16%) 69 (54%) 39 (30%)
No 148 (17%) 428 (50%) 277 (33%) 0.84
Intransit Metastasis
No 160 (17%) 468 (51%) 296 (32%)
Yes 6 (22%) 12 (44%) 9 (33%) 0.80
Number of Moles
None 41 (16%) 136 (53%) 79 (31%)
Few 87 (18%) 240 (49%) 165 (34%)
Moderate 27 (17%) 87 (54%) 48 (30%)
Many 9 (23%) 21 (53%) 10 (25%) 0.76
Phenotypic Index
1 (low risk) 6 (16%) 15 (41%) 16 (43%)
2 28 (14%) 105 (51%) 73 (35%)
3 59 (19%) 157 (50%) 98 (31%)
4 59 (18%) 172 (54%) 89 (28%)
5 (high risk) 18 (18%) 47 (46%) 38 (37%) 0.36
*The associations were examined in three different ways (see statistical methods for a detailed explanation). The p-values shown refer to the
analysis of the three individual genotypes, and appear in bold font if ≤ 0.05. The significance was lost after adjustment for age, sex, phenotypic index,
moles, freckles, and race.
£
Genotypes 5A6A and 6A6A combined.
Journal of Negative Results in BioMedicine 2007, 6:9 />Page 6 of 8
(page number not for citation purposes)
administered questionnaire that included information on
gender, race, age, family history, moles and freckling pat-
tern, nevus density, hair and eye color, propensity to sun-
burn and ability to tan after sun exposure. The
information on hair color, eye color and propensity to tan
or sunburn were combined into a single variable, the 'phe-
notypic index' [17]. This index, with minimum and max-
imum values of 1 and 5, represents the sum of points
assigned to the following phenotypic features: hair color
(1 if brown/black; 2 if light brown/blond; 3 if red/
auburn); eye color (0 if brown; 1 if green/hazel/blue); and
propensity to tan or sunburn (0 if tend to tan; 1 if tend to
sunburn). We also obtained clinicopathological informa-
tion including presence of dysplastic nevi, multiple pri-
mary tumors, stage at diagnosis and at follow-up (based
on the AJCC 2002 classification), disease status, disease
progression and survival among others. The median fol-
low-up period was 40 months (range, 1–493 months, n =
1000). The characteristics of the study group are shown in
Table 3.
Biospecimens
Buccal cells were collected from mouthwash or buccal
swabs (n = 985). Blood was also obtained from some
individuals (n = 17). DNA from buccal cells was extracted
using Puregene
®
kits (Gentra Systems Inc., Minneapolis,
USA), and blood was extracted with the QIAamp DNA
Blood kit (QIAGEN Inc. Valencia, USA) using manufac-
turer's recommendations. DNA concentration was meas-
ured by spectrophotometry at 260 nm in a Spectramax
Plus 384 (Molecular Devices, Sunnyvale, USA). The DNA
quality was determined by the ratio A260/A280.
Genotyping
The polymorphism MMP3 -1171 5A/6A were studied by
fragment size analysis as previously described by Zinzin-
dohoue [18]. The MMP2 substitutions were assessed by
melting temperature analysis using the LightTyper instru-
ment (Roche Applied Science, Indianapolis, USA) [19].
Briefly, 10–20 ng of genomic DNA were amplified using
0.5 units of AmpliTaq DNA polymerase (Applied Biosys-
tems, Foster City, USA), 1.5 mM MgCl2, 1× PCR buffer,
200 µM dNTPs (Invitrogen, California, USA), 0.5 µM of
each primer (forw: 5'-CTTTCTTCTCCAGTGCC-3'; rev: 5'-
CCCTAAACTAGTAAAGAC AATCA-3' for MMP2 -1306 C/
T; or forw: 5'-CAGTGGGGTCTTTGTGACCT, rev: 5'-
GCGTTAGAGACGTTGGAACC-3' for MMP2 -735 C/T),
and 0.2 µM of probe (5'-fluorescein-CCCAGCACTCCAC-
CTCTTT-3' for MMP2 -1306 C/T; or 5'-fluorescein-GAAT-
GCGGACCCTCCTGG-3' for MMP2 -735 C/T). Amplified
samples were heated at 95°C for 2 min, cooled down to
room temperature, and placed into the LightTyper instru-
ment. Samples that failed were repeated once or twice as
needed. All experiments included known controls and
blanks. Genotyping of 5 to 10 % random selected samples
Table 3: Clinico-pathological characteristics of the study group
Variable* Patients %
Gender
Males 573 57.2
Females 429 42.8
Family History
Yes 167 16.7
No 826 82.4
Unknown 9 0.9
Multi-primary Melanoma
Yes 152 15.2
No 849 84.7
Unknown 1 0.1
Stage at Diagnosis
0585.8
I 504 50.3
II 235 23.4
III 169 16.9
IV 9 0.9
Unstagable
¥
27 2.7
Current Stage
0565.6
I 435 43.4
II 159 15.9
III 217 21.7
IV 129 12.9
Unstagable
¥
60.5
Primary Clark Level
I585.8
II 108 10.8
III 150 14.9
IV 489 48.8
V696.9
Unknown 128 12.8
Thickness (mm)
In situ 58 5.8
< 1.01 321 32.0
1.01 – 2.00 272 27.1
2.01 – 4.00 161 16.1
> 4.00 121 12.1
Unknown 69 6.9
Tumor Infiltrating Lymphocytes (TILs)
Absent 206 20.6
Non-brisk 397 39.6
Brisk 31 3.1
unknown 368 36.7
Distant Metastasis
Yes 130 13.0
No 870 86.8
N/A
ϕ
20.2
Intransit Metastasis
No 942 94.0
Yes 27 2.7
N/A
ϕ
33 3.3
Number of Moles
None 260 25.9
Few 498 49.7
Moderate 169 16.9
Many 40 4.0
N/A
ϕ
35 3.5
Phenotypic Index
Journal of Negative Results in BioMedicine 2007, 6:9 />Page 7 of 8
(page number not for citation purposes)
was done as quality control and the results were read by 2
independent laboratory members.
Sequencing
Direct sequencing was done in samples that showed
unclear genotyping profiles. Briefly, samples were PCR
amplified and then purified with a Qiagen purification kit
following the manufacturer's recommendations (QIA-
GEN Inc., Valencia, USA). One to 10 ng of each purified
sample were sequenced in the DNA Sequencing Core
Facility at Memorial Sloan-Kettering Cancer Center. Sam-
ples were run in an ABI 3730-XLDNA Analyzer (Applied
Biosystems, Foster City, USA). Sequencing electrophero-
grams were read at least twice, reviewed manually and
with the Mutation Surveyor software, version 2.41 (Soft-
Genetics LLC, State College, USA).
Bioinformatics
The University of California Santa Cruz (UCSC) Genome
Browser Database /> was used to
evaluate whether the undescribed mutations lay on con-
served regulatory sequences and to determine empirically
the functionality of the new variation.
Statistical analysis
Two-sided Chi-Square tests, Cochran-Armitage tests for
trend, and Fisher's exact tests were performed to test for
association between genotype and various clinical and
epidemiologic factors. Associations were examined in
three different ways: comparing the homozygote high-
transcriptional-activity allele group versus those having at
least one copy of the low-transcriptional-activity allele,
comparing the homozygote low-transcriptional-activity
allele group versus all others, and looking at all three gen-
otypes separately. Multivariate analyses were conducted
using logistic regression, adjusting for age, sex, phenotypic
index, moles, freckles, and race. Associations between
number of high-transcriptional-activity alleles and the
clinical and epidemiological variables were examined
using the Chi-square and Kendall's Tau tests. Associations
were considered significant when p < 0.050. To investigate
associations between SNP and overall survival, time was
measured from initial date of diagnosis with melanoma to
date of death or last follow-up. Potential associations
between genotypes and time to recurrence, defined as a
patient's first recurrence of melanoma (local, intransit,
nodal and/or systemic), and time to disease progression
defined as progression to stage III or IV, were also exam-
ined. Survival estimates were computed using the meth-
ods of Kaplan and Meier and comparisons between
genotypes were made using the log-rank test. All statistical
analyses were carried out using SAS version 9.1 (SAS Insti-
tute, Cary, NC).
Abbreviations
AJCC, American Joint Committee on Cancer ; CI, confi-
dence interval; CMM, cutaneous malignant melanoma;
dbSNP, SNP database from the NCBI; ECM, extracellular
matrix; MMP, matrix metalloproteinase; OR, odds ratio;
SNP, single nucleotide polymorphism; TILs, tumor infil-
trating lymphocytes; UCSC, University of California Santa
Cruz.
Competing interests
The author(s) declare that they have no competing inter-
ests.
Authors' contributions
JC carried out the genotyping, participated in the selection
of SNPs, analysis, and prepared the manuscript; PR and SS
participated in the genotyping; AP coordinated the
patients' accrual and updated the clinicopathological and
epidemiological database; NI performed the statistical
analysis and contributed to the materials and methods
section; DC, AH and AH contributed with subject accrual
and discussions; KB contributed with pathology review;
BR and CS participated in the analysis and interpretation
of the results obtained with the in-silico methods; MB par-
ticipated in the design and discussions; IO conceived and
coordinated the study, participated in its design, analysis,
discussion of results, and in the preparation of the manu-
script. All authors read and approved the final manu-
script.
Acknowledgements
The authors thank Brian Clas for technical help and discussions; Zeah Ven-
itelli, Erica Zucker, Judy Fong, Susan Johnson, and Jennifer Langerfeld for
helping with patients accrual; and Christine Hanlon for managing and main-
taining the Melanoma Disease Management Team (DMT) database. This
study was supported by the Lita Annenberg Hazen Foundation, by The
Society of Memorial Sloan-Kettering Cancer Center, and by The Memorial
Sloan-Kettering Cancer Center Cancer Education Program (5 R25 CA
20449-28).
1 (low risk) 38 3.8
2 210 21.0
3 317 31.6
4 328 32.7
5 (high risk) 105 10.5
N/A
ϕ
40.4
Site of the Primary Melanoma
Extremities 535 53.4
Trunk 342 34.1
Head and Neck 71 7.1
Non-cutaneous
ω
12 1.2
Unknown 42 4.2
* With the exception of 'current stage', the variables were recorded
at the initial diagnosis.
¥
patients with missing data on the 'T' classification.
ω
90% mucosal melanomas and 10% other sites.
ϕ
N/A: data not available.
Table 3: Clinico-pathological characteristics of the study group
Publish with BioMed Central and every
scientist can read your work free of charge
"BioMed Central will be the most significant development for
disseminating the results of biomedical research in our lifetime."
Sir Paul Nurse, Cancer Research UK
Your research papers will be:
available free of charge to the entire biomedical community
peer reviewed and published immediately upon acceptance
cited in PubMed and archived on PubMed Central
yours — you keep the copyright
Submit your manuscript here:
/>BioMedcentral
Journal of Negative Results in BioMedicine 2007, 6:9 />Page 8 of 8
(page number not for citation purposes)
References
1. McCawley LJ, Matrisian LM: Matrix metalloproteinases: they're
not just for matrix anymore! Curr Opin Cell Biol 2001, 13:534-540.
2. Hofmann UB, Westphal JR, Van Muijen GN, Ruiter DJ: Matrix met-
alloproteinases in human melanoma. J Invest Dermatol 2000,
115:337-344.
3. Hofmann UB, Westphal JR, Zendman AJ, Becker JC, Ruiter DJ, van
Muijen GN: Expression and activation of matrix metallopro-
teinase-2 (MMP-2) and its co-localization with membrane-
type 1 matrix metalloproteinase (MT1-MMP) correlate with
melanoma progression. J Pathol 2000, 191:245-256.
4. Vaisanen A, Tuominen H, Kallioinen M, Turpeenniemi-Hujanen T:
Matrix metalloproteinase-2 (72 kD type IV collagenase)
expression occurs in the early stage of human melanocytic
tumour progression and may have prognostic value. J Pathol
1996, 180:283-289.
5. Pasco S, Ramont L, Maquart FX, Monboisse JC: Control of
melanoma progression by various matrikines from base-
ment membrane macromolecules. Crit Rev Oncol Hematol 2004,
49:221-233.
6. Bodey B, Bodey B Jr, Siegel SE, Kaiser HE: Matrix metalloprotein-
ase expression in malignant melanomas: tumor-extracellu-
lar matrix interactions in invasion and metastasis. In Vivo
2001, 15:57-64.
7. Nikkola J, Vihinen P, Vlaykova T, Hahka-Kemppinen M, Kahari VM,
Pyrhonen S: High expression levels of collagenase-1 and
stromelysin-1 correlate with shorter disease-free survival in
human metastatic melanoma. Int J Cancer 2002, 97:432-438.
8. Simonetti O, Lucarini G, Brancorsini D, Nita P, Bernardini ML, Biagini
G, Offidani A: Immunohistochemical expression of vascular
endothelial growth factor, matrix metalloproteinase 2, and
matrix metalloproteinase 9 in cutaneous melanocytic
lesions. Cancer 2002, 95:1963-1970.
9. Price SJ, Greaves DR, Watkins H: Identification of novel, func-
tional genetic variants in the human matrix metalloprotein-
ase-2 gene: role of Sp1 in allele-specific transcriptional
regulation. J Biol Chem 2001, 276:7549-7558.
10. Ye S, Eriksson P, Hamsten A, Kurkinen M, Humphries SE, Henney
AM: Progression of coronary atherosclerosis is associated
with a common genetic variant of the human stromelysin-1
promoter which results in reduced gene expression. J Biol
Chem 1996, 271:13055-13060.
11. Yu C, Zhou Y, Miao X, Xiong P, Tan W, Lin D: Functional haplo-
types in the promoter of matrix metalloproteinase-2 predict
risk of the occurrence and metastasis of esophageal cancer.
Cancer Res 2004, 64:7622-7628.
12. University of California Santa Cruz (UCSC) Genome
Browser Database [ />]
13. National Center for Biotechnology Information (NCBI)
[ />]
14. Ghilardi G, Biondi ML, Caputo M, Leviti S, DeMonti M, Guagnellini E,
Scorza R: A single nucleotide polymorphism in the matrix
metalloproteinase-3 promoter enhances breast cancer sus-
ceptibility. Clin Cancer Res 2002, 8:3820-3823.
15. Su L, Zhou W, Asomaning K, Lin X, Wain JC, Lynch TJ, Liu G, Chris-
tiani DC: Genotypes and haplotypes of matrix metalloprotei-
nase 1, 3 and 12 genes and the risk of lung cancer.
Carcinogenesis 2006, 27:1024-1029.
16. Wang Y, Fang S, Wei L, Wang R, Jin X, Wen D, Li Y, Guo W, Wang
N, Zhang J: No association between the C-1562T polymor-
phism in the promoter of matrix metalloproteinase-9 gene
and non-small cell lung carcinoma. Lung Cancer 2005,
49:155-161.
17. Millikan RC, Hummer A, Begg C, Player J, de Cotret AR, Winkel S,
Mohrenweiser H, Thomas N, Armstrong B, Kricker A, et al.: Poly-
morphisms in nucleotide excision repair genes and risk of
multiple primary melanoma: the Genes Environment and
Melanoma Study. Carcinogenesis 2006, 27:610-618.
18. Zinzindohoue F, Lecomte T, Ferraz JM, Houllier AM, Cugnenc PH,
Berger A, Blons H, Laurent-Puig P: Prognostic significance of
MMP-1 and MMP-3 functional promoter polymorphisms in
colorectal cancer. Clin Cancer Res 2005, 11:594-599.
19. Bennett CD, Campbell MN, Cook CJ, Eyre DJ, Nay LM, Nielsen DR,
Rasmussen RP, Bernard PS: The LightTyper: high-throughput
genotyping using fluorescent melting curve analysis. Biotech-
niques 2003, 34:1288-1292. 1294–1285